Dissolution Rate Behaviour of Sulfur Coated Urea from Spouted Bed Coater using Box Behnken Design
Received: 17-Jul-2018 / Accepted Date: 07-Aug-2018 / Published Date: 14-Aug-2018 DOI: 10.4172/2329-8863.1000390
Keywords: Box behnken design; Spouted bed; Slow release fertilizer; Sulfur; Urea
Introduction
Urea is the most popular and economical nitrogen fertilizer used worldwide. Compared with other types of nitrogen sources, urea has the greatest nitrogen (N) content of 46% [1]. The amount of urea solubility in the water, causing leaching on urea into the soil before the plant can absorb the N content. In addition to leaching caused by rain and irrigation, N also can be wasted due to the evaporation of ammonia and urea decomposition. And it has been reported that about 55% of the urea fertilizer used is not absorbed by plants [2].
In general, fertilization at different times coincides with different growth stages to meet the nutritional needs of the plant. However, the technique requires more expensive, labor intensive, and operationally quite difficult [3]. This may add to the release of discharged fertilizer as harmful gas emissions (NH3, N2O, etc.) [4] and cause seed toxicity [5]. Therefore, the researchers formulated controlled release coated urea (CRCU) that serves to increase yields and reduce the effects of harmful gas emissions and seed toxicity [6]. Some of the growing CRCU coatings are thermo-plastics, resins, sulfur, etc. [1]. Sulfur becomes the best coating because it has many advantages, besides being the most effective coating also includes secondary nutrients of plants and agents that neutralize the soil alkalinity [7].
Some research on sulfur coated urea (SCU) with sulfur coatings has been done with various methods (rotating drum, fluidized bed and spouted bed). The coating process using spouted bed is better than other methods. The spout leads to a better urea circulation. SCU with sulfur coatings using spouted bed was first developed by Mathur and Epstein [8].
The coating of fertilizer to be used as SCU fertilizer is done in batch condition. The batch process produces a more evenly distributed sulfur layer than a continuous process because the particle distribution is almost uniform [9]. Therefore, urea coating using sulfur this time is done in spouted bed and takes place in batch. This research was conducted to know the dissolved process of sulfur coated urea with Box-Behnken Design.
Materials and Methods
Materials
Commercial urea granules with a nitrogen content of 46% were supplied by Petrokimia Gresik. The material selected as coating material was molten sulfur. Sulfur resists leaching or washing through the soil into the water supply. Commercial-grade sulfur was obtained from PT Belirang Kalisari. Molten sulfur as the material to coat the urea inside the spouted bed is made by melting the sulfur solids at 150°C [10].
Experimental equipment and procedure
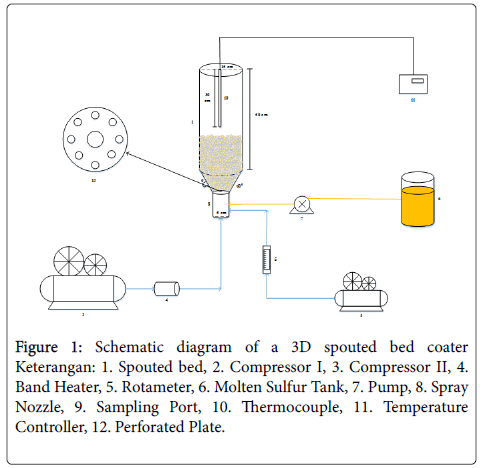
A spouted bed coater, shown in Figure 1, was used to coat the urea particles. This spouted bed have a cone-cylinder shape that has a diameter of 15 cm with a height of 50 cm. The cone section has a diameter of 5 cm (with an angle of 60°). There are 2 sets of readings and temperature controls used in the reactor i.e., temperature controller (Autonics TCN4M) and for sensors using 2 thermocouples. Thermocouple I is present in a 32 cm long molten sulfur tank mounted right in the middle of a sulfur molten tank and a thermocouple II is found in a 30 cm spouted bed mounted in the middle of a spouted bed. The spray nozzle in the coater has an internal diameter of 3 mm and an outer diameter of 6 mm. The air that gets into the spouted bed is heated first using a heater band. There are 2 band heater that will be used in this research. Band heater is a cylindrical electric heater and made of stainless steel. The band heater I has a diameter of 65 mm and a height of 100 mm and the band heater II has a diameter of 270 mm and a height of 220 mm.
In the first step, this study were carried out to evaluate the minimum spouting velocity (Vms). It was determined experimentally and using the empirical correlation proposed by Mathur and Gishler [11] (Equation 1) for a urea load of 1000 grams.
 (1)
(1)
The operating flow rate for the coating runs was set 10% superior to the minimum spouting velocity. Urea as much as 1000 grams is inserted into the spouted bed. The spout air compressor is turned on so as to cause cyclic movement of the urea pile. Once the steady state is reached, the heater is switched on. Then the temperature inside the bed is set at the spouting temperature variations of 60°C, 70°C and 80°C. After the temperature inside the bed is constant, the atomizing compressor of the water is ignited, and the molten sulfur tank valve is opened to drain molten sulfur to the nozzle spray.
Molten sulfur in spray nozzle collides with high-speed atomizing water to form droplet-droplet. Then the droplets are in contact with urea particles on a counter-current basis to form a layer of sulfur on the outer skin of urea particles. The sulfur layer will dry out due to the time when it fell to the bottom of the bed as an annulus. The urea particles will be circulated and re-coated when pushed toward the upper bed. The molten sulfur flowrate is set at 8 mL/minute. This process lasts for 20 minutes, where every 5 minutes after 10 minutes is taken through port sampling as much as 10 gram as a coating time factor. Then, 10 g sample SCU was placed in 50 mL of distilled water (38°C) in an Erlenmeyer flask and sealed. Every 24 hour for 7 days (d7), 0.01 mL of solution was sampled. The extracted samples was then analyzed using refractometer to obtain the urea concentration in the solution at a particular time.
Statistical analysis
To analyze the trend of dissolution rate of SCU, Box-Behnken Design is used without replicate [12]. For statistical calculations, the relation between the coded values and actual values are described as the following equation:
Xi=(Ai-A0)/ΔA, (2)
Where Xi is a coded value of the variable; Ai the actual value of variable; A0 the actual value of the Ai at the centre point; and ΔA the step change of variable. The levels of the variables and the experimental design are shown in Table 1.
| Run | Ts(°C) | ts(min) | tD(day) | %D | |||
|---|---|---|---|---|---|---|---|
| X1 | Code X1 | X2 | Code X2 | X3 | Code X3 | ||
| 1 | 60 | -1 | 15 | 0 | 1 | -1 | 16.06 |
| 2 | 70 | 0 | 20 | 1 | 1 | -1 | 13.19 |
| 3 | 70 | 0 | 15 | 0 | 4 | 0 | 48.27 |
| 4 | 80 | 1 | 15 | 0 | 7 | 1 | 58.88 |
| 5 | 70 | 0 | 20 | 1 | 7 | 1 | 69.78 |
| 6 | 80 | 1 | 15 | 0 | 1 | -1 | 22.86 |
| 7 | 70 | 0 | 15 | 0 | 4 | 0 | 48.27 |
| 8 | 80 | 1 | 10 | -1 | 4 | 0 | 44.78 |
| 9 | 80 | 1 | 20 | 1 | 4 | 0 | 43.72 |
| 10 | 70 | 0 | 15 | 0 | 4 | 0 | 48.27 |
| 11 | 60 | -1 | 20 | 1 | 4 | 0 | 42.82 |
| 12 | 60 | -1 | 15 | 0 | 7 | 1 | 55.63 |
| 13 | 70 | 0 | 10 | -1 | 1 | -1 | 21.62 |
| 14 | 60 | -1 | 10 | -1 | 4 | 0 | 40.64 |
| 15 | 70 | 0 | 10 | -1 | 7 | 1 | 66.26 |
Table 1: The Box-Behnken experimental design with three independent variables.
For predicting the optimal point, a second-order polynomial function was fitted to correlate relationship between variables and response. Quadratic equation for the variables was as following:
Y=β0+ΣβiXi+ΣβiiXi2+ΣβijXiXj, (3)
Where, Y is the predicted response; β0 a constant; βi the linear coefficients; βii the squared coefficients; and βij the cross-product coefficients.
The software Minitab 16 was used for the regression and graphical analysis of the experimental data obtained. A differentiation calculation was then employed for predicting the optimum values of temperature bed and coating time for the minimum dissolution (%D).
Product characterization
The characterization of the product was carried out by water soluble urea test, sulfur content test and know the morphology of product by Scanning Electron Microscopy (SEM) method.
Results and Discussion
The independent variables (temperature bed, coating time and dissolution day) were explored using Box-Behnken design. Table 1 represents the design matrix of the variables together with the experimental results. 12 experiments were performed at the different combinations and 3 experiment were under the same conditions but no repeat. By applying multiple regression analysis on the experimental data, the following second-order polynomial equation was found to explain the dissolved urea concentration:
Y=-256+7.29X1+0.8X2+10.98X3-0.0482X12-0.0185X22-0.566X32-0.0162X1X2-0.0296X1 X3+0.199X2X3 (4)
Where, Y is the predicted dissolved urea concentration; X1, X2 and X3 are the coded values of temperature bed, coating time and dissolution day, respectively. The parameter estimates and the corresponding P-values (Table 2) suggest that dissolution day (X3) have a significant effect. The square of temperature bed and dissolution day also had significance on correlation of coefficients with the low Pvalues of less than 0.1. But no significant correlation of coefficients on interactive terms.
| Coefficient | Standard Error | p-value | |
|---|---|---|---|
| Constant | 48.27 | 2.45 | 0 |
| X1 | 1.89 | 1.5 | 0.264 |
| X2 | -0.47 | 1.5 | 0.765 |
| X3 | 22.1 | 1.5 | 0 |
| X12 | -4.82 | 2.21 | 0.081 |
| X22 | -0.46 | 2.21 | 0.842 |
| X32 | -5.1 | 2.21 | 0.069 |
| X1 X2 | -0.81 | 2.12 | 0.718 |
| X1 X3 | -0.89 | 2.12 | 0.693 |
| X2 X3 | 2.99 | 2.12 | 0.218 |
Table 2: Results of regression analysis of the Box-Behnken design for urea dissolution.
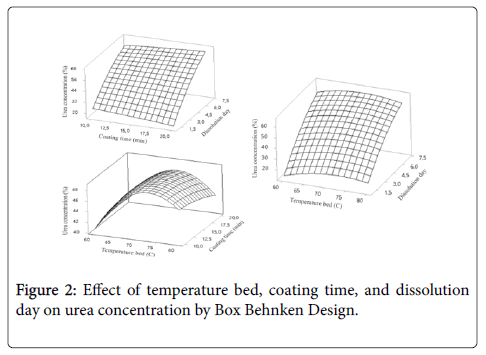
The computed F-value of 217.46 is much greater than the F (25.65) value in statistic table at 1% level, which reflecting the high significance of the model. Here the R2 value of 0.979 indicates a good agreement between experimental and predicted values and implies that the mathematical model is very reliable. From equations derived by differentiation of equation 4, the optimal values of X1 and X2 on hold value 7 days dissolution day in the coded units were found to be -1. Correspondingly, we can obtain the minimum dissolved urea concentration of the model, which was 60°C of temperature bed and 10 minute of coating time, respectively. The minimum predicted value of dissolved urea concentration obtained was 55.675%.
Using the Minitab 16 software, the response surface curves and its corresponding contour curves described by the regression model are constructed in Figure 2. Here, each response surface plot represents the effect of two independent variables at an optimal level of the third variable. The shape of the corresponding contour plots indicates whether the mutual interactions between the independent variables are significant or not.
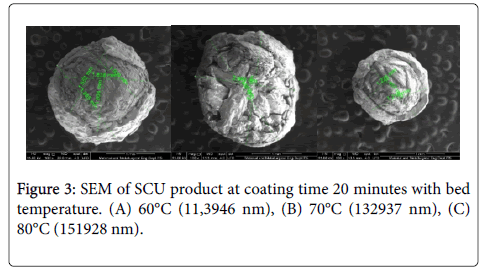
In this study we conducted a SEM test on sulfur coated urea to determine the thickness of the sulfur lining the urea surface. In Figure 3 the urea that has been coated sulfur is cut manually using a cutter. In the figure it can be seen that the urea surface is coated by sulfur, but the sulfur lining the urea is uneven, where there is a surface of urea that has a thick layer of sulfur and there is a surface of urea that has a thin layer of sulfur. The difference in thickness is due to the sulfur rate used in the study is not constant.
To determine the thickness of the sulfur lining of urea, a measurement of the SEM results can be seen in Figure 3, where the mean diameter of the SCU under each operating condition is reduced by the mean diameter of the urea. Based on the measurement results, the thickness of sulfur 60, 70 and 80°C is 0.2618, 0.2673 and 0.045, respectively.
Acknowledgements
Acknowledgment study was financially supported by Kemenristek dikti, Indonesia on Program Kreativitas Mahasiswa (PKM) 2018.
References
- Ibrahim KRM, Babadi FE, Yunus R (2014) Comparative performance of different urea coating materials for slow release. Particuology 17: 165-172.
- Tian X, Li C, Zhang M, Li T, Lu Y, et al. (2018) Controlled release urea improved crop yields and mitigated nitrate leaching under cotton-garlic intercropping system in a 4-year field trial. Soil and Tillage Research 175: 158-167.
- Patil MD, Das BS, Barak E, Bhadoria PB, Polak A (2010) Performance of polymer-coated urea in transplanted rice: effect of mixing ratio and water input on nitrogen use efficiency. Paddy and Water Environment 8: 189-198.
- Shaviv A (2005) Controlled release fertilizers. In IFA international workshop on enhanced-efficiency fertilizers. Frankfurt. International Fertilizer Industry Association Paris, France, pp: 28-30.
- Azeem B, KuShaari K, Man ZB, Basit A, Thanh TH (2014) Review on materials & methods to produce controlled release coated urea fertilizer. Journal of Controlled Release 181: 11-21.
- Zheng W, Liu Z, Zhang M, Shi Y, Zhu Q, et al. (2017) Improving crop yields, nitrogen use efficiencies, and profits by using mixtures of coated controlled-released and uncoated urea in a wheat-maize system. Field Crops Research 205: 106-115.
- Qiao D, Liu H, Yu L, Bao X, Simon GP, et al. (2016) Preparation and characterization of slow-release fertilizer encapsulated by starch-based superabsorbent polymer. Carbohydrate Polymers 147: 146-154.
- Tsai BS (1986) Continuous spouted bed process for sulphur-coating urea. (Doctoral Dissertation), University of British Columbia.
- Choi MMS, Meisen A (1997) Sulfur coating of urea in shallow spouted beds. Chemical Engineering Science 52: 1073-1086.
- Mathur KB, Gishler PE (1955) A technique for contacting gases with coarse solid particles. AIChE Journal 1: 157-164.
- Box GE, Behnken DW (1960) Some new three level designs for the study of quantitative variables. Technometrics 2: 455-475.
Citation: Hamidi F, Prakasita B, Zuhdan MJ, Widiyastuti W, Setyawan H (2018) Dissolution Rate Behaviour of Sulfur Coated Urea from Spouted Bed Coater using Box Behnken Design. Adv Crop Sci Tech 6:390. DOI: 10.4172/2329-8863.1000390
Copyright: © 2018 Hamidi F, et al. This is an open-access article distributed under the terms of the Creative Commons Attribution License, which permits unrestricted use, distribution, and reproduction in any medium, provided the original author and source are credited.
Select your language of interest to view the total content in your interested language
Share This Article
Recommended Journals
Open Access Journals
Article Tools
Article Usage
- Total views: 5067
- [From(publication date): 0-2018 - Nov 17, 2025]
- Breakdown by view type
- HTML page views: 4098
- PDF downloads: 969


