Research Article Open Access
Diffusion Mechanism and Quantitative Measurement of Moisture Transport in Porous Silica Gel Filter Using Dynamic Neutron Radiography Technique
| Amr Abdelhady, Waleed I Abd El Bar and Mongy T* | |
| Egyptian Atomic Energy Authority (EAEA), Egypt | |
| Corresponding Author : | Mongyc T Egyptian Atomic Energy Authority (EAEA) (ETRR-2), 13759, Egypt Tel: 002 02 44621839 Fax: 002 02 44621838 E-mail: tmongy@gmail.com |
| Received: June 15, 2015 Accepted: September 24, 2015 Published: September 28, 2015 | |
| Citation: Abdelhady A, Abd El Bar WI, Mongy T (2015) Diffusion Mechanism and Quantitative Measurement of Moisture Transport in Porous Silica Gel Filter Using Dynamic Neutron Radiography Technique. OMICS J Radiol 4:205. doi:10.4172/2167-7964.1000205 | |
| Copyright: © 2015 Abdelhady A, et al. This is an open-access article distributed under the terms of the Creative Commons Attribution License, which permits unrestricted use, distribution, and reproduction in any medium, provided the original author and source are credited. | |
Visit for more related articles at Journal of Radiology
Abstract
Neutron radiography (NR) can investigate the diffusion mechanisms of moisture transport within the silica gel material. Dynamic neutron radiography (DNR) possesses the possibility to investigate the moisture profile inside the silica gel filter. The technique explained the relationship between moisture movement and time. This study investigated the diffusion mechanisms (absorption and infiltration) of moisture in the silica gel filter by state-of-the-art dynamic neutron radiography (DNR) technique and advanced software. This study also measured the ability of the DNR technique to find out the diffusion coefficients of a silica gel filter material as a function of temperature and time.
|
Abstract
Neutron radiography (NR) can investigate the diffusion mechanisms of moisture transport within the silica gel material. Dynamic neutron radiography (DNR) possesses the possibility to investigate the moisture profile inside the silica gel filter. The technique explained the relationship between moisture movement and time. This study investigated the diffusion mechanisms (absorption and infiltration) of moisture in the silica gel filter by state-of-the-art dynamic neutron radiography (DNR) technique and advanced software. This study also measured the ability of the DNR technique to find out the diffusion coefficients of a silica gel filter material as a function of temperature and time.
Keywords
Neutron radiography; Silica gel filter; Porous media; Moisture profile; Diffusion coefficient
Introduction
The importance of this work was arising from degrading refrigeration cycle efficiency as a result of moisture build-up in the Freon gas cooling cycle [1,2]. The presence of efficient silica gel filter is significant in cooling cycle; to avoid cycle efficiency regression. Understanding moisture profile and moisture dynamic inside the silica gel filter is important for equipment maintenance program. Moisture profile distributions and immigration inside the silica gel filter material were monitored and studied by the dynamic neutron radiography (DNR) technique. Moisture transient distribution and absorption/infiltration behaviour in a silica gel filter wall surface were visualized. The experiment was performed at the neutron radiography (NR) facility at the Egyptian Second Research Reactor (ETRR-2). The facility has the following characterization parameters, summarized in table 1 [3].
Neutrons vs. other Non-Destructive Techniques
NR is currently a well-known technique, which is employed for non-destructive testing in a number of industrial and environmental applications [4]. The technique is effective in detecting infiltrations of hydrogen or light materials due to the particular behaviour of scattering neutron cross sections. Heavy elements with high atomic number have more resistance against the penetration of x- or gamma rays through them, than the light elements [5]. On the other hand, the interaction of neutrons with matter is completely different. There is no specific relation between the atomic number of elements and their neutron interaction cross-sections. But the neutron beams can be scattered by light hydrogenous materials, better than by heavy ones. Consequently, distinguishing light materials is distinctive by neutron radiography. In this study, NR is a suitable technique for investigating water profile inside a silica gel filter. In general, neutrons are not better than x or gamma rays, but may give complementary results when x-rays or gamma-rays fail [6].
Analysis by x-ray
Analysis by gamma ray
Gamma ray attenuation can be used to monitor moisture diffusivity in pore materials. Moisture contents can be determined from the difference of densities between moist and dry material. The absorption coefficient of water is approximately the same as the dry porous materials. It is necessary to carry out a dry measurement involving precise site location. This can cause considerable difficulties. Reliable determination of water content is not possible by this technique [9].
Previous Work
Previous work did not mention the diffusion coefficient of the water absorption/infiltration into a silica gel filter material [10-15], but instead silica gel particles. Diffusion mechanisms of the moisture within the silica gel particles were investigated theoretically by a proposed model for simultaneous heat and mass transfer in a thin packed bed of desiccant particles [10]. T. Patsahan and M. Holovko proposed a computer simulation model to study water molecules confined in silica gel particles [11]. A spherical gel (Si O2) composite was designed as a porous medium of silica gel. The diffusion coefficients of water molecules were calculated at different temperatures and water densities. I. Mamaliga et al., characterized water vapour diffusion into spherical silica gel particles of diameter 3.57 mm [12]. The effective diffusion coefficient was experimentally calculated by knowing particle’s porosity and the slope of the adsorption isotherm.
Computational fluid dynamics (CFD) simulation was modelled to clarify water absorption characteristics by granular size of silica gel spherical particles of sizes 1, 2, 3, 3.5 and 5 mm with different porosities [13,14]. An error in effective diffusion coefficients was estimated for water absorption in silica gel particles [15]. The literature showed that the effective diffusion coefficients (for gel particles) ranged from 1.5 × 10⁻¹¹ to 2 × 10⁻¹⁰ m2/s at temperatures within 315-395 K. The Scope of the Study
NI has been developed at the ETRR-2, as a non-destructive tool for many applications; due to its transparency to heavy elements and high sensitivity to the light elements. The technique is a particularly powerful tool with respect to silica gel/water imaging; due to its high contrast between hydrogen and silica gel material, and high spatial resolutions, after applying advanced imaging processing technique. This work is crucial to verify maintenance program schedule for the chilled cooling system at the ETRR-2.
State of the Art Neutron Imaging Facility at the ETRR-2
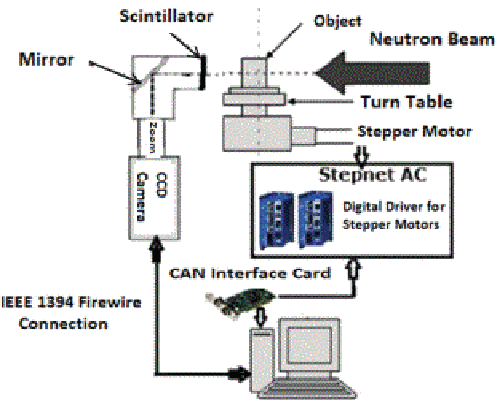
The commissioning of the state- of- the-art new neutron imaging (NI) system [16,17] started at the end of March 2012 under the framework of TC communication between the Egyptian Atomic Energy Authority (EAEA) and the IAEA. The layout of the system is shown in Figure 1. The NI system was installed to replace the old fashion static based film neutron radiography.
For NI, the neutrons are attenuated and a sufficient amount of light is produced by a scintillation screen that detected with a CCD camera. The scintillation screen used had a composition of LiF:ZnS:Cu. The neutrons interact with lithium due its large cross section to produce an alpha particle (4He++) and tritium (3H) daughter products. The energy from alpha particle is deposited into zinc sulphide (ZnS) and efficient phosphor producing visible light. The copper element acts as a wavelength shifter to produce light in the yellow–green region, which has an average wavelength of 525 nm. The CCD camera with its lenses, mirror and integrated cooling unit is housed in a shielded light tight aluminium box. Table 2 summarizes the CCD camera system with the technical specifications. Camware program was employed for camera control and image acquisition. Image acquisition and image processing was accomplished by using Image J. The Principle Background
The principle of the NR was an intensity projection of the object on the CCD detector [4]. The images contain spatial information on the attenuation of the radiation in the object that depends on material composition, thickness and density. The image contains qualitative and quantitative information on the structure of the object.
The mechanism for the water vapour movement through a silica gel material is surface diffusion. Surface diffusion is the transport of adsorbed molecules on the pore surface [10]. The determination of diffusion coefficients was based on the diffusion equation in cylinder coordinate (1).  where: mr is the water content in the radial direction (r), Dc is the diffusion coefficient, t is the time in seconds. The initial condition for the water contents is 0 at time 0. The gel filter was instantaneously exposed to the water vapour flow with time. Geometric Set Up
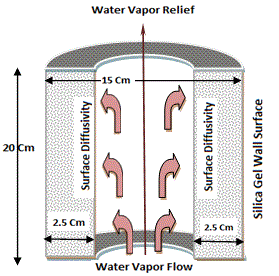
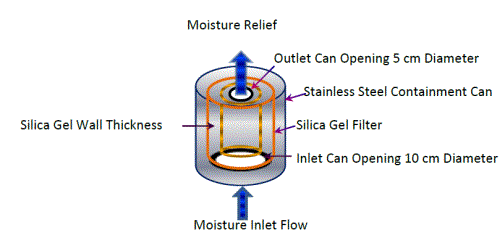
Figure 2 represents a schematic diagram of the moisture diffusion inside the silica gel filter. The filter has 20 cm length, 15 cm diameter and 2.5 cm wall thickness. The moisture diffusion mechanism is surface diffusion toward the wall thickness (radial direction). The filter was placed inside a stainless steel containment can with 10 cm inlet aperture and 5 cm outlet aperture. The filter inner wall surface was exposed to a stationary water vapour flow for 25 min. The moisture generation was performed by increasing the water temperature at a constant increment from 25°C to 100°C for 10 min in addition to 15 min. after reaching vaporization. Figure 3 shows the filter arrangement layout inside the can.
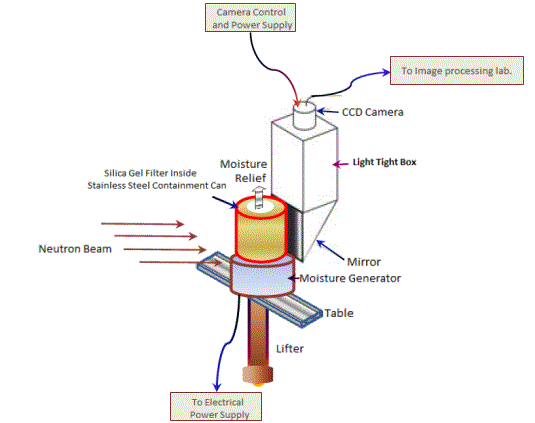
The function of the stainless steel can was to save water vapour, and allow the inner surface to expose to the moisture at a constant increment in relative humidity (RH). The arrangement, shown in Figure 4, was placed in front of the NR beam tube and the moisture was produced constantly by an electrical moisture generator device. The New In the Experimental Work
This new in this work was determining the diffusion coefficient of the moisture inside the silica gel filter material. Also, this work monitored 3D of the diffusion mechanisms, absorption and infiltration, of the moisture inside the silica gel filter by the DNR technique. Furthermore, this work studied the temperature-dependent diffusion coefficients within the silica gel filter material rather than gel particles.
The DNR monitored the infiltration mechanism inside the wall of the gel filter in both radial (r) and vertical (z) directions. Assuming a dry filter at the beginning, the resultant images were insufficient to extract data, so advanced image processing technique was needed. Employed Software and Image Processing Technique
Image J was employed for imaging processing and data extraction. Enhance contrast tool was used to obtain image information. Equalize histogram (EH) option was used with saturated pixel 0.4%. Saturated pixels determined the number of pixels in the image that are allowed to become saturated. By increasing this value, the contrast was enhanced. This value should be greater than zero to prevent a few outlying pixels from causing the histogram stretch not to work as intended [18].
Equalized histogram (EH) technique
The initial radiographed images were represented by close contrast values. The EH tool was adjusted to increases the global contrast of the images and modify the dynamic range [19]. By EH, the minimum detectable intensities were better distributed and visualized. The sensitivity was enhanced and ranged from 0 to 1 normalized to the moisture absorbent mass at the end of the experiment.
This EH technique possessed a method for effective and efficient mean brightness preservation and contrast enhancement. The method prevented intensity saturation and has the ability to preserve image fine details. Moisture Profile and Data Analysis
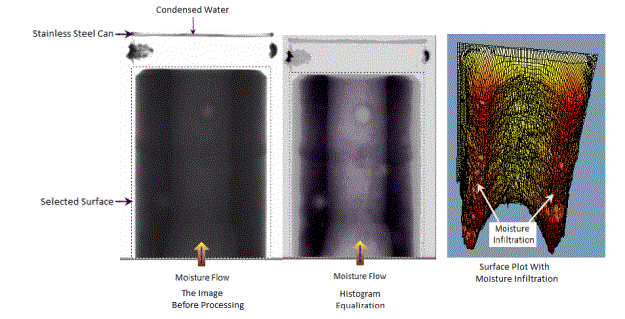
The surface plot tool was used to monitor 3D infiltration pattern inside the inner wall surface of the silica gel filter after 5 min. and at 60°C. The EH technique was applied before the surface plot.
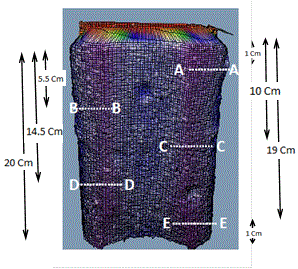
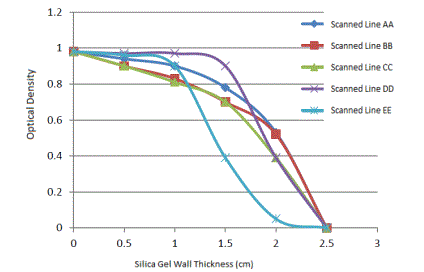
Figure 5 shows the moisture infiltration profile inside the wall of the silica gel filter. The selective scanned lines AA, BB, CC, DD and EE are shown in Figure 6. The moisture profiles for the positioned scanned lines are plotted and are shown in Figure 7. Figure 7 showed that the scanned lines profile had different behaviors [20]. The optical density axis (I/I0) represents dimensionless mass fraction water content [20,21], the axis presented moisture mass absorption at time t (5 min.) normalized to the moisture absorbent mass at the end of the experiment. The other axis represents the wall thickness of the filter. The moisture profile took a smooth decay with the filter thickness at the upper part of the filter, as shown in the line AA. In contrast to the line AA, the profile EE was sharply decreased with the filter wall thickness at the inferior part. At the intermediate lower region (scanned line DD), the profile took a constant behaviour through 2 cm filter thickness, and decreased dramatically in the region from 1.5-2.5 cm. The other lines BB and CC had almost the same behavior. Physical analysis of intensities profile
The diffusivity can be intuitively described as the ease of the spread of water particles [21]. The results of Figure 7 were consistent with the literature [21]. The study indicated that the diffusion process is anomalous and there is no one master curve for the water profiles. The study showed that the water diffusivities were increased as the water content increased, this is clear for the scanned line profile DD. From the scanned line EE, it is clear that the efficiency of the lower part of the filter for water infiltration was insufficient for water mobility.
Moisture Dynamic and Diffusion Mechanisms
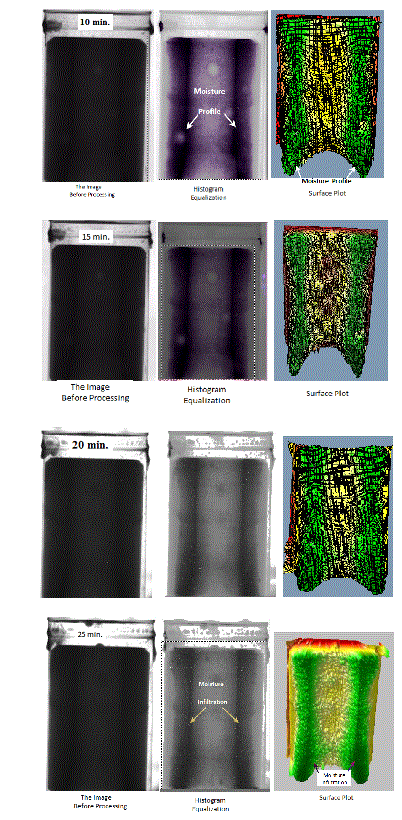
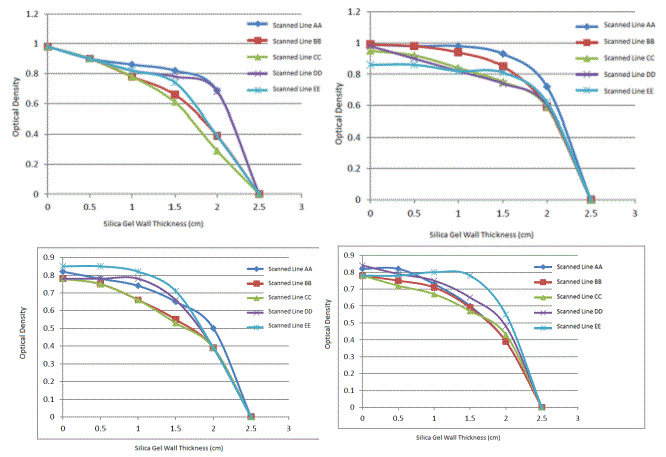
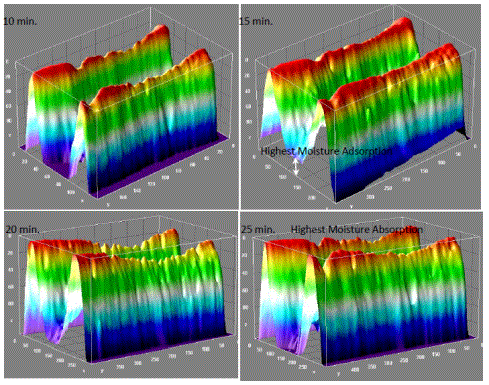
The moisture pattern images are shown in Figure 8. The corresponding scanned lines were also presented in Figure 9.
From Figure 8, there is a sufficient amount of moisture absorption from 10 to 15 min. The maximum absorption capacity occurred at 15 min. As the time was increased, the efficiency of the silica gel filter for moisture absorption was decreased, showing decrease in optical densities, as clear in the profiles 20 and 25 min. Physical description of the diffusion mechanisms
From Figure 9, it is clear that the water diffusivity is temperature dependent. The water diffusion coefficient was increased with temperature. This is combatable with the literatures [22-24]. The dependence can be understood according to the driven equation (2) [23]:
 where: gv is the vapour diffusion flux density in Kg/m2s, μ is the water vapour diffusion resistance factor of dry porous material, RD is the gas constant for water vapour in J/Kg K, P is the partial pressure of water vapour, x is the spatial coordinates in m and, T is the absolute temperature in Kelvin. From the equation, it is clear that water vapour permeability rises with temperatures [23]. The experimental results were in close agreement with predictions based on the fundamental handbook [23]. According to DIN 52615, if the mean relative humidity (RH) in the specimen is increased, the water-vapour permeability rises in a non-linear fashion. This is clear for the profiles 15 min., in which the moisture diffusivity increased with increasing RH, and the maximum moisture absorption was occurred. As the filter was partially saturated, the efficiency for moisture absorption was reduced, as shown in the profiles 20 and 25 min., in which the lower moisture absorption was occurred. Moisture profile in z direction
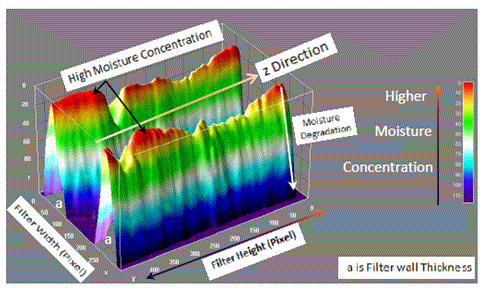
To investigate moisture profile in vertical z direction, the interactive 3D surface plot tool in Image J was employed. The plot profile in Figure 10 shows the behaviour of the moisture profile after 5 min. The figure indicated that the maximum moisture concentration occurs at the moisture-wall interface region. Figure 11 shows the moisture dynamic in z direction. The maximum infiltration capacity happened after 25 min.
Standard Determination of Vapour Diffusion Coefficients
Procedures for measuring vapour diffusion coefficient [25] were standardized under DIN 25 615. A plate-shaped specimen of the tested material was placed atop a vessel. As vapour generation production around the vessel edges, a constant RH was set up. Once a steady state diffusion flow was set up, a constant weight change in the test vessel per unit time was occurred. The change in weight was corresponding to the diffusion flow.
Determination of Temperature Dependent Diffusion Coefficients
The experiments indicated that the diffusion coefficient of the moisture inside a silica gel material is dependent on both temperature and time. The diffusion coefficients of the moisture were calculated based on the fundamental reference [26]. The reference stated that, the moisture diffusivity can be calculated from the moisture profile measured at various times after start of water uptake or start of moisture redistribution. The profiles are measured on specimens that are absorbing free water from their boundary or from the redistribution process occurring when the absorption process is interrupted.
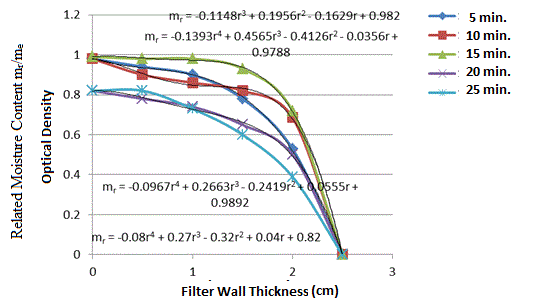
Reference [24] represented determination of moisture diffusivity in concrete by solving the diffusion equation. The differential equation was solved by mathematical solutions under specific temperature conditions and 50% RH. Moisture diffusivity calibration curves were obtained. The distinction of this work was determination of moisture calibration curves by a trustable experimental technique. Equation (1) was the basis for determination the diffusion coefficient of the scanned line AA, at different moisture exposure time (t). The governor equations that substituted into the diffusion equation were extracted from fitted trend curve profile from Figure 12. The figure presented the scanned line profile AA at different temperature and time. Table 2 summarized the governing equations as a function of radial direction r, temperature (T), time interval (âÂ?Â?t) and the resultant diffusion coefficients Dc for the scanned line AA at 1.5 cm filter wall thickness (r=0.015 m). From the obtained values, it is clear that increasing Dc with T and time. aâÂ?Â?m/me (dimensionless related moisture content) [20,21]=0.04 (Absorption process was dominant from 5 to10 min.). bâÂ?Â?m/me=-0.17 (Infiltration process was dominant from 10 to 20 min.). câÂ?Â?m/me=-0.05 (Infiltration process was dominant from 20 to 25 min.). dâÂ?Â?m /me=-0.28 (Infiltration process was dominant from 15 to 25 min.). me is moisture content at the end of the experiment. Comparison results
The temperature dependent moisture diffusion coefficients were calculated for concrete and raged from 10-9 to 10-7 m2/s in the literature [24]. The diffusion coefficient of the silica gel material is much higher (≈10-5 m2/s); because the silica gel removes moisture by adsorption onto the surface of its numerous pores beside absorption into the bulk of the gel filter material.
Conclusion
Neutron radiography technique is a powerful tool for investigation moisture characteristic absorption of the silica gel filter. The results indicated that accurate quantitative measurement data had obtained. The technique used DNR in monitoring the moisture profile and mechanisms inside the gel filter.
Acknowledgment
The authors express their deepest thanks and appreciations for reactor operation staff for the reactor operation during the experiments.
|
References
- Air conditioning
- Asano H, Nakajima T, Takenaka N, Fujii T (2005) Visualization of the hygroscopic water distribution in an adsorbent bed by neutron radiography. Nuclear Instruments and Methods in Physics Research Section A: Accelerators, Spectrometers, Detectors and Associated Equipment 542: 241-247.
- Mandour A, Megahid RM, Hassan MH, Abd El SalamTM (2008) Characterization and Application of the Thermal Neutron Radiography Beam in the Egyptian Second Experimental and Training Research Reactor (ETRR-2). Science and Technology of Nuclear Installations.
- Zanarini M, Chirco P, Rossi M, Baldazzi G, Guidi G, et al. (1995) Evaluation of hydrogen content in metallic samples by neutron computed tomography. Nuclear Science, IEEE Transactions on, 42: 580-584.
- Von der Hardt P (1981) Handbook of materials testing reactors and associated hot laboratories in the European community: nuclear science and technology.
- Radiography and Tomography (2004) x-Rays and gamma-Rays versus neutrons, ITMNR-5 (Workshop). Reidel Pub Co.T. Bücherl, TUM, Germany.
- Queisser A (1988) ZerstoerungsfreieMaterialuntersuchungen an NatursandstienmittelsComputertomographie. Bautenschutz und Bausanierung 11: 54-60.
- Roos H (1988) AberPhänomene des Feuchtigkeitstransports in Ziegein und Mauerwerk, GIT Fachz F d Lab 32: 16-21.
- Nielson AF (1972) Gamma ray attenuation used for measuring the moisture content and homogeneity of porous concrete. Buillding science 7: 257-363.
- Pesaran AA, Mills AF (1986) Moisture Transport in Silica Gel Packed Beds. I. Theoretical Study, Solar Energy Research Institute, USA.
- Patsahan T, Holovko M (2004) Computer simulation study of the diffusion of water molecules confined in silica gel. Condensed Matter Physics 7: 3-13.
- Mamaliga I, Schabel W, Petrescu S (2010) Characterization of Water Vapour Diffusion into Spherical Silica Gel Particles. REV CHIM 61: 1231-1234.
- White J (2010) A CFD simulation on how the different sizes of silica gel will affect the adsorption performance of silica gel. Modelling and Simulation in Engineering.
- White J (2010) Computational Fluid Dynamics Modeling and (TGA) experimental study on a single silica gel type B. Modelling and Simulation in Engineering.
- Bobok D, Besedová E (2000) Error in the estimation of effective diffusion coefficients from sorption measurements. 27th International Conference of the Slovak Society of Chemical Engineering, TatranskéMatliare, pp: 482-488.
- Mongy T1 (2014) Application of Neutron Tomography in Culture Heritage research. See comment in PubMed Commons below ApplRadiatIsot 85: 54-59.
- Abd El Bar W, Mongy T, Kardjilov N (2014) Upgrading of the neutron radiography/tomography facility at research reactor. Kerntechnik, Carl HanserVerlag, München 79: 70-79.
- Rasband W (2012) Image J Software manual 1.46r, National institute of health, USA.
- Acharya T, Ray AK (2005) Image Processing: Principles and Applications. Wiley-Interscience.
- El Abd A, Czachor A, Milczarek J (2009) Neutron radiography determination of water diffusivity in fired clay brick. ApplRadiatIsot 67: 556-559.
- Abdel-Monem AM, El Abd A, Megahid AM, Bashter II (2013) Anomalous Water Diffusion in Concrete Based on Neutron Backscattering Measurements. Arab Journal of Nuclear Science and Applications 46: 215-225.
- Lee SH (2013) Temperature dependence on structure and self-diffusion of water: A molecular dynamics simulation study using SPC/E model. Bull Korean ChemSoc 34: 3800-3804.
- Krus M (1996) Moisture transport and storage coefficients of porous mineral building materials: Theoretical principles and new test methods. Fraunhofer IRB VerlagHolzkirchen
- Korecký T, Durana K, Lapková M, Cerný R (2012) Moisture diffusivity of AAC with different densities, World Academy of Science, Engineering and Technology 6: 1068-1072.
- Bestimmung der Wasserdampfdruchiaessigkit von Bau-und Dammstoffen.
- Janz M (1997) Methods of measuring the moisture diffusivity at high moisture levels. Licentiate Thesis, Lund Institute of Technology, Division of Building Materials, Lund, Sweden.
Tables and Figures at a glance
| Table 1 | Table 2 | Table 3 |
Figures at a glance
 |
 |
 |
 |
| Figure 1 | Figure 2 | Figure 3 | Figure 4 |
 |
 |
 |
 |
| Figure 5 | Figure 6 | Figure 7 | Figure 8 |
 |
 |
 |
 |
| Figure 9 | Figure 10 | Figure 11 | Figure 12 |
Relevant Topics
- Abdominal Radiology
- AI in Radiology
- Breast Imaging
- Cardiovascular Radiology
- Chest Radiology
- Clinical Radiology
- CT Imaging
- Diagnostic Radiology
- Emergency Radiology
- Fluoroscopy Radiology
- General Radiology
- Genitourinary Radiology
- Interventional Radiology Techniques
- Mammography
- Minimal Invasive surgery
- Musculoskeletal Radiology
- Neuroradiology
- Neuroradiology Advances
- Oral and Maxillofacial Radiology
- Radiography
- Radiology Imaging
- Surgical Radiology
- Tele Radiology
- Therapeutic Radiology
Recommended Journals
Article Tools
Article Usage
- Total views: 16108
- [From(publication date):
October-2015 - Mar 29, 2025] - Breakdown by view type
- HTML page views : 11424
- PDF downloads : 4684
