Different Solar Potential Co-Ordinates of Pakistan
Received: 05-Nov-2017 / Accepted Date: 10-Nov-2017 / Published Date: 17-Nov-2017 DOI: 10.4172/2576-1463.1000173
Abstract
MIT, Stanford University and University of California have recently made a research on atmosphere/energy program. The research group has made a plan and concluded that a renewable energy powered world indeed a possibility by 2050. They have analysed the future energy demand of 139 countries and compared the solar, wind and hydroelectric potential of the countries. The research team made an interactive global map which shows the projected energy mix on each of the analysed countries. The report of the map study shows that Pakistan has potential of producing 92% of its electricity requirements from solar energy, at a rate that’s amongst the highest in the world. Solar PV plants can produce 58.1% and concentrated solar plants (CSP) can produce 15% of electricity production. Study of the different solar potential co-ordinates of Pakistan is worth for forth coming planning to utilize solar potential properly and meet power demand of the country. This research is aimed to study the irradiation net power density (in MJ/m2/day and MWh/m2/year) of different co-ordinate of Pakistan. In parallel to study the install capacity of solar thermal and solar PV on district and provincial levels, study solar maps of Pakistan and different seasons on annual basis.
Keywords: Concentrated solar power (CSP); Global energy potential; Normal solar radiations; On grid installation capacity; Photovoltaic (PV) systems; Solar thermal; Solar map of Pakistan
23186Introduction
Fossil and nuclear sources are depleting gradually, renewable energy sources are ideal candidate for a global energy transition that must occur over this century [1-4]. Many problems such as environmental and social are also associated with fossil fuel and nuclear resources. Renewable energy has impact and restriction as the other energy sources has. The knowledge of these restriction is of the great importance to plan and formulate polices for sustainable energy. Wind and solar energy stands out for larger and possibly grids scale potential. Wind energy potential at contemporary charted out by state energy a sharp drop has seen in the installation costs, this helps to attract private sector toward investment in this realm. The wind potential is likely to remain significant only to coastal areas which are at far a distance from national grid only to tune of a couple of gigawatts. Solar energy is in abundance across all the coordinates of the country is justifiably seen as ultimate sources to tap. Solar energy also addresses the atmospheric pollution and climate issues. Over the years a number of states run organization in Pakistan initiated a number of solar energy projects at different mode of utilization but still failed to achieve remarkable contribution [4-6]. Efforts have been made to enhance the fabrication capability exists by state run National Institutes of Silicon Technology (NIST) remains at pilot scale. Water and Power Development Authority (WAPDA) of Pakistan ventured to install small scale power generation but remained fail to sustain it. The imported solar panels are available at exorbitant prices in open markets of Pakistan.
Literature Review
Solar power
It is the conversion of incident Sun energy into electricity directly using photovoltaic or indirectly using concentrated solar power. Concentrated solar power (CSP) systems utilize mirrors, lenses and maximum power tracking system to focus the incident Sun light of large area into a small beam photovoltaic system using photovoltaic effect to covert Sun light energy into direct electric current using semi conducting materials. Solar power is clean sustainable and environmental friendly [7].
Solar thermal
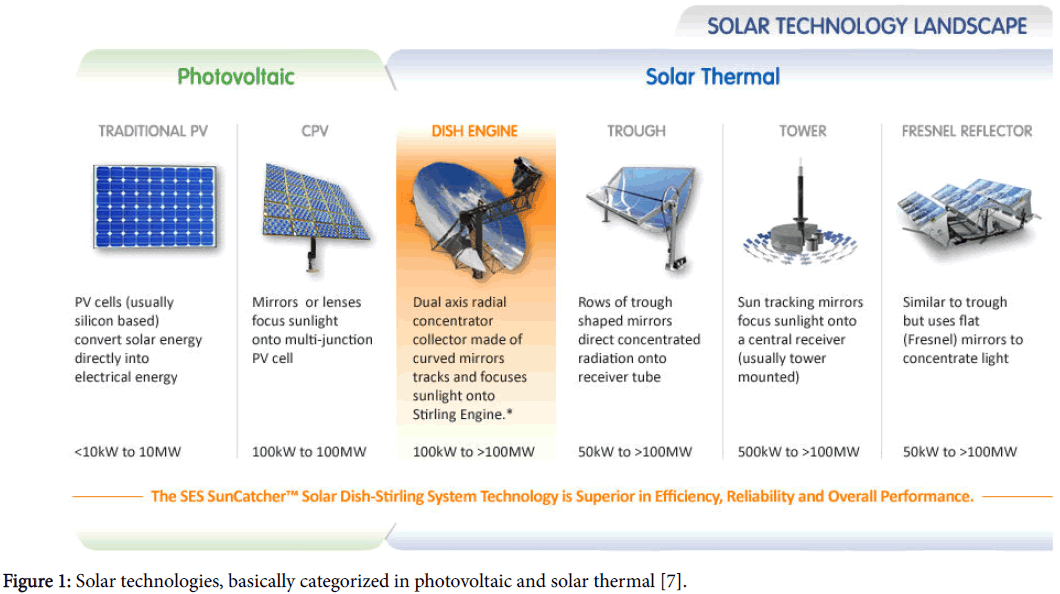
Concentrating solar power plant (CSPP) is one of the best solar technologies to convert Sun incident light into thermal potential to run turbines and generate power in an affordable way (Figures 1-12). Solar thermal technology helps to mitigate climate change as a well pass reduce the consumption of fossil fuels. Solar thermal technologies are being installed in many developed places such as Spain, Israel, USA and Greece and developing countries like India, Mexico, Egypt and Morocco (Tables 1-8). These technologies are as follows [6,7]:
Figure 1: Solar technologies, basically categorized in photovoltaic and solar thermal [7].
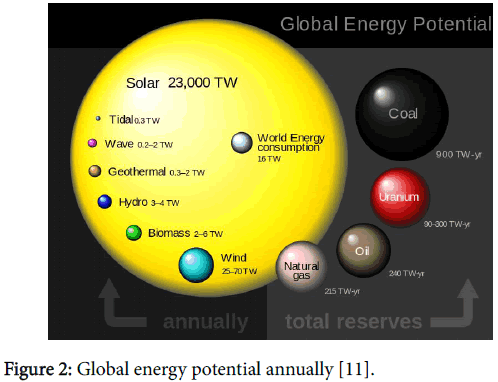
Figure 2: Global energy potential annually [11].
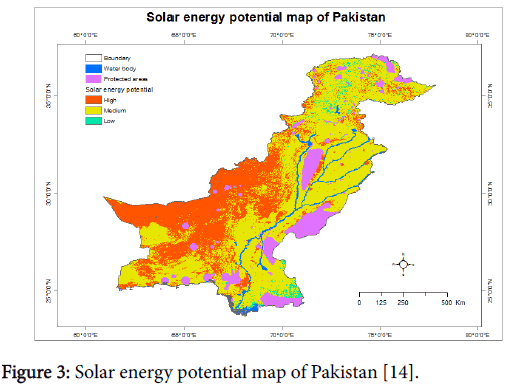
Figure 3: Solar energy potential map of Pakistan [14].
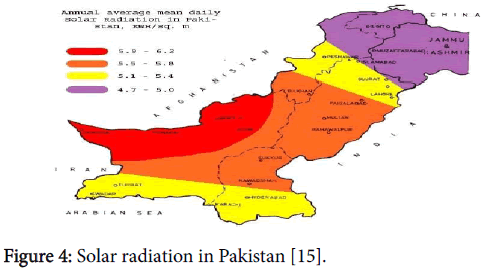
Figure 4: Solar radiation in Pakistan [15].
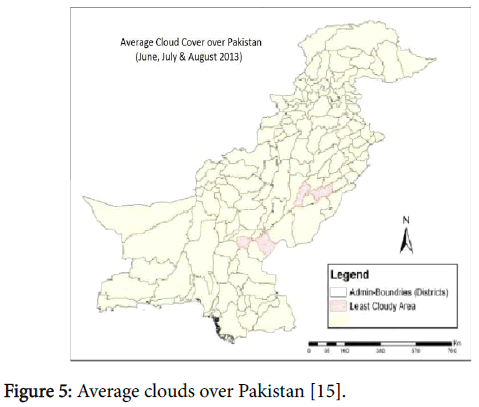
Figure 5: Average clouds over Pakistan [15].
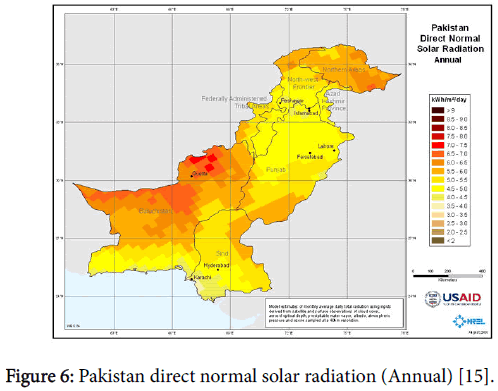
Figure 6: Pakistan direct normal solar radiation (Annual) [15].
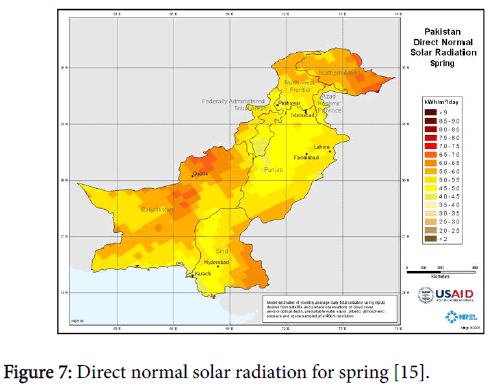
Figure 7: Direct normal solar radiation for spring [15].
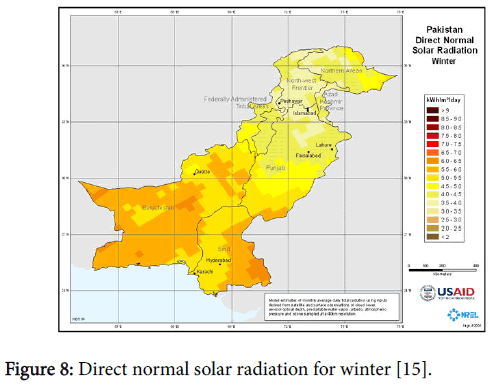
Figure 8: Direct normal solar radiation for winter [15].
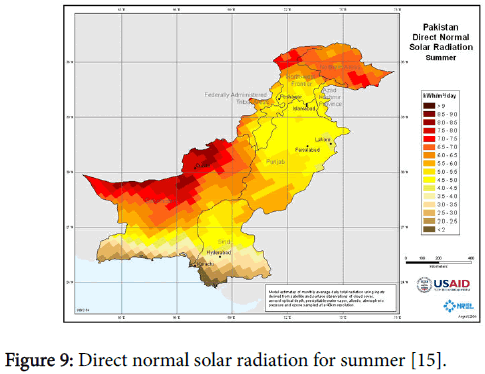
Figure 9: Direct normal solar radiation for summer [15].
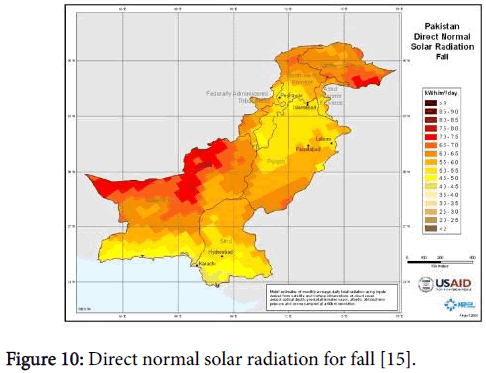
Figure 10: Direct normal solar radiation for fall [15].
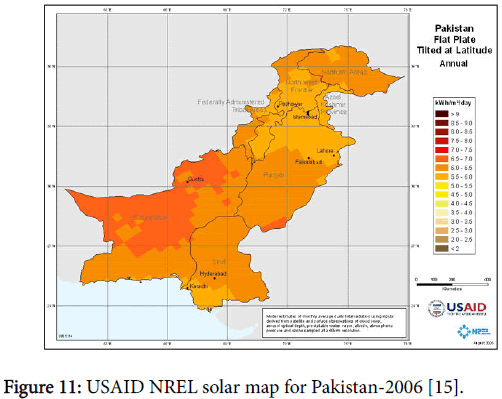
Figure 11: USAID NREL solar map for Pakistan-2006 [15].
| Year | Energy consumption of World ™ | % of Wind and solar |
|---|---|---|
| 2005 | 15674 | 0.0097 |
| 2006 | 16336 | 0.0108 |
| 2007 | 17126 | 0.0124 |
| 2008 | 17454 | 0.015 |
| 2009 | 17339 | 0.0183 |
| 2010 | 13543 | 0.021 |
| 2011 | 19122 | 0.026 |
| 2012 | 19582 | 0.031 |
| 2013 | 20195 | 0.0374 |
| 2014 | 20552 | 4.21 |
| 2015 | 20776 | 4.95 |
| 2016 | 21190 | 0.0566 |
Table 1: Global energy statistical year book 2017 [8].
| Province | Irradiation (Mm) KWh/m2/day | Irradiation (Max) KWh/m2/day |
|---|---|---|
| Balochistan | 7 | 7.5 |
| Southern Punjab | 6.5 | 7 |
| Northern Sindh | 5 | 5.5 |
| KPK | 4.5 | 5 |
Table 2: Irradiation of four provinces of Pakistan.
| Capital of Province | Irradiation (Am) KWb/m2 | Irradiation (Max) KWh/mV |
|---|---|---|
| Lahore | 2.8 | 6.27 |
| Peshawar | 2.4 | 6.35 |
| Karachi | 339 | 631 |
| Quetta | 3.6 | 7.65 |
Table 3: Irradiation of capital cities of four provinces of Pakistan.
| South Region=high Sun regions (dark orange and ochre bands on the insolation map) | North Region=lower Sun regions (yellow and light orange bands on the insolation map) |
|---|---|
| Balochistan | Northern Punjab |
| Sindh | Federally Administered Tribal Areas |
| Southern Punjab (including Cholistan) | Khyber Pakhtunkhwa |
| Islamabad Capital Territory | |
| Azad Kashmir | |
| Gilgit-Baltistan |
Table 4: Comparison between lower Sun radiation regions and high Sun radiation regions.
| Solar PV | Tariff |
|---|---|
| Installed capacity (WTI) | 10.000 |
| Minimum annual energy (GM) | 14.699 |
| CPI (General) November 2013 | 191.210 |
| US CPI (Al urban consumers) November 2013 | 233.069 |
| Exchange rate (Rs./US$) | 105.000 |
Table 5: Upfront tariff for solar PV for north region.
| Solar PV | Tariff |
|---|---|
| Installed capacity (WTI) | 10.000 |
| Minimum annual energy (GM) | 15.330 |
| CPI (General) November 2013 | 191.210 |
| US CPI (Al Urban Consumers) November 2013 | 233.069 |
| Exchange rate (Rs./US$) | 105.000 |
Table 6: Upfront tariff for solar PV for south region.
| S. No | Company | Capacity (MW) | Province |
|---|---|---|---|
| 1 | First Solar | 2 | Punjab |
| 2 | DACC Associates | 50 | Punjab |
| 3 | Access Solar (Pvt) Ltd | 10 | Punjab |
| 4 | Associated Technologies Pvt Ltd | 30 | Punjab |
| 5 | Bulchsh Energy Pvt Ltd | 10 | Punjab |
| 6 | Avatar Energy Group | 50 | Punjab |
| 7 | Wah Industries Ltd | 5 | Punjab |
| 8 | Solargert Pvt Ltd | 50 | Punjab |
| 9 | Hecate Energy | 50 | Punjab |
| 10 | Hecate Energy | 150 | Punjab |
| 11 | Trans Tech Palcistart | 50 | Punjab |
| 12 | Sunlux Energy Innovations | 5 | Punjab |
| 13 | Sapphire Solar Pvt Ltd | 10 | Sindh |
| 14 | Realforce Ruba Palcistart Power Pvt Ltd | 20 | Punjab |
| 15 | Global Strategies (Pvt) Ltd | 10 | Punjab |
| 16 | Forte Palcistart | 0.99 | Punjab |
| 17 | Integrated Power Solution (Pvt) Ltd | 50 | Sindh |
| 18 | Jafri & Associates | 50 | Sindh |
| 19 | Solar Blue Pvt Ltd | 10 | Sindh |
| 20 | Zaheer Khan & Brothers | 10 | Punjab |
| 21 | Dawood Group Ltd | 10 | Sindh |
| 22 | Table Rock Associate | 100 | Punjab |
| 23 | Safe Solar Power Pvt Ltd | 10 | Punjab |
| 24 | Techaccess FZ LLC II | 10 | Punjab |
| Total | 792.99 |
Table 7: List of LOIS issued for a consolidated capacity for 792.99 mw [18].
| Projects | Capacity | Status | Province |
|---|---|---|---|
| Grid connected PV-PEC | 178 kW | completed | Islamabad capital territory |
| Grid connected PV-PC | 178 kW | completed | Islamabad capital territory |
| Quaid-e-Azam Solar Park | 300 NRV | In process | Punjab |
| Industrials zones projects | N/A | MoU signed | Punjab |
| Faisalabad Motorway Project | 1501,14 | MoU signed | Punjab |
| Tehsil Zahri, Dist. Khuzdar | 10 kW | completed | Balochistan |
| Tehsil Jaffar abad | 7.9 kW | completed | Balochistan |
| Rural Electrification, Tehsil Surab | 59.5 kW | In process | Balochistan |
| Rural Electrification, Tehsil Khuzdar | 34.3 kW | In process | Balochistan |
| Rural Electrification,Tehsil Kalat | 41.1 kW | In process | Balochistan |
| Hospital Electrification Dist. Mustung | 14.5 kW | In process | Balochistan |
| Solar power project, Khuchlak Dist. Quetta | 300 MW | MoU signed | Balochistan |
Table 8: List of PV projects in Pakistan.
Methodology
We review in this section the solar potential of different Pakistan’s co-ordinates and contemporary development to harness the solar potential to meet the prevailing power crises in the country.
Global energy potential
The total Sun light energy absorbed by the land masses and oceans is approximately 3, 850, 000 exa joules/year [9]. The conventional sources reserves are in terawatt/year (TWyear) and renewable energy reserves are in terawatts TW. The average power of solar irradiation on earth is 174, 000 TW. 86,000 TW cover land masses given that global ice free land is approximately 13, 000 MH, so theoretically attained power would be about 23, 000 TW [10]. 23, 000 TW refers to earth global solar power of total land masses. With atmospheric losses taken into account and energy 200 million TWh/year. For year 2016 worldwide energy consumption is, wind power 25 to 70 TW, hydro power 3 to 4 TW, solar power 23,000 TW, wave power 0.2 to 2 TW, Geo thermal power 0.3 to 2 TW, Bio mass 2 to 6 TW, OTEC 3 to 11 TW and fossil fuel are: Natural gas 215 TW, coals 90 TW, oil 240 TW and nuclear power 90 to 300 TW [11].
Pakistan solar energy potential
Pakistan has a potential of 2.334 million MW of electricity per year through photovoltaic and solar thermal system. To overcome the prevailing energy crises in the country, the industrialists should venture in this sector. At contemporary in Pakistan with the help of International Renewable Energy Agency (IREA) China and private sector are building solar power plant in Baluchistan, Kashmir, Punjab and Sindh.
On grid installed capacity
Pakistan has inaugurated first ever on grid solar power plant on 29th May 2012 in Islamabad. It was a project that was specially granted by Japan International Cooperation Agency (JICA) under cool earth project, the project was titled “Introduction of cool energy by solar electricity generation system”. The project included the installation of 178.08 KW PV systems for Pakistan Engineering Council (PEC) and Planning Commission of Pakistan (P block). The planning commission and PEC combined generating capacity is 356.16 KW. This was the first on grade project in Pakistan. This project allows the recipients to sell the extra electricity by net-metering to the distribution company of Islamabad division Islamabad Electricity Supply Company (IESCO). The grant assistance of the project was 480 million Yuan, 553.63 million Pakistani Rupees. It took 3 years of time commencing from 2010 [12]. In Lahore, Beacon house canal side campus, first-ever installed solar PV system standard integrated capable of grid tie-in with the capacity of 10 KW. It was a pilot project designed by US consultants for BSS based upon feasibility by trade and development agency (USTAD) [13].
Results And Discussion
Solar irradiance in Pakistan
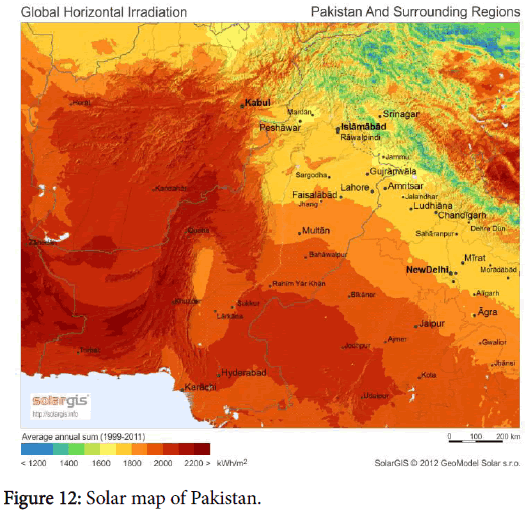
Pakistan receives significant level of solar irradiations ‘across the board. Irradiations changes from north to south. The map given below divides Pakistan in to four bends of irradiance-dark orange, ochre, yellow and fail orange: the irradiations intensity gets increases with depth of color. Highest levels of solar irradiance are found in Balochistan, Southern Punjab and Sindh. ICT, KPK, PATA and Azad Kashmir receive low level of irradiance [14,15].
Pakistan’s co-ordinates lie in seasonal climatic regions especially in monsoon climatic region. This climatic region has cloudy months June, July and august that affects the solar irradiations to reach to earth surface. Pakistan’s co-ordinates having more than 300 clear days in a year.
South western co-ordinates of Balochistan and Northern coordinates of Sindh are most favourable for harnessing solar incident energy. Pakistan has location in such an area where the solar irradiations are highest in its co-ordinates that is suitable for concentrated solar power (CSP) applications and photovoltaic (PV) systems. South Quetta valley and many parts of the central Punjab receive maximum solar energy (Figure 6).
The annual direct normal solar radiation for CSP of four provinces of Pakistan is as follow in Table 2 [16].
Monthly average solar irradiation of capitals cities of four provinces of Pakistan are as follows in Table 3 [16].
Most areas of Balochistan have its annual flat plate titled at latitude solar radiation in range from 7 to 7.5 KWh/m2/day. Gilgit-Baltistan, Sindh and Southern Punjab have its annual flat plate titled at latitude solar radiation in rage of 6 to 6.5 KWh/m2/day. Rest of the country’s coordinates have its ranges from 5.5 to 6 KWh/m2/day. This indicates that Pakistan is in the Sun Belt [17].
If the vast solar potential is properly utilized, it would be worth to produce electric power and supply electricity especially for the off grid communities of the southern and northern hilly areas of the country. As per report of Pakistan Energy Book for the year of 2004-2005, only 0.25% area of Balochistan province if use to generate solar power would be suitable to encounter the contemporary requirement of the country using devices having efficiency 20%.
Annual insolation
• The average daily global insulations of Balochistan is 19 to 20 MJ/m2/day
• The average annual global insulation of Balochistan is 1.93 to 2.03 MWh/m2/year.
• The average insulation of Pakistan is 5.5 kWh/m2/day.
To offer a simple, strong and assured tier structure, the amount of tiers must be kept checked. The specialists believe that, according to the solar irradiance profile of Pakistan, the ideal two tiered structure is following:
Upfront tariff for solar PV power projects
Existing tariff petitions: The only project company, Access Solar (Pvt) Limited, has filed a tariff petition for determination of solar tariff for its proposed power plant at Pind Dadan Khan, Punjab having capacity of 11.52 MW. The company will provide upfront solar tariff [16].
Solar on-grid development
Pakistan largest solar park: Pakistan has inaugurated its first largescale solar power park (Qaid-e-Azam Solar Park) in Bahawalpur. Here are some particulars of it:
General capacity: 1,000 MW
Capacity of Phase 1st: 100 MW
Phase 1st completion date: December 2014
Capacity of Phase II: 300 MW
Capacity of the project of Phase III: 600 MW
Final capacity: 1,000 MW
Accomplishment of final phase of the project date: Dec 2016
Area for project dedicated: 6500 Acres.
Boundary wall of the project: 9 km
Solar energy of final phase per year: 2,000 kWh/m2.
Qaid-i-Azam Solar Park estimated cost is US 1.5 billion dollars and its power generation capacity is 1000 MW. The life span of the plant is 25 years.
Pakistan power production capacity is 19,000 MW, but at contemporary much more power is needed to meet demand. Power projects are being set up at Thar to meet the power demand. After completion of the power projects and sufficient use of the solar potential Pakistan will stand in the list of top ten countries to produce more than 1,000 MW of solar energy.
Conclusion
• Pakistan has location East 62°-75° on Longitude and North 24°-37°on latitude.
• Pakistan lies in an area of “The world having greatest insulation”.
• Pakistan receives 5.5 kW/m2 per day on an average.
• World global solar potential is 30,00,000 TWh/year. Pakistan’s estimated solar potential is 1, 00, 000 MW.
• The electricity generation rate is 2 cents/kWh in Japan.
• Pakistan is required to generate 2000 MW and put in national grid every year which is only possible through solar and wind. The population of UK is less than half the population of Pakistan. It was generating 70, 000 MW in 1970 while Pakistan is generating 22, 000 MW now.
• The provincial government of Sindh should be allowed by Government of Pakistan to research the feasibility of solar power. To make the seawater drinkable through solar energy the Government is planning to install a water filtration plant.
References
- REN21 Global Status Report (2012) Renewable energy policy networked for the 21st century.
- De Castro C, Media Villa M, Miguel LJ, Frescos F (2011) Global wind power potential: Physical and technological limits. Energy Policy 39: 6677-6682.
- De Castro C, Carpintero O, Frescos F, Media villa M, Miguel LJ (2014) A top-down approach to assess physical and ecological limits of bio fuels. Energy 64: 506-512.
- Pakistan Energy Yearbook 2001 (2002) Hydrocarbon Development Institute of Pakistan, Ministry of Petroleum and Natural Resources, Government of Pakistan, Islamabad, Pakistan.
- Kelly B (2006) Nexant parabolic trough solar power plant systems analysis
- https://www.energy.gov/science-innovation/energy-sources/renewable-energy/solar
- Joshua P (2002) Photovoltaics: A path to sustainable futures. Futures 34: 663-674
- https://www.bp.com/content/dam/bp-country/de_de/PDFs/brochures/BP-statistical-review-of-world-energy-2014-full-report.pdf
- Energy Information Administration (2013) Total electricity net consumption.
- Hermann WA (2006) Quantifying global energy resources. Energy 31: 1349-1366.
- https://www.iea-shc.org/data/sites/1/publications/2015-11-A-Fundamental-Look-at-Supply-Side-Energy-Reserves-for-the-Planet.pdf
- Pakistan gets first on-grid solar power station, Government of Pakistan, Islamabad, January 2002
- Hammer A, Heinemann D, Hoyer C, Kuhlemann R, Lorenz E, et al. (2003) Solar energy assessment using remote sensing technologies. Remote Sensing of Environment 86: 423-432.
- Solar power LOI report (2014) Alternative Energy Development Board Ministry of Water and Power Government of Pakistan.
Citation: Muhammad F, Raza MW, Khan S, Khan F (2017) Different Solar Potential Co-Ordinates of Pakistan. Innov Ener Res 6: 173. DOI: 10.4172/2576-1463.1000173
Copyright: ©2017 Muhammad F. This is an open-access article distributed under the terms of the Creative Commons Attribution License, which permits unrestricted use, distribution and reproduction in any medium, provided the original author and source are credited.
Select your language of interest to view the total content in your interested language
Share This Article
Recommended Journals
Open Access Journals
Article Tools
Article Usage
- Total views: 14648
- [From(publication date): 0-2017 - Jul 09, 2025]
- Breakdown by view type
- HTML page views: 13439
- PDF downloads: 1209

