Research Article Open Access
Development of Energy Efficiency Design Index for Inland Cargo Vessels of Bangladesh
Golam Zakaria and Sohanur Rahman*Bangladesh University of Engineering & Technology
- Corresponding Author:
- Sohanur Rahman
Bangladesh University of Engineering and Technology
Dhaka-1000, Bangladesh
Tel: +880 2-55167100
E-mail: sohanbuet08@gmail.com
Received Date: June 09, 2017; Accepted Date: August 03, 2017; Published Date: August 07, 2017
Citation: Zakaria G, Rahman S (2017) Development of Energy Efficiency Design Index for Inland Cargo Vessels of Bangladesh. J Marine Sci Res Dev 7:235. doi: 10.4172/2155-9910.1000235
Copyright: © 2017 Zakaria G, et al. This is an open-access article distributed under the terms of the Creative Commons Attribution License, which permits unrestricted use, distribution, and reproduction in any medium, provided the original author and source are credited.
Visit for more related articles at Journal of Marine Science: Research & Development
Abstract
Energy Efficiency Design Index (EEDI) was introduced since 2013 for recent built vessels to measure energy efficiency of sea going vessels. This factor already has created a great influence on global maritime industry. However, any requirement linked to the energy efficiency of inland vessels does not exist. This paper attempts to evaluate EEDI for inland cargo vessels of Bangladesh. According to the results of this analysis, which has been based on 351 existing inland cargo vessels, EEDI that was developed for seagoing vessels cannot be implemented for evaluation of inland cargo vessels due to limitation of carrying capacity and installed main engine power. So, the main objective of this paper is to provide EEDI reference line for inland cargo vessels of Bangladesh.
Keywords
Inland Cargo Vessel; CO2 emission; IMO; Reference line; Energy Efficiency Design Index (EEDI)
Abbreviations
CF -Carbon emissions factor (tCO2/tFuel); DOS-Department of shipping; DWT- Deadweight (t); PAE- Auxiliary engine power (KW); PME- Main engine power (KW); PPTO- Shaft Generator power (KW); R2- Coefficient of determination; PPTI- Shaft Motor power (KW); SFCSpecific fuel consumption (g/kWh); Fi- Capacity factor; Vref - Reference speed (knot); Fw- Weather factor; GT- Gross tonnage; Fc- Cubic capacity correction factor.
Introduction
According to IMO, ships engaged in international trade in 1996 contributed about 1.8% of the total world’s CO2 emissions which is approximated as 2.7% in 2007 and this percentage could go two or three times higher by 2050 if Present trend continues [1]. In order to reduce CO2 emission, Marine Environment Protection Committee (MEPC) at its 62nd session adopted Resolution MEPC.203 (MEPC, 2011a) [2] which includes amendments to MARPOL Annex VI. It introduces new chapter 4 which intends to improve energy efficiency for ships through a set of technical performance standards. The amendments, which entered into force on 1 January 2013, require that every ship has the International Energy Efficiency (IEE) Certificate on board. In order to obtain the IEE Certificate a ship has to comply with the Energy Efficiency Design Index (EEDI) and the Ship Energy Efficiency Management Plan (SEEMP). The EEDI is mandatory for all new ships and SEEMP for all ships of 400 GT and above engaged in the international shipping. The EEDI is a simple formula that estimates CO2 output per ton-mile at one design condition.
Within the framework of discussion and deliberation leading to the EEDI adoption and beyond, considerable work has been contacted in order to prepare a suitable EEDI formulation and pave the way towards its adoption by the shipping industry. Anink and Krikke [3] analyzed the EEDI formula and correlation between the index values for all individual ship types for several types of vessels. Delta marines [4] evaluated the calculation of EEDI for conventional vessels, Ro-Ro and Ro-Pax ships. Larkin, Ozaki, Tikka and Michel [5] investigated the influence of design parameters on the energy efficiency design index. Kanu priya jain [6] investigated the impacts of energy design index in his master of science thesis. Borkowski and Kasyk [7] evaluated the operational approach of energy efficiency design index of container vessel. A Simic [8] has proposed a dependable formula for benchmarking energy efficiency and carbon emissions of inland cargo vessels for UK, which should be similar to already accepted approach for ocean going vessels. Yan Lin, Yan Yun and Guan [9] researched on energy efficiency deign index for sea going LNG carriers. Tien Anh Tran [10] calculated and assessed the EEDI index in the field of ship energy efficiency for bulk carrier. Sin and Oses [11] investigated the improvement of the energy efficiency of vessels as a measure for the reduction of greenhouses gases emission from sea shipping. Vladimir [12] analyzed the effect of ship on EEDI requirements for large container ships. Papunikolaou [13] investigated on energy efficient ship operation. Koos Frouws [14] calculated the emissions of sea going RoRO carriers. Rehmatulla, Calleya and Smith [15] investigated the implementation of technical energy efficiency and CO2 emission reduction measures in shipping.
Due to geographical advantages, waterways are the cheapest mode of transport for transporting passengers and cargoes in Bangladesh. Although, there are more than 1500 Cargo vessels plying all the year round in Bangladesh, but performance of these ships in terms CO2 emission is not known and any regulations related to the energy efficiency for inland cargo vessels still does not exist. Several attempts have made to develop a proper tool for seagoing vessels in terms of energy efficiency that can be found in various papers & reports but there are no suggested benchmarks that could be used for assessment of the energy efficiency of inland cargo vessels for Bangladesh. Having in mind the significance of energy efficiency benchmarking, which already has a huge influence on the global marine shipbuilding industry, this study has been performed based on available data of 351 existing inland cargo vessels of Bangladesh. From this perspective, this research will seek to review the present scenario of inland cargo vessels in terms of EEDI, analyze the results and propose some reliable tool for benchmarking energy efficiency and carbon emission of inland cargo vessels considering existing socio-economic and technical factors in Bangladesh.
Formulation of the Guidelines of EEDI for Inland Cargo Vessels in Bangladesh
Outline of the methodology
Primary data and information about different types of inland vessels of Bangladesh has to be collected through interacting with structured, unstructured and open ended questionnaires from Department of Shipping (DOS), Mercantile Marine Department (MMD), Bangladesh Inland Water Transport Corporation (BIWTC), Chittagong Port Authority (CPA), Mongla Port Authority (MPA) and from various private shipyards. Secondary data and information has to be collected from both external and internal means such as journals, reports, thesis, books, electronic and print media, ship owner associations, enlisted ship designing houses, related private organizations, web sites and other internet sources. Based on collected information a data base has to be developed for more than three thousand ships. In case of missing information of the collected data, simple assumption and calculation have to be required to adjust for missing data.
In order to establish EEDI reference lines for inland cargo vessels of Bangladesh 100% of deadweight has used as capacity for other vessels as suggested by IMO. The calculation of EEDI has to be performed for 75% of MCR of engine and with corresponding evaluated ship speed and the value of MCR has to be obtained from power speed curve supplied by engine manufacturer. Adopted value of carbon emissions factor (CF) for diesel fuel was 3.2 t CO2/t fuel, as recommended in [16].
In Bangladesh, inland vessels use new and old engines and most of these vessels’ engine power is around 200 to 1000KW. Specific fuel consumption (sfc) of these new engines as well as old ones has to be collected from engine manufacturer. The value of sfc for engines used for inland vessels has to be cross checked by taking log-book data of actual fuel consumption in different routes.
Establishment of the reference line regression model
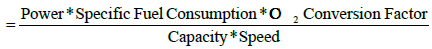
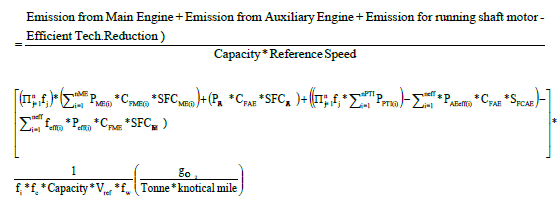
In this study the reports of MEPC 60 were used as the basis for the calculations. MEPC 60 has been working on the mandatory treaty text for implementing the EEDI method on new building vessels within MARPOL Annex VI. Based on all collected data, values of EEDI of analyzed inland waterway vessels have obtained according to the equation introduced by IMO:
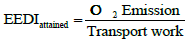 (1)
(1)
The Average Index Values are used as the basis for calculating an exponential regression line. The regression line expresses the baseline value, which can then be calculated by using the following formula:
Reference line value = a ×b-c (2)
From Figure 1 we observe that the value of a is 15831 and c is 0.789 where b indicates capacity. The reference line is based on the vessel database of Department of Shipping (DOS) in Bangladesh [17].

Figure 1: EEDI Reference line for Inland General Cargo Vessel of Bangladesh.
Here R2 describes the correlation of the baseline value. A correlation close to 1 or -1 represents a high degree of correlation. Points which have been more deviated from the regression line are not counted and a new regression line is developed so that the line not shows the erroneous data. This ensures that special ships and erroneous data are excluded from the calculation. From Figure 1 it is seen that the number of cargo vessels smaller than 3000 mt DWT in the dataset is limited. Based on the data available, the regression line of cargo vessels is slightly higher than the IMO baseline. It is not clear why most data points are above the baseline. A group of ships in the 1000-1500 ton DWT range have relatively index values around 70. These ships would fit in much better in the Figure1 showing EEDI values of cargo ships. The correlation of the regression line is low [18].
Reduction of EEDI reference line value
The Energy Emission Design Index adopted by the IMO in 2011 will affect most of these new ships. Time period for phase 1 is from 1st Jan 2015 to 31st Dec 2019, for phase 2 is from 1st Jan 2020 to 31st Dec 2024 and for phase 3 is from 1st Jan 2025 to onwards. Phase 1 indicates the reference line value whereas phase 2 and 3 will force an EEDI reduction of respectively 20% and 30% relative to the reference line for the ship type [19]. The design of the new buildings in the different phases must take the EEDI into account – this will affect the whole chain from naval architects to the ship owners to the yards. The attained EEDI shall be as follows:
Attained EEDI ≤ Required EEDI = (1-X/100) × Reference line value (3)
Where X is the reduction factor for the required EEDI compared to the EEDI reference line.
This attained EEDI must be less than the reference EEDI or reference line.
From Figure 2, we have seen that phase 2 and 3 has much more restriction on EEDI reference line values. For example, a 1000 DWT cargo vessel is designed for phase 1 should have required EEDI value 68 gm CO2/tonne.mile. Whereas for phase 2 the required EEDI value will be 54.4 gm CO2/tonne.mile and for phase 3 the required EEDI value will be 47.6 gm CO2/tonne.mile.

Figure 2: Phase wise EEDI Reference line reduction value for inland general cargo vessels.
Comparison between various countries inland cargo vessels EEDI reference lines
European countries have for a long time been concerned about the actual energy efficiency of ship designs, well before it was considered as a way to mitigate CO2 emissions. The Netherlands are deeply involved in the development of the EEDI. Supported by maritime experts, the Dutch delegation contributes to the preparation of legislation in the regular and intersessional meetings of MEPC working group on greenhouse gas emissions from ships. To gain insight into the effects of the EEDI on the Dutch fleet, the Ministry of Transport, Public Works and Water Management has tasked the foundation Centre for Maritime Technology and Innovation (CMTI) with this study. The main task in that study was to determine the EEDI values for ships within the Netherlands fleet and ships designed and built in the Netherlands between 1978 and 2008 [5]. Furthermore, in 2nd session of Intersessional meeting of the greenhouse gas working group in 4th February, 2009, energy efficiency design index baselines was submitted by Denmark [6]. In this paper Denmark & Netherlands formulated EEDI reference lines have been compared with the formulated reference line in this paper for Bangladesh.
From Figure 3, it has been observed that EEDI reference lines for cargo vessels of Bangladesh lies much above than Denmark & Netherlands. One of the main reasons behind this is inappropriate engine selections and inaccurate hull parameters selection that leads to higher EEDI value [20].

Figure 3: Various countries inland vessels EEDI reference lines, General cargo vessel.
Verification of reference line formula
The verification of mathematical model with capacity as independent variable data is shown in Table 1. In this mathematical model the attained EEDI has been calculated using equation 1 and required EEDI has been formulated using equation 2.
| Ship Name | Capacity(DWT) | Attained EEDI | Required EEDI | Difference |
|---|---|---|---|---|
| MV Banglar milon | 1192 | 55.05 | 59.18 | 0.20% |
| MV Sea Dream | 1319 | 52 55 | 54.64 | 3.60% |
| MV prince of kalam | 1142 | 61.74 | 61.19 | -0.90% |
| MV Elan Victory | 1050 | 65.83 | 65.39 | -0.70% |
| MV Beauty of Narail | 1105 | 65.28 | 62.78 | -4.00% |
| MV Nushrate Haq | 1152 | 63.8 | 60.82 | -4.90% |
| MV Central | 1220 | 59.2 | 58.12 | -1.90% |
| MV Annana-2 | 1014 | 66.66 | 67.24 | 0.90% |
| MV Khalil-1 | 1150 | 62.11 | 60.46 | -2.70% |
| MV nabil-2 | 2 975 | 61.42 | 69.33 | 11.40% |
Table 1: Validation of mathematical model with capacity as independent variable.
It has been observed from Table 1 that, the difference is within the permitted range between reference line value and actual EEDI value, so this reference line formula can provide a reference for EEDI calculation of inland cargo vessels of Bangladesh.
Present Status of Inland Vessels of Bangladesh with Respect to EEDI
More than four years have been passed since IMO regulations regarding the required energy efficiency of seagoing ships became mandatory. These regulations initiated development of new solutions for reduction of unnecessary energy dissipation during ship navigation. Moreover, the absence of proper evaluation method of energy efficiency of inland cargo vessels is a barrier to performance developments of these vessels. In this paper, a considerable effort has been devoted to this matter; so far there are no suggested benchmarks that could be used for assessment of inland cargo ship efficiency during design stage or for comparison of existing ships with respect to energy & emission efficiency. In this study, phase 1 has been applied and equation 2 has been used to assess the present status of inland cargo vessels of Bangladesh.
Present status of EEDI with respect to vessel’s length
From Figure 4 it has observed that in Bangladesh most of the inland cargo vessels length is between 51to 55m. In this range there are presently 262 vessels out of them 85 vessels pass in terms of EEDI and the rest of the vessels EEDI exceed the required value. It is also seen that bigger length vessels EEDI lies below the reference line. So we can say that bigger length vessels are more effective in terms of EEDI.

Figure 4: Present situation on EEDI with respect to vessel’s length.
Present situation of EEDI with respect to vessel’s capacity
From Figure 5 it has observed that in Bangladesh most of the inland cargo vessels capacity is between 1001 to 1250T. In this range there are presently 200 vessels out of them 61 vessels pass in terms of EEDI and the rest of the vessels EEDI exceed the required value. It is also seen that larger capacity vessels EEDI lies below the reference line. So we can say that larger capacity vessels are more effective in terms of EEDI.

Figure 5: Present situation on EEDI with respect to vessel’s Capacity.
Present situation of EEDI with respect to vessel’s Main engine power
From Figure 6 it has observed that in Bangladesh most of the inland cargo vessels main engine power is between 701 to 900 KW. In this range there are presently 316 vessels out of them 124 vessels pass in terms of EEDI and the rest of the vessels EEDI exceed the required value. In vessel’s main engine power between 801 to 900 KW, most of the vessels EEDI exceed the reference line. It has been observed that in Bangladesh most of the vessels EEDI exceed the reference line. It is also seen that smaller main engine power vessels EEDI lies below the reference line. So we can say that lower main engine power vessels are more effective in terms of EEDI.

Figure 6: Present situation on EEDI with respect to vessel’s Main Engine Power
Case Study of Existing Inland Vessels in Terms of EEDI
The basic formulation of EEDI is based on the ratio of total CO2 emission per tonne-mile.so, vessels particulars such as vessel length, draft, specific fuel consumption, capacity, engine power, speed etc. are needed to calculate the attained EEDI. To reduce fuel consumption and increase energy efficiency of commercial vessels fuel price is a vital factor. So, the commercial vessels need to be optimized in terms of EEDI in order to improve energy efficiency. During the design stage of the vessel, for known demands, hull form should be determined at the beginning. Based on principal ship parameters, it is possible to estimate the attained EEDI and to compare it with the required value.
If a criterion described in Figure 7 is fulfilled, something should be changed (improved) within the project, otherwise it is allowed to proceed to the next design stage. Naturally, results should be confirmed during the speed trials as is recommended to be done for the seagoing ships.

Figure 7: Procedure for evaluation of energy efficiency of a new ship during design stage [3].
Sample Ship (Cargo Vessel)
Sensitivity of EEDI has been carried out for a case inland cargo vessel.
Principal particulars of the Sample Case Ship:
According to IMO MEPC.1/Circ.68. [7] guidelines calculated EEDI for the Case ship is 46.46 g CO2/tnm (Table 2). But according to the formulated cargo vessel baseline, the attained EEDI for 2700 dwt cargo vessel is to be 31.05g CO2/tnm, thus the Case Ship is about 49.62% above the baseline which needs to match with the required EEDI value. When the speed of the vessel reduces to 8 knot from parent 10 knot then attained EEDI of the vessel is to be 30.34 g CO2/tnm which reduces the EEDI value of the vessel about 34.6% from the parent ship. In this study, resistance has been calculated using Holtrop and Mennen’s method [8].
| Length (O.A) | 76.0m | DWT | 2700 |
| Length (B.P) | 72.87m | Main Engine (Yanmar) |
2X829 BHP at100% MCR |
| Breadth (mld) | 15.0m | SFC (ME) | 190 g/KWh |
| Depth (mld) | 7.0m | Main Generator | 2X191KW |
| Draft | 3.8m | SFC (AE) | 210 g/KWh |
Table 2: Ship Specifications of 2700 DWT Cargo vessel.
From Table 3, it has been observed that EEDI (attained) decreases with the increase of length at 10 knot speed and without changing its carrying capacity. So at higher speed, longer vessels are performing well. From this Table 3 it has been also observed that, Total resistance and Main engine power (PME) decreases with the increase of length.
| Condition | Length (m) | Breadth (m) | Draft (m) | Cb | Displacement (T) | PME (KW) | Total Resistance (KN) | EEDI (Attained) |
|---|---|---|---|---|---|---|---|---|
| Basis | 72.87 | 15 | 3.8 | 0.857 | 3559 | 1918 | 101.93 | 46.46 |
| 5% less | 69.22 | 15.79 | 3.8 | 0.857 | 3559 | 1999 | 106.26 | 48.43 |
| 10% less | 65.58 | 16.67 | 3.8 | 0.857 | 3559 | 2093 | 111.23 | 50.7 |
| 5% more | 76.51 | 14.28 | 3.8 | 0.857 | 3559 | 1869 | 99.23 | 45.28 |
| 10% more | 80.15 | 13.63 | 3.8 | 0.857 | 3559 | 1837 | 97.6 | 44.5 |
Table 3: Optimization of ship’s length with respect to EEDI (cargo vessel).
Change in breadth of the vessel:
From Table 4, it has been observed that EEDI (attained) increases with the increase of breadth at 10 knot speed and keeping carrying capacity same as basis ship. From this Table 4 it has been also observed that, Total resistance and Main engine power (PME) increases with the increase of breadth.
| Condition | Length (m) | Breadth (m) | Draft (m) | Cb | Displacement (T) | PME (KW) | Total Resistance (KN) | EEDI (Attained) |
|---|---|---|---|---|---|---|---|---|
| Basis | 72.87 | 15 | 3.8 | 0.857 | 3559 | 1918 | 101.93 | 46.46 |
| 5% less | 76.7 | 14.25 | 3.8 | 0.857 | 3559 | 1866 | 99.2 | 45.22 |
| 10% less | 80.96 | 13.5 | 3.8 | 0.857 | 3559 | 1829 | 97.2 | 44.3 |
| 5% more | 69.4 | 15.75 | 3.8 | 0.857 | 3559 | 1994 | 105.97 | 48.3 |
| 10% more | 66.24 | 16.5 | 3.8 | 0.857 | 3559 | 2076 | 110.33 | 50.29 |
Table 4: Optimization of ship’s breadth with respect to EEDI (cargo vessel).
Change in speed of the vessel:
From Table 5, it is seen that EEDI (attained) increases with the increase of speed. It has been also observed that, Total resistance and Main engine power (PME) increases with the increase of speed. It can be decided easily that low speed gives the better performance in terms of EEDI.
| Condition | Speed (Knot) | PME (KW) | Total Resistance (KN) | EEDI (Attained) |
|---|---|---|---|---|
| Basis | 10 | 1918 | 101.92 | 46.46 |
| 5% less | 9.5 | 1645 | 92.04 | 41.96 |
| 10% less | 9 | 1382 | 81.64 | 37.22 |
| 15%less | 8.5 | 1178 | 73.64 | 33.57 |
| 20%less | 8 | 1002 | 66.56 | 30.34 |
Table 5: Optimization of ship’s speed with respect to EEDI (cargo vessel).
Change in block coefficient of the vessel:
From Table 6, it is seen that EEDI (attained) increases with the increase of block coefficient. It has been also observed that, Total resistance and Main engine power (PME) increases with the increase of block coefficient. It can be decided easily that, at any speed it is better to have small block coefficient.
| Condition | Length (m) | Breadth (m) | Draft (m) | Cb | Displacement (T) | PME (KW) | Total Resistance (KN) | EEDI (Attained) |
|---|---|---|---|---|---|---|---|---|
| Basis | 72.87 | 15 | 3.8 | 0.857 | 3559 | 1918 | 101.93 | 46.46 |
| 5% less | 72.87 | 15.79 | 3.8 | 0.814 | 3559 | 1705 | 90.6 | 41.3 |
| 10% less | 72.87 | 16.67 | 3.8 | 0.770 | 3559 | 1583 | 84.12 | 38.34 |
| 5% more | 72.87 | 17.64 | 3.8 | 0.728 | 3559 | 1503 | 79.9 | 36.42 |
| 10% more | 72.87 | 19.19 | 3.8 | 0.67 | 3559 | 1452 | 77.17 | 35.18 |
Table 6: Optimization of ship’s block coefficient with respect to EEDI (cargo vessel).
Change in engine of the vessel:
From Table 7, it is seen that EEDI (attained) increases with the increase of specific fuel consumption value. It has been also observed that, the price of engine increases which has low sfc value. It can be decided easily that low sfc gives the better performance in terms of EEDI. But considering the economic factor in Bangladesh, if the EEDI values between two engines are nearer then the engine which has high sfc would be used. Here in this study, the ship building cost has been taken into consideration but not the increase in the operating cost (fuel cost) during ship life cycle.
| Engine Name | SFC (g/Kwh) | Price (USD) | EEDI (Attained) |
|---|---|---|---|
| Cummins | 165 | 950000 | 40.39 |
| Yanmar | 190 | 810000 | 46.46 |
| Weichai | 200 | 630000 | 48.89 |
| Nigbo CSI | 210 | 600000 | 51.32 |
Table 7: Optimization of ship’s engine with respect to EEDI (cargo vessel).
Hull Form Optimization
Vessel’s lines plan greatly influences ships performance such as sea worthiness, resistance & propulsion, maneuverability etc. The main target of naval architects is to get the suitable hull shape which gives lesser resistance that can be done by model testing now a days Bangladesh is emerging as a ship building nation. So, to achieve the quality and soundness of the vessel, a hull form optimization needs to be carried out for the vessel in order to get the minimum power requirement.
The principal particulars of the existing general cargo ship are shown in Table 8.
| Length (O.A) | 62.8m | DWT | 1800 |
| Length (B.P) | 60.075m | Main Engine (Yanmar) |
2 × 720 BHP at 100% MCR |
| Breadth (mld) | 11.5m | SFC (ME) | 190 g/KWh |
| Depth (mld) | 4.8m | Main Generator | 2 × 200KW |
| Draft | 3.07m | SFC (AE) | 210 g/KWh |
Table 8: Ship Specifications of Cargo Vessel.
According to the specifications, we have found that the EEDI value for this vessel is 42.8 g CO2/ton mile and the maximum EEDI value for this vessel is 41.5 g CO2/ton mile. So, this vessel exceeds its EEDI value and needs the optimization of hull form.
The comparisons of body plans between the modified hull form and the original hull are shown in Figure 8 and in this Figure 8 yellow line shows the original body plan & green line shows the modified body plan. In this comparison ship’s hull has been optimized by keeping its principal parameters (e.g. length, breadth, draft and cargo carrying capacity same). In original model the displacement volume is 1745 m3 but in improved model the displacement volume is 1505 m3.

Figure 8: Contrast Between body plans of the original hull form and the modified hull form (General Cargo Vessel).
Resistance Vs Speed graphs:
From Figure 9 we have seen that whereas in original lines plan resistance have found 57.7KN but in modified lines the resistance value is 52 KN at 10 Knot service speed.so, the modified lines has given less resistance than the original one.

Figure 9: Resistance Vs Speed Graph (General Cargo Vessel).
Power Vs Speed graphs:
From Figure 10 we have seen that whereas in original lines plan required main engine power is 300 KW but in modified lines the required power is 270 KW. By original lines plan we have found the EEDI value for the vessel is 11.8 g CO2/ton mile but the modified lines plan we have found the EEDI value 10.9 g CO2/ton mile. Though originally 1045 KW power has been provided in this vessel but this vessel needs 300KW. Hydrodynamic characteristics of the vessels are dependent on hull shape. So, we can say that a better and smooth hull design gives lesser resistance and hence gives better EEDI values.

Figure 10: Power Vs Speed Graph (General Cargo Vessel).
Conclusion
Having in mind the significance of energy efficiency benchmarking, which already has a huge influence on the global marine shipbuilding industry, this study has performed, based on available data of existing inland cargo vessels in Bangladesh and the following could be concluded:
• The EEDI introduced by IMO for evaluation of energy efficiency of cargo vessels can’t be used for proper evaluation of energy efficiency of inland cargo vessels. The reason for this is the limitation of carrying capacity and installed main engine power for inland waterways vessels. For that reason a reference line formula has been proposed in this paper which would be used to calculate required EEDI value of inland cargo vessels in Bangladesh.
• Formulated baseline equations for EEDI of Bangladesh lies much above than other countries like Denmark & Netherlands and one of the reasons for that is inappropriate engine selection of most of the inland cargo vessels in Bangladesh.
• Comparatively longer vessel is favorable from the EEDI point of view. A slender hull form, which will create a smaller pressure difference between bow and stern, is favorable.
• Lower main engine power vessels are more effective in terms of EEDI.
• A better and smooth hull design gives lesser resistance and hence gives better EEDI values.
References
- Hasan R (2011) Impact of EEDI on Ship Design and Hydrodynamics, M.Sc. Thesis, Chalmers University of Technology, Sweden.
- IMO (2011) New Regulations to Reduce GHG from Ships, Resolution MEPC. 203(62).
- Krikkle M, Annik D (2009) The IMO Energy Efficiency Design Index- A Netherlands Trend Study, CMTI.
- Deltamarin (2009) Report on EEDI Tests and Trials for EMSA, Deltamarin Ltd.
- Larkin J, Ozaki Y, TikkaK,Michel K (2010) Influence of Design Parameters on the Energy Efficiency Design Index (EEDI).
- KanuPriya Jain (2012) Thesis for the degree of Master of Science, “Impacts of Energy Efficiency Design Index”, Newcastle University.
- Borkowski T, Kasyk L, Kowalak P (2012) Energy Efficiency Design Index of Container Vessel- Operational Approach.” Journal of KONES Powertrain and Transport 19: 93-100.
- Simic A (2014) Energy Efficiency of Inland Waterway Self-Propelled Cargo Ships, Conference on Influence of EEDI on Ship Design, London, UK.
- Yan Lin, Yanyun Yu, Guan Guan (2014) Research on Energy Efficiency Design Index for Sea-going LNG Carriers, Journal of Marine Science and Application. 13: 430-436.
- TienAnh Tran (2015) Calculation and Assessing the EEDI Index in the Field of Ship Energy Efficiency for M/V Jules Garnier, Journal of Marine Science: Research & Development 6: 1-6.
- Sin M, Oses F (2015) Improvement of the energy efficiency of vessels as a measure for the reduction of greenhouses gases emission from sea shipping. Journal of Maritime technology and Environment.
- Vladimir N, Ancˇic´ I, estanA (2015) Effect of ship size on EEDI requirements for large container ships. Journal of Marine Science and Technology.
- Papanikolaou A , Zaraphonitis G , Bitner-Gregersen E, Shigunov V, El Moctar O, et al. (2016) Energy efficient safe Ship Operation (SHOPERA). Transportation Research Procedia 14: 820 - 829.
- KoosFrouws (2016) Is reducing speed the right mitigating action to limit harmful emissions of Seagoing RoRo cargo carriers?. Journal of Shipping and Trade 1: 9.
- Rehmatulla N, Calleya J, Smith T (2017) The implementation of technical energy efficiency and CO2 emission reduction measures in shipping. Journal of Ocean Engineering 139: 184-197.
- IMO (2014) Guidelines of the Method of Calculation of the Attained energy Efficiency Design Index for New Ships, Resolution MEPC.
- Krikkle M, Annik D (2011) Analysis of the Effect of the New EEDI Requirements on Dutch Build and Flagged Ships, CMTI.
- Recalculation of energy efficiency design index baselines for cargo ships (submitted by Denmark), INTERSESSIONAL MEETING OF THE GREENHOUSE GAS WORKING GROUP, 2nd session.
- IMO (2014) Guidelines on Survey and Certification of the Energy Efficiency Design Index (EEDI), Resolution MEPC.
- Holtrop J, Mennen GJJ (1982) An Approximate Power Prediction Method. International Shipbuilding Progress 29: 166-170.
Relevant Topics
- Algal Blooms
- Blue Carbon Sequestration
- Brackish Water
- Catfish
- Coral Bleaching
- Coral Reefs
- Deep Sea Fish
- Deep Sea Mining
- Ichthyoplankton
- Mangrove Ecosystem
- Marine Engineering
- Marine Fisheries
- Marine Mammal Research
- Marine Microbiome Analysis
- Marine Pollution
- Marine Reptiles
- Marine Science
- Ocean Currents
- Photoendosymbiosis
- Reef Biology
- Sea Food
- Sea Grass
- Sea Transportation
- Seaweed
Recommended Journals
Article Tools
Article Usage
- Total views: 5250
- [From(publication date):
August-2017 - Mar 31, 2025] - Breakdown by view type
- HTML page views : 4320
- PDF downloads : 930