Review Article Open Access
Development and Validation of UPLC Method for the Determination of Duloxetine Hydrochloride and Its Impurities in Active Pharmaceutical Ingredient
Rohith T1, Ananda S1,2*, Sajan PG2 and Gowda NM3
1Deepta Laboratories, Vishsweshwara Nagar, Mysore, India
2Department of Studies in Chemistry, Manasagangothri, University of Mysore, India
3Department of Chemistry, Western Illinois University, One University Circle, Macomb, USA
- *Corresponding Author:
- Ananda S
Department of Studies in Chemistry
Manasagangothri, University of Mysore, India
Tel: +91 821 2419663
Fax: +91241936
E-mail: snananda@yahoo.com
Received Date: December 17, 2014; Accepted Date: February 21, 2015; Published Date: February 27, 2015
Citation: Rohith T, Ananda S, Sajan PG, Gowda NM (2015) Development and Validation of UPLC Method for the Determination of Duloxetine Hydrochloride and Its Impurities in Active Pharmaceutical Ingredient. J Anal Bioanal Tech 6:234. doi: 10.4172/2155-9872.1000234
Copyright: © 2015 Rohit T, et al. This is an open-access article distributed under the terms of the Creative Commons Attribution License, which permits unrestricted use, distribution, and reproduction in any medium, provided the original author and source are credited.
Visit for more related articles at Journal of Analytical & Bioanalytical Techniques
Abstract
A suitable, rapid, sensitive and accurate ultra-performance liquid chromatography (UPLC) method was developed for the quantitative determination of Duloxetine hydrochloride and its impurities in active pharmaceutical ingredient. Chromatographic separation was achieved on shim-pack XR-ODS II (3.0 × 100 mm, 2.2 μm), and the gradient eluted within a period of time, that is, 15 minutes. The eluted compounds were monitored at 230 nm. The flow rate was 0.9 ml/min and the column oven temperature was maintained at 40ºC. The resolution of Duloxetine hydrochloride and 12 impurities (potential impurity, process related impurity and degradation products) were greater than 1.3. The correlation coefficient (r2>0.99) values indicated clear correlations between the investigated compound concentrations and their peak areas within the quantitation limit to 200% level. The performance of the method was validated according to the present ICH guidelines for specificity, quantitation limit, detection limit, linearity, accuracy, precision, ruggedness and robustness. The recoveries obtained (93.28-102.41%) ensured the accuracy of the developed methods.
Keywords
Duloxetine hydrochloride; Validation; Impurity; UPLC
Introduction
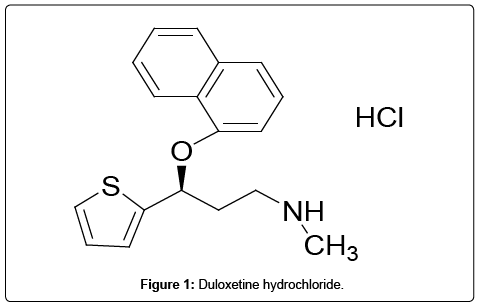
Duloxetine hydrochloride, a selective serotonin and norepinephrine reuptake inhibitor (SSNRI) is used for the treatment of major depressive disorder and anxiety [1-3]. Duloxetine hydrochloride chemically described as (+)-[S]-N-methyl-y-[1-naphthyloxy]-2- thiophenepropylaminehydrochloride [4]. The empirical formula is C18H19NOS.HCl and molecular mass 333.88. Duloxetine hydrochloride is an anti-hypertension drug which provides evidence of an effect on pain in the case of urinary incontinence independent of its effect on depression [5,6]. Therefore, Duloxetine hydrochloride is an alternative to current therapeutic options for the treatment of different symptoms of depression [7]. As per the literature survey it is revealed that very few analytical methods are reported. HPLC method for the simultaneous estimation of key intermediates of duloxetine hydrochloride has been reported [8]. HPLC analysis of the novel antidepressant duloxetine in human plasma after solid-phase extraction procedure has also been reported [9]. Moreover, duloxetine hydrochloride has been determined in the presence of process and degradation impurities by a validated stability indicating RP-LC method. RP-LC method development and validation of determination for estimation of duloxetine hydrochloride in enteric coated capsules has also been reported. Duloxetine has been determined in pharmaceutical preparations by liquid chromatography [10,11], spectrophotometric [12], and liquid chromatography-mass spectrometry [13-15] methods. A HPTLC method separated Duloxetine in bulk and in tablet dosage form [16] and capillary electrophoresis with laser-induced fluorescence detection method are also reported for estimation of duloxetine in human plasma [17]. Ultra-performance liquid chromatography (UPLC) is a recent technique in liquid chromatography, which enables significant reduction in separation time and solvent consumption. Literature indicates that UPLC system allows approximately nine fold decrease in analysis time as compared to the conventional high performance liquid chromatography system (HPLC). This study identified 12 impurities in duloxetine hydrochloride during its process development (Table 1). Out of 12 impurities, United States of Pharmacopeia reports 6 impurities viz; imp-B, imp-C, imp-D, imp-E and imp-F were taken for validation (impurity-A was not considered) and remaining 7 impurities were found as new ones in this synthetic process. Currently the determination of impurities is one of the most difficult tasks for pharmaceutical analysis. Duloxetine and its impurities should be monitored together with their degradation compounds, preferably in a single chromatographic run. According to our research, none of the currently available analytical methods can separate and quantify all the known related compounds of duloxetine hydrochloride and its impurities. It is, therefore, necessary to develop a new analytical method for the determination and quantitative estimation of Duloxetine hydrochloride impurities. Hence, a reproducible analytical method was developed for the quantitative determination of duloxetine hydrochloride and its 12 impurities. This method was successfully validated according to the ICH guidelines. The chemical structures of Duloxetine hydrochloride and its impurities are shown in Table 1. Duloxetine Hydrochloride and its Potential impurities (Figure 1).
| Sham | ICS1 | ICS2 | ICS4 | LABA1 | LABA2 | LABA4 | |
|---|---|---|---|---|---|---|---|
| TT (N/cm2) | 4.2 ± 0.4 | 4.3 ± 0.5 | 4.0 ± 0.3 | 4.0 ± 0.6 | 4.4 ± 0.3* | 4.3 ± 0.3* | 4.6 ± 0.4* |
| CT (msec) | 39.4 ± 1.9 | 34.3 ± 1.7* | 32.4 ± 1.5** | 42.1 ± 2.0 | 34.8 ± 3.3 | 41.1 ± 1.8 | 36.1 ± 1.8 |
| HRT (msec) | 45.0 ± 4.6 | 34.2 ± 2.7*** | 36.9 ± 2.9** | 54.0 ± 5.3 | 44.9 ± 6.8 | 50.5 ± 6.2 | 40.1 ± 2.9 |
| Fatigue (%) | 39.9 ± 3.6 | 33.4 ± 2.7 | 32.5 ± 2.2 | 36.8 ± 2.4 | 33.4 ± 1.9 | 37.9 ± 2.4 | 36.6 ± 2.4 |
| TT/CT (N/cm2/sec) | 95.3 ± 13.3 | 127.4 ± 13.9 | 125.2 ± 8.0 | 93.5 ± 10.9† | 129.0 ± 9.9 | 106.8 ± 9.0 | 131.0 ± 15.6 |
| (TT/2)/HRT (N/cm2/sec) | 43.0 ± 7.2 | 64.9 ± 7.8 | 55.6 ± 3.0 | 39.0 ± 5.6†† | 55.8 ± 7.6 | 45.9 ± 4.6 | 58.9 ± 5.6 |
ICS1, ICS2, and ICS4 express 1 h, 2 h, and 4 h after ICS inhalation. LABA1, LABA2, and LABA4 express 1 h, 2 h, and 4 h after LABA inhalation.
TT: Twitch Tension; CT: Contraction Time; HRT: Half-Relaxation Time.
*p<0.05, **p<0.01, ***p<0.001. compared with sham.
†p<0.05, ††p<0.01 compared with each value at ICS1.
Table 1: Changes in twitch kinetics in the sham, ICS inhalation-only, and LABA inhalation-only groups.
Experimental
Materials and reagents
Duloxetine hydrochloride and its impurities were purchased from LGC Promochem India Pvt Ltd, Bangalore, India, and the chemical structures are given in Table1. HPLC grade acetonitrile, methanol, triethyl amine and orthophosphoric acid were purchased from Merck, Germany. Water was prepared in-house by using a Millipore Milli-Q plus water purification system (Millipore Corporate Headquarters, Billerica, MA, USA).
Equipment’s and chromatographic conditions
A Shimadzu prominence UFLC-XR system equipped with inbuilt auto injector, and photo diode array detector was utilized for method development and validation, Water´s Empower2 was used for data acquisition and system suitability calculations. The chromatographic conditions were optimized using a shim-pack XR-ODS II (3.0 × 100 mm, 2.2 μm). The Column was maintained at 40ºC ± 2ºC. The buffer preparation was by dissolving 5.5 mL of orthophosphoric acid in 950 mL water, pH adjusted to 3.2 by using triethyl amine. Mobile phase pump-A was a mixture of buffer and acetonitrile in the ratio (78:22 v/v) and mobile phase pump-B was acetonitrile. The flow rate was set at 0.9 mL/min. The detection was carried out at a wavelength of 230 nm. The injection volume was 2 μl. The run time was 15 min. The gradient elution was (T min % B) T0:0, T5:0, T10:27, T11:85, T13:85, T13.70:0 and T15:0 The diluent used mobile phase-A and acetonitrile in the ratio (9:1) throughout the analysis.
Sample preparation
The analyte concentration of Duloxetine hydrochloride was fixed as 1.0 mg/mL. Working solutions of Duloxetine hydrochloride and its impurities were prepared in diluent. The Analytical method validation was performed with the specification limit of 0.15% level with respect to sample concentration (1.0 mg/mL).
Method Validation
The described method has been validated for the related substances by UPLC determination.
Precision
The repeatability of the method for the related substances was checked by a six-fold analysis of 1.0 mg/mL of duloxetine hydrochloride spiked with 0.15% of each of the impurities. The RSD (%) of peak area was calculated for each impurity. Precision was determined by a sixfold analysis of 1.0 mg/mL of duloxetine spiked with 0.15% of each of the impurities.
Accuracy
The accuracy of an analytical procedure expresses the closeness of agreement between the true value and the observed value. The accuracy of the impurities of duloxetine hydrochloride was evaluated in triplicates at 5 concentrations (50%, 75%, 100%, 125% and 150%) with respect to 1.0 mg/mL of sample concentration and the recovery of the impurities were calculated.
Linearity
The detector response of linearity for all impurities were assessed by injecting impurities separately prepared solutions in the range of QL to 200% (QL, 0.075, 0.1125, 0.15, 0.1875, 0.225, 0.30%) with respect to sample concentration which is 1.0 mg/mL. The correlation coefficient slope and y-intercepts of the calibration curve were determined.
Detection limit and quantitation limit
The Quantitation limit (QL) and Detection limit (DL) for Duloxetine hydrochloride impurities were determined by signal to noise ratio method.
Robustness
The robustness of an analytical procedure is a measure of its capacity to remain unaffected by small, but deliberate variations in method parameters and provides an indication of its reliability during normal usage. To determine the robustness of the method, the experimental conditions were deliberately changed. The solution of duloxetine hydrochloride and its impurities was evaluated. The mobile phase flow rate was set at 0.9 mL/min; to study the effect of the flow rate on resolution, it was changed to 0.8 mL/min and 1.0 mL/min. The effect of column temperature was studied at 45ºC and 35ºC (instead of 40ºC).
Solution stability and mobile phase stability
The stability of the analyte was established for standard and sample solutions under conditions as prescribed in the method. The purpose of this procedure was to determine the time during which the standard and sample solutions remain stable.
Results and Discussion
Method development and optimization
The main target of the UPLC method was to achieve the separation of impurities (key starting material, intermediates, by-products from synthesis of duloxetine hydrochloride, and degradation products) and the main component duloxetine hydrochloride.
Trial 01: Initially, Sodium di hydrogen orthophosphate buffer (0.01M) and 0.1% triethyl amine with pH 7.0 as mobile phase-A and acetonitrile and water in the ratio (90:10) as mobile phase-B was tried on a C18 stationary phase with a shim-pack XR-ODS II (3.0 × 100 mm, 2.2 μm). Flow rate was kept at 1.0 mL/min. When Duloxetine hydrochloride sample spiked with all impurities was injected, it was observed that impurity-D and Duloxetine hydrochloride was coeluted. Changes were made with respect to gradient composition and mobile phase-B ratio, but there was no separation observed between impurity-E and Duloxetine hydrochloride. In this method, few other impurities were also not eluted (Impurity-D, Impurity-E and Impurity-J). Chromatogram is shown in Figure 2.
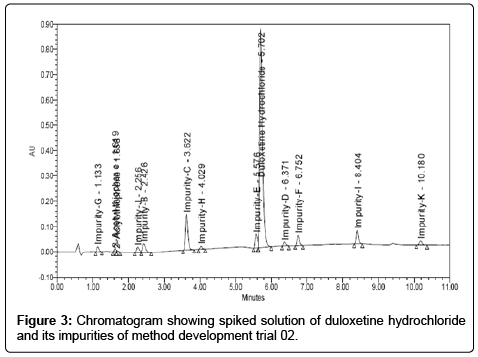
Trial 02: Based on first trial another trial was carried out by using C18 column waters acuity HSS T3 2.1 × 100 mm, 1.8 μm, with the column temperature 40ºC and flow rate at 0.4 mL/min. We switched over to other trial which contained buffer preparation of di-potassium hydrogen orthophosphate (2.8 gram) with pH 8.5. Mobile phase-A contained buffer and acetonitrile in the ratio (80:20) and mobile phase-B contained methanol and acetonitrile in the ratio (85:15). Duloxetine hydrochloride spiked sample solution was injected. With this trial we achieved separation of impurity-E and base line was good, however, it was observed that resolution between impurity-E and Duloxetine hydrochloride was less at about 0.9. In this method 3-Acetyl and 2-Acetyl thiophene was co-eluted, responses of the impurities were less and peaks tailings were also more in impurities as well as in Duloxetine hydrochloride. Likewise, many trials were performed by changing gradient composition, temperature and slight variations in pH, but we observed that there was no improvement in resolution and peak shape. Chromatogram is shown in Figure 3.
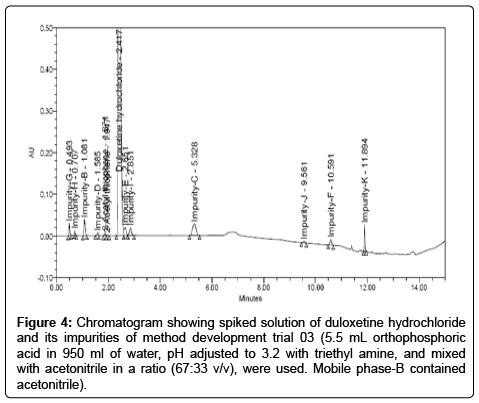
Trial 03: The criticality was observed via the selection of columns and pH of the buffer, and was extensively studied for optimization of the same. A shim-pack XR-ODS II (3.0 × 100 mm, 2.2 μm) column with buffer having pH of 3.2 was found to be satisfactory: at lower pH 3.2 all impurities gets separated with good peak shapes. The method development attempts were made in acidic mobile phase. We changed the composition of mobile phase-A, while keeping the other chromatographic parameters unchanged, which lead to increase in the resolution and sharpness of the peak. As a result, 5.5 mLorthophosphoric acid in 950 mL of water, pH adjusted to 3.2 with triethyl amine, and mixed with acetonitrile in a ratio (67:33 v/v), were used as mobile phase-A. Mobile phase-B contained acetonitrile with a gradient elution (Tmin %B) T0:0, T5:0, T10:27, T11:85, T13:85, T13.70:0 and T15:0 and flow rate set as 0.9 mL/min. All the impurities were separated from each other as well as from duloxetine hydrochloride. In this method resolution between duloxetine hydrochloride, impurity-E and impurity-I were less, hence, the method was not found suitable. The Chromatogram shown in Figure 4.
Figure 4: Chromatogram showing spiked solution of duloxetine hydrochloride and its impurities of method development trial 03 (5.5 mL orthophosphoric acid in 950 ml of water, pH adjusted to 3.2 with triethyl amine, and mixed with acetonitrile in a ratio (67:33 v/v), were used. Mobile phase-B contained acetonitrile).
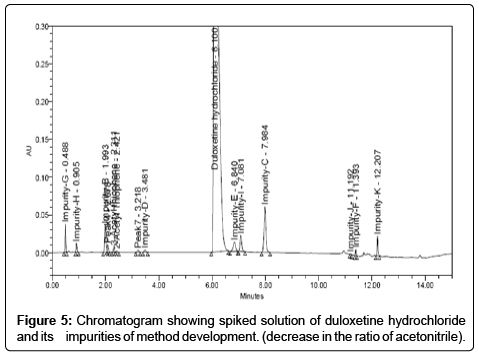
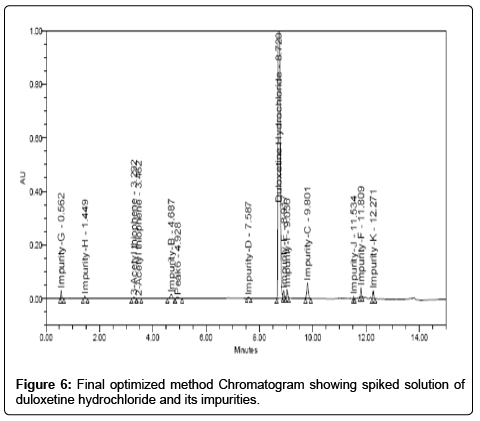
Trial 04: As the means was to increase the resolution, the percentage of acetonitrile in the mobile phase was decreased from the initial ratio. The result of this change showed that the resolution between duloxetine hydrochloride and impurity-E was achieved more about 2.81 but peak tailing was high (Chromatogram shown in Figure 5). Therefore, further method development trials were performed on gradient mode. Finally, satisfactory peak shape and the resolution of closely eluting impurities was achieved on shim-pack XR-ODS II (3.0 × 100 mm, 2.2 μm) column by using mobile phase: the buffer preparation was by dissolving 5.5 mL of orthophosphoric acid in 950 mL water, pH adjusted to 3.2 by using triethyl amine. Mobile phase pump-Awas mixture of buffer and acetonitrile in the ratio (78:22 v/v) and mobile phase pump-B was acetonitrile. The gradient program also played a vital role in the separation of all the peaks (impurity-J, impurity-B, impurity-C, impurity-D, impurity-E, impurity-F, impurity-G, impurity-H, impurity-I, impurity-K, 3-acetyl thiophene and 2-acetyl thiophene) with in short time. Thegradient elution was (Tmin %B) T0:0, T5:0, T10:27, T11:85, T13:85, T13.70:0 and T15:0. The column oven temperature was maintained at 40ºC. The detector set at 230 nm. The chromatogram is depicted in Figure 6.
Validation of the Method
Precision
The RSD (%) in the repeatability of the Duloxetine hydrochloride was within 1.0%. The RSD (%) of the peak area for the impurities in the repeatability results is shown in Table-2. The RSD (%) results of Duloxetine hydrochloride and its impurities for intermediate precision are within 2.0% these results confirmed the high precision of the method.
| E-sham | E4 | EL-sham | ICSE4 | LABAE4 | |
|---|---|---|---|---|---|
| TT (N/cm2) | 3.8 ± 0.3 | 3.4 ± 0.3 | 3.7 ± 0.3 | 4.2 ± 0.4 | 4.7 ± 0.5§ |
| CT (msec) | 35.9 ± 1.6 | 34.7 ± 1.7 | 34.2 ± 2.2 | 31.0 ± 2.2 | 31.6 ± 1.7 |
| HRT (msec) | 43.7 ± 2.6 | 32.3 ± 3.2** | 35.6 ± 2.8 | 28.8 ± 2.0 | 36.4 ± 4.4 |
| Fatigue (%) | 37.6 ± 1.9 | 45.9 ± 2.8* | 36.0 ± 2.1 | 35.0 ± 2.1 | 27.8 ± 3.2† |
| TT/CT (N/cm2/sec) | 107.9 ± 9.6 | 97.3 ± 7.9 | 107.3 ± 7.8 | 139.4 ± 11.8† | 156.8 ± 25.2†† |
| (TT/2)/HRT (N/cm2/sec) | 44.7 ± 3.8 | 53.7 ± 3.2 | 51.3 ± 3.8 | 74.4 ± 5.2††† | 73.5 ± 12.4† |
E-sham and E4: sham and 4 h after saline+endotoxin injection
EL-sham, ICSE4 and LABAE4: sham and 4 h after ICS+endotoxin injection, and 4 h after LABA+endotoxin injection
TT: Twitch Tension; CT: Contraction Time; HRT: Half-Relaxation Time.
*p<0.05, **p<0.01 compared with E-sham.
†p<0.05, ††p<0.01, †††p<0.001 compared with EL-sham.
Table 2: Changes in twitch kinetics in the endotoxin injection groups (E-sham and E4), and in the endotoxin injection plus ICS or LABA inhalation groups (EL-sham,
ICSE4, and LABAE4).
Detection limit and quantitation limit
The determined detection limit, quantitation limit and precision at QL values for duloxetine hydrochloride and its impurities are reported in Table 2.
Accuracy
The recovery of duloxetine hydrochloride impurities ranged from 93.28-102.41%.
Linearity
For all duloxetine hydrochloride impurities, a linear calibration curves was obtained ranging from QL to 0.3% (QL, 50%, 75%, 100%, 125%, 150% and 200%). The correlation coefficient obtained was greater than 0.999 (Table 2). The linearity was determined over three consecutive injections, which confirmed the linear relationship between the peak areas and concentrations. The linearity range was QL to 200% with respect to 1.0 mg/ml of duloxetine hydrochloride. The results indicate clear linearity.
Robustness
In all the deliberately varied chromatographic conditions (flow rate, column temperature and pH variation), all of the analyte were adequately resolved, and the order of elution remains unchanged.
Stability in solution and mobile phase solution
No significant changes in the amounts of the impurities were observed during solution stability and mobile phase experiments when performed by the related substances method. The results from the solution stability and mobile phase stability experiments confirmed that the standard solutions and solutions in the mobile phase were stable for up to 72 hrs during the determination of related substances.
Conclusion
The rapid gradient UPLC method was developed and validated for duloxetine hydrochloride and its impuritiesis precise, accurate, linear, robust, and specific. Satisfactory results were obtained from the validation of the method. The retention time 8.7 min enabled rapid determination of the drug and successfully developed a novel method for separation of duloxetine hydrochloride 12 impurities in a single run with in a shorter time about 15 min.This method exhibited excellent performance in terms of sensitivity and speed. It was observed that this method is vividly cost effective when compared to pharmacopeia method. Also, it was found that few impurities were not separated as per pharmacopeia method. Therefore, this method indicates stability and was found to be the best suitable method for routine analysis of production samples.
Acknowledgements
The authors wish to thank the management of Deepta Laboratories, Mysore and Anvita G.P, for their constant support and encouragement providing necessary facilities to carry out this work.
References
- Turcotte JE, Debonnel G, de Montigny C, Hébert C, Blier P (2001) Assessment of the serotonin and norepinephrine reuptake blocking properties of duloxetine in healthy subjects. Neuropsychopharmacology 24: 511-521.
- Chalon SA, Granier LA, Vandenhende FR, Bieck PR , Bymaster FP, et al. (2003) Duloxetine Increases Serotonin and Norepinephrine Availability in Healthy Subjects; A Double-Blind, Controlled Study. Neuropsychopharmacology, 28: 1685-1693.
- L. Mishra (2006) In: Drug Today. Lorina Publications Inc., Delhi, India
- O’Neil MJ, (2006) The Merck Index. (14thedn), Merck & Co, Inc., Whitehouse Station, NJ.
- Lantz RJ, Gillespie TA, Rash TJ, Kuo F, Skinner M, et al. (2003) Metabolism, excretion, and pharmacokinetics of duloxetine in healthy human subjects. Drug MetabDispos 31: 1142-1150.
- Michel MC, Oelke M (2005) Duloxetine in the treatment of stress urinary incontinence. Womens Health (LondEngl) 1: 345-358.
- Bauer M, Möller HJ, Schneider E (2006) Duloxetine: a new selective and dual-acting antidepressant. Expert OpinPharmacother 7: 421-427.
- Soni P, Mariappan TT, Banerjee UC (2005) High-performance liquid chromatographic method for the simultaneous estimation of the key intermediates of duloxetine. Talanta 67: 975-978.
- Johnson JT , Oldham SW, Lantz RJ, Delong AF (1996) High performance Liquid Chromatographic Method for the determination of duloxetine and desmethyl Duloxetine in Human plasma. J. LiqChromatogrRel Technol. 19: 1631-1641.
- Srinivasulu P, Srinivas KS, Reddy RS, Mukkanti K, Buchireddy R (2009) A validated stability indicating rapid LC method for duloxetine HCl. Pharmazie 64: 10-13.
- Yang J , Lu X, Bi Y, Qin F, Li F(2007) Chiral separation of duloxetine and its R-Enantiomer. LC. Chromatogr, 66: 389-393.
- Kamila MM, Mondal N, Ghosh LK (2007) A validated UV spectrophotometric method for determination of duloxetine hydrochloride. Pharmazie 62: 414-415.
- Selvan PS, Gowd V, Mandal U, Sam Solomon WD, Pal TK (2007) Determination of duloxetine in human plasma by liquid chromatography with atmospheric pressure ionization-tandem mass spectrometry and its application to pharmacokinetic study. J. chromatogram. B,858: 269-275.
- Satonin DK, McCulloch JD, Kuo F, Knadler MP (2007) Development and validation of a liquid chromatography-tandem mass spectrometric method for the determination of the major metabolites of duloxetine in human plasma. J Chromatogr B AnalytTechnol Biomed Life Sci 852: 582-589.
- Jansen PJ, Oren PL, Kemp CA, Maple SR, Baertschi SW (1988) Characterization of impurities formed by interaction of duloxetine HCl with enteric polymers hydroxypropyl methylcellulose acetate succinate and hydroxypropyl methylcellulose phthalate. J. Pharm. Sci. 87: 81-5.
- Dhaneshwar SS, Deshpande P, Patil M, Vadnerkar G, Dhaneshwar SR (2008) Development and validation of a HPTLC method for Estimation of Duloxetine Hydrochloride in Bulk Drug and in Tablet Dosage Form. Indian J Pharm Sci 70: 233-236.
- Musenga A, Amore M, Mandrioli R, KenndlerE,deMartino L, et al.(2009)Determination of duloxetine in human plasma by capillary electrophoresis with laser-induced fluorescence detection. J. Chromatogr. B. 877: 1126-1132.
Relevant Topics
Recommended Journals
Article Tools
Article Usage
- Total views: 16533
- [From(publication date):
February-2015 - Jul 15, 2025] - Breakdown by view type
- HTML page views : 11810
- PDF downloads : 4723

