Development and Minimizing the Carryover of A Sensitive and High Throughput LC ESI MS/MS Method for the Quantification of Rizatriptan in Human Plasma and Its Application in a Clinical Trial
Editor assigned: 01-Jan-1970 / Reviewed: 01-Jan-1970 / Revised: 01-Jan-1970 /
Abstract
A simple, sensitive, and high throughput liquid chromatographic method coupled with the tandem mass spectrometry method has been developed and validated to quantify rizatriptan in human plasma using rizatriptan D 6 as an internal standard. The analyte and internal standard were extracted from plasma via solid-phase extraction and were separated on a C 18 column using methanol: 5mM ammonium acetate buffer: formic acid (80/20/0.1 v/v/v) as a mobile phase. The mass transitions m/z 270.24→201.10 and m/z 276.21→207.20 were used to measure rizatriptan and rizatriptan D 6 respectively. The proposed method validated for a linear dynamic range of 0.151-52.170 ng/mL with a correlation coefficient ≥0.999, where the regression model (1/×2) was best fitted. The carryover of the method in both aqueous and extracted blank samples after the highest concentration level (52.17 ng/mL) was less than 5% compared to the LLOQ concentration level (0.151 ng/mL). The recovery of rizatriptan at LQC, MQC, HQC levels were 79.7, 82.3, and 79.4%, respectively consistent and reproducible. The within and between batches assay precision (% CV) across the three validation batches (LLQC, LQC, MQC, and HQC) were in the range of 1.0-6.5% and 3.0-8.9% respectively. The validated method has been successfully applied to investigate a clinical pharmacokinetic study.
Keywords: Carryover; Bio-analytical challenges; Rizatriptan benzoate; LC-MS/MS; Matrix effect; Tandem mass spectrometry
Introduction
Rizatriptan (RIZA) [N, N-dimethyl-2–(5-(1, 2, 4-triazole- 1-ylmethyl)-1H-indol-3-yl) ethylamine] is a selective 5-hydroxytryptamine (5-HT 1B/1D) receptor agonist and is considered as a first-line treatment option in the management of migraine [1- 4]. Rizatriptan has a greater affinity for the 5-HT 1B/1D receptor, which exhibits superior pharmacodynamic and pharmacokinetic properties compared to an endogenous neurotransmitter, serotonin [5]. The 10 mg dose of rizatriptan provided faster pain relief than sumatriptan 50 mg, naratriptan 2.5 mg, and zolmitriptan 2.5 mg while displaying similar tolerability, RIZA may relieve migraine headache by decreasing the release of pro-inflammatory neuropeptides [1,4]. The apparent mechanism of action of RIZA is done through activation of postsynaptic 5-HT 1B receptors within cerebral and dural vessel walls, causing vasoconstriction and inhibition of trigeminal peri-vascular nerve terminals [6]. After the administration of a normal single oral 10 mg clinical dose, the plasma concentration of rizatriptan was less than 40 ng/mL [7], hence a highly sensitive method that allows accurate quantitation of rizatriptan in plasma with a low limit of detection is required. Quantification of the low levels of rizatriptan in plasma by previously described analytical methods using HPLC assay coupled with ultraviolet and mass spectrometry [3,7-11] have proven to be a complex effort. Nevertheless, these methods have low sensitivity, longer run time, tedious extraction procedures, and are expensive to perform clinical studies.
Carryover is one of the most commonly encountered problems of the LC-MS/MS method with highly sensitive detectors [12,13]. Carryover during an analytical run can affect the precision and reliability of an analytical method. The major sources of carryover are autosampler, column type, and capillary fittings [12,14-17]. Therefore, we aimed to develop and validate a highly sensitive, simple, accurate, and precise LC-MS/MS method for the quantification of rizatriptan in human plasma.
Material and Methods
Materials and reagents
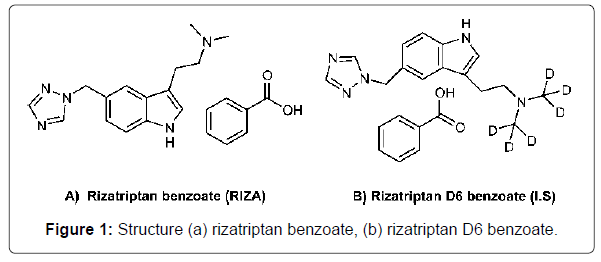
The working standard of rizatriptan benzoate (Figure 1a, purity 99.3%) was obtained from Unichem Laboratories Ltd, (India). Rizatriptan D 6 benzoate (purity 93.47%) was procured from Clearsynth labs (Mumbai, India) as shown in Figure 1b. MS grade methanol, isopropyl alcohol (IPA), and ammonium formate were procured from Rankem (Delhi, India). Water was obtained by double distillation and purified additionally with a Milli-Q system (Bedford, USA). Bond Elut Plexa 30mg, 1mL solid-phase extraction cartridges were procured from Agilent technologies (Santa Clara, USA). Blank human plasma containing K 2EDTA as an anticoagulant was procured from Mediplas laboratories (Hyderabad, India) and stored at -20. All reagents and solvents were of analytical grade.
Instrumentation and LC-MS/MS conditions
The chromatographic separation was performed on Shimadzu liquid chromatography system (Kyoto, Japan) consisted of quaternary pump LC-20AD, thermostated autosampler SIL-HCT, degasser DGU- 20A 3, and column oven CTO-20A. The separation was carried out at 40 by automated injection of a 10 μL sample on a C 18 hypurity advance column (150 × 4.6 mm, 5 μm; Thermo Scientific, Waltham, USA) with a run time of 3.0 minutes. The mobile phase consisted of methanol-5 mM ammonium acetate solution-formic acid (80:20:0.1, v/v/v) with a flow rate of 1 mL/minute.
The LC system was coupled with API 4000 triple quadrupole instrument (AB-SCIEX, Toronto, Canada) using multiple reaction monitoring (MRM). An electrospray interface was used in positive mode. The instrument parameters for monitoring rizatriptan and the internal standard (I. S) during sample analysis were summarized in Table 1. Data processing was performed on the analyst version 1.5 software package (SCIEX).
| HPLC Autosampler Parameters | Value |
|---|---|
| Rinsing volume (µL) | 350 |
| Needle stroke (mm) | 52 |
| Rinsing speed (µL/sec) | 35 |
| Purge time (min) | 1 |
| Rinse dip time (sec) | 5 |
| Rinse mode | Before and after aspiration |
| Mass spectrometry Parameters | Value |
| Source temperature (˚C) | 500 |
| Dwell time per transition (ms) | 300 |
| Ion source gas (Gas 1, psi) | 30 |
| Ion source gas (Gas 2, psi) | 60 |
| Curtain gas (psi) | 45 |
| Collision activated dissociation (CAD) | 6 |
| Ion spray voltage (V) | 5000 |
| Entrance potential (EP, V) | 10 |
| Declustering potential (DP, V) | 51 |
| Collision energy (CE, V) | 19 |
| Collision cell exit potential (CXP, V) | 18 (RIZA), 4 (I.S) |
| Mode of analysis | Positive |
| Ion transition for RIZA (Q1/Q3, m/z) | 270.24/201.10 |
| Ion transition for I.S (Q1/Q3, m/z) | 276.21/207.20 |
Table 1: Optimized HPLC autosampler rinsing mode, system and compound parameters of RIZA mass spectrometry method.
Calibration standards and quality control samples preparation
Primary stock solutions of approximately 1 mg/mL were prepared separately for calibration curve standard (CC) and quality control (QC) samples in a diluent solution of water: methanol (1:1) and stored at 2-8. The internal standard working solution (100 ng/mL) was prepared by diluting its stock solution (1mg/mL) with the diluent solution. In the validation process, each run comprised of calibration standards and quality control samples, which were spiked with RIZA in screened and drug-free plasma in the range of 0.151- 52.170 (ng/mL). The QC samples were lower limit of quality control (LLQC- 0.153 ng/mL), low quality control (LQC- 0.450 ng/mL), medium quality control (MQC- 21.825 ng/mL) and high quality control (HQC- 43.650 ng/mL). These QC and CC samples were prepared in plasma and stored at -20 until they were used.
Calibration curve
A calibration curve was constructed from a blank sample (a plasma sample processed without an I. S and RIZA), a zero sample (a plasma processed with I. S), and eight non-zero samples in the total range (0.151- 52.170 ng/mL).
The regression model was finalized based on the analysis of three calibration curves from precision and accuracy (PA) batches of the validation. The linear regression with or without the weighting factors (1/×, 1/×2, and none) were evaluated by comparing accuracy (% nominal) data, which is summarized in Table 2. The best linear fit and least squares regression for the calibration curve was achieved with a 1/×2 weighting factor with a correlation coefficient (r 2) greater than 0.999. The acceptance criterion for each back-calculated standard concentration was within ± 15% except the lower limit of quantification (LLOQ) which was ± 20% deviation from the nominal [18] as shown in Table 3.
| Calibration standards (CS) | Spiked plasma concentration (ng/mL) | Measured concentration (ng/mL, mean ±SD) | % CV | % Accuracy |
|---|---|---|---|---|
| CS1 | 0.151 | 0.154 ±0.005 | 3.1 | 102.2 |
| CS2 | 0.303 | 0.289 ±0.019 | 6.5 | 95.3 |
| CS3 | 2.162 | 2.247 ± 0.018 | 0.8 | 103.9 |
| CS4 | 10.809 | 11.142 ± 0.294 | 2.6 | 103.1 |
| CS5 | 21.618 | 22.017 ± 0.143 | 0.6 | 101.8 |
| CS6 | 33.259 | 32.580 ± 0.281 | 0.9 | 98 |
| CS7 | 44.345 | 42.75 ±0.175 | 0.4 | 96.4 |
| CS8 | 52.17 | 51.909 ± 0.429 | 0.8 | 99.5 |
| Weighing factor | None | 1/x | 1/x 2 | |
| PA batch-1 | 272.5 | 11.3 | 7.5 | |
| PA batch-2 | 297.9 | 12.4 | 11.1 | |
| PA batch-3 | 286.5 | 12.9 | 12.6 | |
| Mean square regression | 285.6 | 12.2 | 10.4 | |
Table 2: Precision and accuracy of back calculated concentrations of calibration standards (n = 3) and calibration model (linear least squares regression analysis) for RIZA in human plasma.
| Quality control sample (QC) | Concentration nominal (ng/mL) | Precision (% CV) | Accuracy (%) | ||
|---|---|---|---|---|---|
| Within batch (n=6) | Between batch (n=18) | Within batch (n=6) | Between batch (n=18) | ||
| LLQC | 0.153 | 5.5 | 8.9 | 95 | 101.4 |
| LQC | 0.45 | 3.7 | 3.4 | 97.1 | 95.2 |
| MQC | 21.825 | 1 | 3 | 102.1 | 98.7 |
| HQC | 43.65 | 1.4 | 3 | 99.0 | 95.7 |
Table 3: Precision and accuracy of back calculated concentrations of quality control samples for RIZA in human plasma.
Extraction procedure
All frozen samples and standards were thawed at room temperature (25) and homogenized by vortexing. A 300 μL aliquot of each plasma sample was taken into polypropylene vial and added 50 μL of internal standard solution (100 ng/mL), vortexed and added 300 μL of water, vortexed again to mix well. The preconditioned Bond Elut Plexa cartridges with 1 mL of methanol followed by 1mL water were placed in solid-phase extraction assembly (Orochem technologies, Naperville, USA). The entire sample was loaded and passed through the cartridges under constant pressure and washed with 1 mL of water twice and eluted out with 1 mL of methanol. The eluted methanol was then dried in a nitrogen evaporator (Caliper life sciences, Hopkinton, USA) at 50 at 20 psi to complete dryness. The residue was reconstituted with 1.0 mL of mobile phase and transferred into auto-sampler vials.
Results and Discussion
LC-MS/MS method development
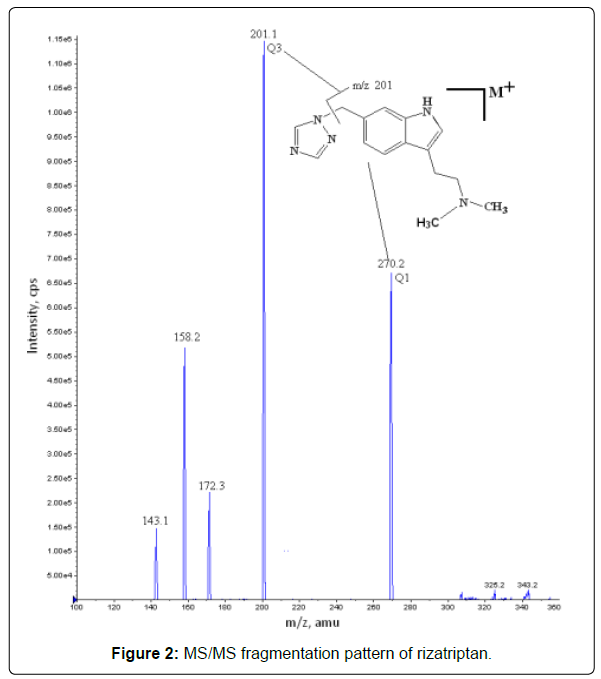
To find the most sensitive ionization mode for the rizatriptan both positive and negative ion ESI models were tested with various combinations of the mobile phase modifiers. Isotopic labeled rizatriptan D 6 was selected as the internal standard. Both the analyte and internal standard showed a very high tendency to accept protons and generate [M+H]+ ions in positive ion mode. The protonated parent ions for RIZA and I. S were observed at m/z 270.24 and 276.21 respectively. The analyte and internal standard were then fragmented in collision cell and the fragments were selected at m/z 201.24 and 207.20 as most prominent and stable fragments for RIZA and I. S, respectively as shown in Figure 2.
Several column types and mobile phases consisting of water-methanol or water–acetonitrile were evaluated to improve chromatographic separation and enhance sensitivity in MS. Modifiers such as formic acid/acetic acid and ammonium formate/acetate alone or in combination in different concentrations were added. The formic acid was found to be necessary to lower the pH to protonate the RIZA to produce a good peak shape. A high purity advance C 18 column (4.6×150 mm, 5.0 μm; Thermo Scientific, Waltham, USA) with a mobile phase consisting of 5 mM ammonium acetate-methanol-formic acid (80:20:0.1, v/v/v) at a flow rate of 1.0 mL/min provided the best cooperation between selectivity, sensitivity, and reproducibility.
Carryover minimization
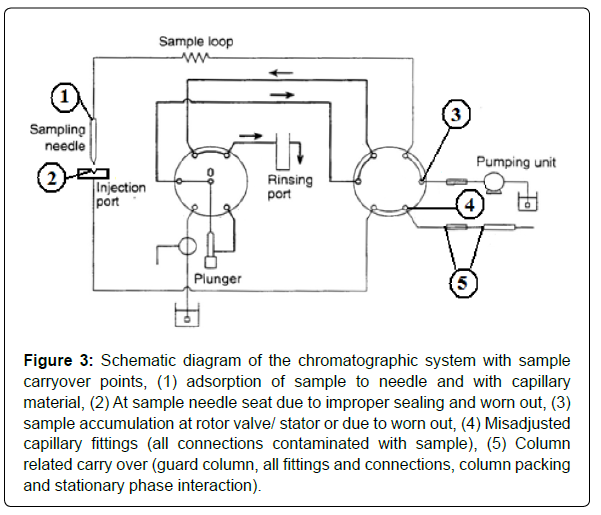
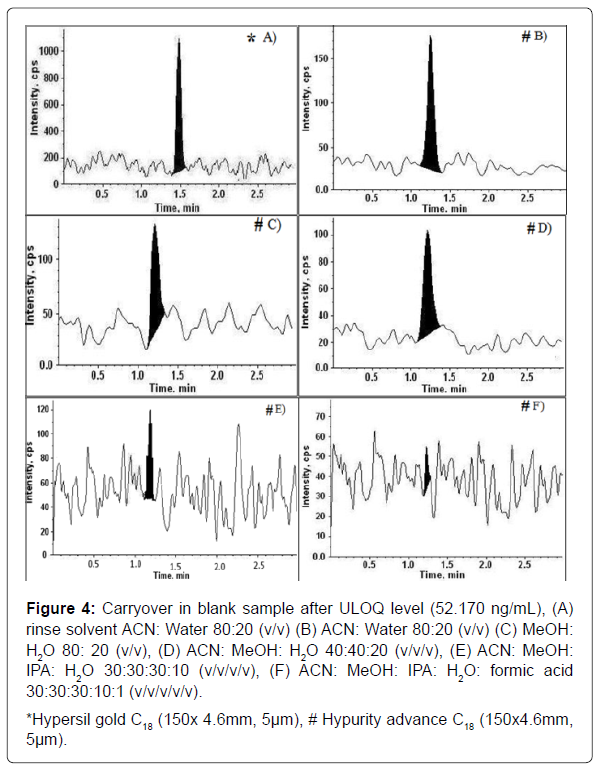
When analytes from a sample injection into an LC system are not completely flushed from the sample introduction hardware, valve, and connections following the injection, a carryover effect can be seen in subsequent injections of blank samples [14]. A schematic diagram of the chromatographic system with carryover points is shown in Figure 3. To minimize the system carryover during an analytical run is essential for precise and reliable data. Instrument carryover is mostly associated with the interaction of an analyte with the flow path components of the system [17]. There is a close relationship between the chemical or physical nature of both the analyte and the analysis system. Analysis of extremely basic and hydrophobic compounds can be particularly problematic because they tend to be present in a charged form and to adsorb to the sample path of an autosampler through ionic interaction with metallic surfaces and hydrophobic interaction with plastic materials. One of the best ways to minimize system carryover is optimizing the system rinse solvent. Rinse solvent chemistry has a massive impact to counteract carryover. Acetonitrile is the choice of rinse solvents to remove analyte adsorbed by hydrophobic interaction (lipophilic compounds) and methanol is a more protic solvent alternative for more polar lipophilic compounds. Acidified acetonitrile, alkalized acetonitrile, and a combination of methanol/isopropanol/ water solution are quite efficient and are universally used to dissociate analyte adsorption caused by dipole-dipole and ionic interaction (hydrophilic compounds). For the analytes that are hard to dissolve in common solvents (methanol, acetonitrile, and water) strong solvents such as tetrahydrofuran, dimethylsulfoxide, and halo hydrocarbon (methylene chloride) can be used. RIZA was shown to have a strong carryover with the chromatographic system. Various combinations of these rinse solvents and different columns were tested to minimize carryover. The carryover minimization is shown in Figure 4.
Figure 3: Schematic diagram of the chromatographic system with sample carryover points, (1) adsorption of sample to needle and with capillary material, (2) At sample needle seat due to improper sealing and worn out, (3) sample accumulation at rotor valve/ stator or due to worn out, (4) Misadjusted capillary fittings (all connections contaminated with sample), (5) Column related carry over (guard column, all fittings and connections, column packing and stationary phase interaction).
*Hypersil gold C18 (150x 4.6mm, 5μm), # Hypurity advance C18 (150x4.6mm, 5μm).
Figure 4: Carryover in blank sample after ULOQ level (52.170 ng/mL), (A) rinse solvent ACN: Water 80:20 (v/v) (B) ACN: Water 80:20 (v/v) (C) MeOH: H2O 80: 20 (v/v), (D) ACN: MeOH: H2O 40:40:20 (v/v/v), (E) ACN: MeOH: IPA: H2O 30:30:30:10 (v/v/v/v), (F) ACN: MeOH: IPA: H2O: formic acid 30:30:30:10:1 (v/v/v/v/v).
Extraction method development
We opted out of various methods for sample extraction with solid-phase extraction, liquid-liquid extraction, and protein precipitation. Among these, solid-phase extraction was found to be very useful due to minimal baseline noise and interference, which produced a clean plasma extract with an appropriate sensitivity at LLOQ level (0.151ng/ mL) and the method, was applicable for clinical studies as per regulatory consideration. The interference of plasma and processing material was initially observed which was removed after washing twice with water. Elution of RIZA from cartridge was done by methanol, yielding near to 80% recovery of rizatriptan which indicates that the method was good in terms of recovery with consistent sensitivity.
Extraction Recovery
The extraction recovery was determined in six replicates by comparing the mean peak areas of extracted low (LQC), medium (MQC), and high (HQC) quality control samples to mean peak areas of standard solutions spiked in the mobile phase at the same concentrations. Recovery of I. S was evaluated by comparing the mean peak areas of I. S in extracted medium quality control samples to mean peak areas of standard solutions of I. S spiked in the mobile phase of the same concentration.
Recoveries of RIZA at LQC, MQC, and HQC levels were 79.7, 82.3, and 79.4% respectively, while recovery of rizatriptan D 6 was 65.6%. This shows the method has the consistent, precise, and reproducible recovery of rizatriptan from human plasma.
Limit of quantification (LLOQ)
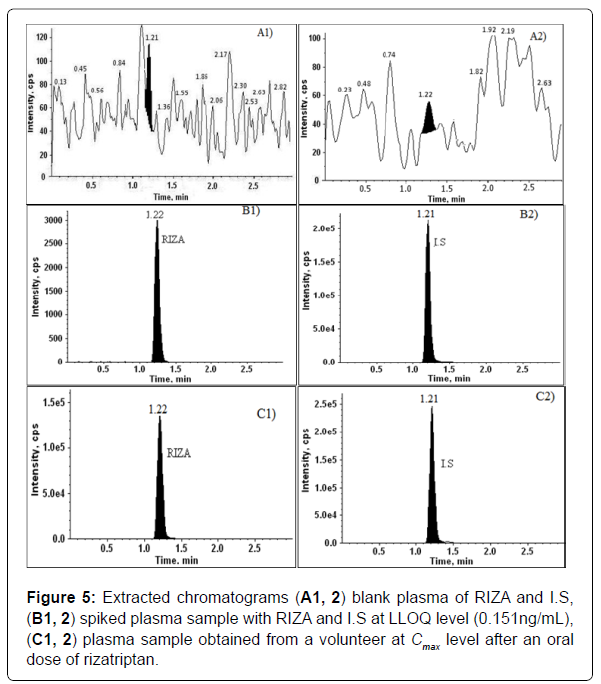
The limit of quantification was estimated by the baseline noise method. The lower limit of quantitation was 0.151 ng/mL with a signal-to- noise ratio (S/N) of more than 10 and the relative standard deviation was less than 15%. The Limit of quantification was experimentally performed by six injections of rizatriptan at LLOQ (0.151 ng/mL) concentration level. Chromatograms of RIZA and rizatriptan D 6 are as shown in Figure 5.
Selectivity and specificity
Selectivity and specificity of the extraction method were assessed by the screening of two haemolysed, two lipemic, and 10 different lots of drug-free human plasma, which did not contain any interference of plasma components or other sources at the retention time of the RIZA and I. S when compared to LLOQ (0.151 ng/mL) concentration level. It was shown that the method was highly specific and selective for rizatriptan.
Carryover
A carryover test was performed to check the significant interference at the retention time (RT) of analyte is being generated in an injection due to improper clearance of analyte from the previous injection that leads to carryover [19,20]. When aqueous (AQS) and extracted (EXT) blank samples were injected right after the highest level (52.17 ng/mL) of the analyte sample, no significant carryover was observed as shown in Table 4.
| Sample Name | Area of RIZA | % Carryover against EXT LOQ | % Carryover against AQS and EXT ULOQ |
|---|---|---|---|
| AQS blank -1 | 0 | 0 | - |
| AQS ULOQ-1 | 2538853 | - | - |
| AQS blank-2 | 329 | 4.8 | 0 |
| AQS ULOQ-2 | 2480286 | - | - |
| AQS blank-3 | 153 | 2.2 | 0 |
| AQS blank-4 | 0 | 0 | 0 |
| AQS blank-5 | 103 | 1.5 | 0 |
| EXT blank-1 | 119 | 1.7 | - |
| EXT LOQ-1 | 7117 | - | - |
| EXT LOQ-2 | 6288 | - | - |
| EXT ULOQ-1 | 2353575 | - | - |
| EXT blank-2 | 88 | 1.3 | 0 |
| EXT ULOQ-2 | 2327125 | - | - |
| EXT blank-3 | 275 | 4 | 0 |
| EXT blank-4 | 148 | 2.2 | 0 |
| EXT blank-5 | 67 | 1 | 0 |
Table 4: Assessment of carryover in both aqueous and plasma extracted (EXT) samples of RIZA in human plasma.

Matrix effect
The matrix effect in the LC-MS/MS method was evaluated by spiking blank plasma extracts with low and high QC samples. Six independent plasma lots, two haemolysed, and two lipemic plasma lots were used [21]. The quantitative measure of matrix effect is termed as matrix factor (MF), defined as a peak area ratio of analyte to internal standard in the presence of matrix ions to mean peak area ratio of analyte to I. S in the absence of matrix ions [22]. The effect of the matrix on the estimation of the drug is negligible and is shown in Table 5.
| Plasma Lot | LQC level (0.45 ng/mL) | HQC level (43.65 ng/mL) |
|---|---|---|
| Lot-1 | 0.937 | 0.993 |
| Lot-2 | 0.995 | 1.017 |
| Lot-3 | 0.996 | 1.025 |
| Lot-4 | 0.878 | 0.997 |
| Lot-5 | 0.907 | 1.006 |
| Lot-6 | 0.937 | 0.992 |
| Lot-7 (haemolysed) | 0.849 | 1.002 |
| Lot-8 (haemolysed) | 0.937 | 0.995 |
| Lot-9 (lipemic) | 0.878 | 1.005 |
| Lot-10 (lipemic) | 0.907 | 1.011 |
| Mean MF | 0.9263 | 1.0031 |
| SD | 0.03327 | 0.01199 |
| CV% | 3.6 | 1.2 |
Table 5: Assessment of matrix effect at LQC and HQC levels of RIZA (n=2) in 10 lots of human plasma.
Accuracy and precision
The within and between batches precision and accuracy of the developed method was assessed by determining QC samples at four different concentration levels (0.151, 0.450, 21.825, 43.650 ng/mL), each with six replicates per run, for three consecutive runs. The QC samples were prepared and analyzed together with the calibration samples. The accuracy (% nominal) for RIZA within a batch (n=6) and between batches (n=18) were reported to be in the range of 93.4- 111.3% and 95.2-101.4%, respectively, while the%CV within the batch and between batches was reported to be in the range of 1.0-5.5% and 3.0-8.9% respectively, and are presented in Table 3.
Dilution integrity
DIQC (dilution integrity quality control) samples were prepared and diluted 2 and 4 times with blank plasma matrix [13,23], the% accuracy of DIQC samples at 2 and 4 times dilution was found to be 90.4 and 93.7%, respectively, and the%CV was reported to be 1.1 and 0.7%, respectively. The integrity of dilution was found to be within the accepted range ± 15%.
The experiment was intended to validate the dilution test to be carried out on higher analyte concentrations (above ULOQ) which may be encountered during real subject samples analysis. Such samples are supposed to be diluted with blank human plasma to achieve appropriate concentrations within the calibration curve range. The experiment was carried out at a two-fold higher concentration of ULOQ and was diluted with blank human plasma by dilution factors 2 and 4.
Ruggedness
The ruggedness of the extraction procedure and chromatographic method was evaluated by analysis of six sets of QC samples and a set of calibration standards using a different column of the same type by a different analyst. The accuracy (% nominal) and the precision (% CV) within the batch for RIZA were reported to be in the range of 104.6-113.4% and 3.3-5.1% respectively. The values reported above for RIZA indicate that the method may be used under slightly different conditions.
Stability
The stability of the analyte in human plasma under different temperatures and timing conditions was evaluated and the results of the stability studies are enumerated in Table 6. QC samples were subjected to long-term storage conditions (-20) to freeze-thaw stability studies. All the stability studies were assessed at low and high QC levels [21] (n=4), by comparing the mean value of the stability QC samples at each level with the mean value of the same QC samples pooled freshly.
| Storage condition | Sample | Conc. (ng/mL) | (Mean ±SD) (ng/mL) |
CV (%) | Stability (%) |
|---|---|---|---|---|---|
| Bench top stability (6.05 hrs) | LQC | 0.450 | 0.432 ± 0.008 | 1.9 | 100.4 |
| HQC | 43.650 | 39.964 ± 0.606 | 1.5 | 94.0 | |
| Bench top extraction stability | LQC | 0.450 | 0.424 ± 0.009 | 2.2 | 97.6 |
| HQC | 43.650 | 39.659 ± 1.377 | 3.5 | 99.9 | |
| Long term stability (90 days) | LQC | 0.450 | 0.473 ± 0.008 | 1.7 | 105.0 |
| HQC | 43.650 | 43.297 ± 0.273 | 0.6 | 101.5 | |
| Freeze thaw stability (after 3 cycle) | LQC | 0.450 | 0.435 ± 0.005 | 1.1 | 103.2 |
| HQC | 43.650 | 39.299 ± 1.227 | 3.1 | 97.5 | |
| In injector stability (10 ˚C) (75.63 hrs) | LQC | 0.450 | 0.431 ± 0.021 | 4.9 | 95.8 |
| HQC | 43.650 | 40.139 ± 1.490 | 3.7 | 102.8 | |
| Refrigerator (9 days, 2-8 ˚C) | stock solution stability | 100.6 | |||
| Room temperature (29.20 hr, 25 ˚C) | stock solution stability | 101.5 | |||
Table 6: Stability of RIZA in human plasma (n=4).
These results allowed us to conclude that processed samples were stable for 75.73 hrs at 10°C in the autosampler. For benchtop stability, the results allowed us to conclude that the analyte was stable for 6.43 hrs at room temperature in plasma samples. Freeze and thaw stability results indicated that the repeated freeze and thawing (three cycles) did not affect the stability of rizatriptan. Benchtop extraction stability signified that the analyte was stable in different intermediate steps of the extraction procedure and the long-term stability of the analyte in plasma at -20 showed the analyte was stable for at least 90 days.
Application of the method in the analysis of plasma from a human volunteer
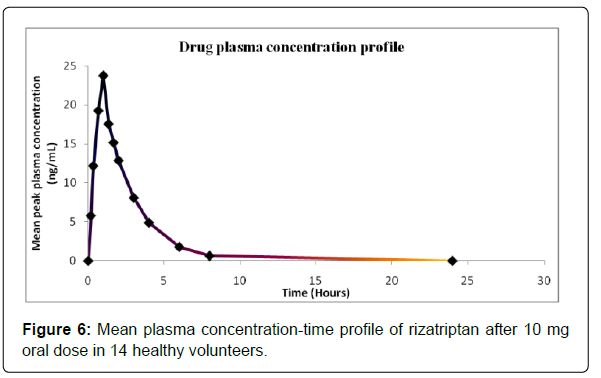
The validated method has been successfully used to quantify the RIZA concentration in human plasma samples after the oral administration of a single dose of 10 mg rizatriptan tablet. The mean plasma concentration-time profile for 14 healthy subjects is presented in Figure 6.
Conclusion
The LC-MS/MS method for the determination of RIZA concentrations in human plasma was developed and validated over a concentration range of 0.151-52.170 ng/mL. This method has significant advantages over the other reported methods, in terms of clean and reproducible SPE extraction procedure with a shorter chromatographic run time (3 min). The extraction method gave consistent and reproducible recoveries for analyte and I. S from plasma, with minimum interference and matrix enhancement. Due to the high sensitivity of the method requires a minimum volume of plasma (300 μL) that greatly facilitates blood sample collection. The developed method was fully validated as per FDA guidelines and successfully applied to evaluate the plasma concentrations of RIZA in healthy human volunteers.
Conflicts of Interest
There are no conflicts of interest.
Acknowledgments
The authors are thankful to all research associates of Fortis clinical research limited (Haryana, India) for their appreciative help to achieve our goal. We also acknowledge Anil Panwar, chief executive officer, Fortis clinical research limited for his constant encouragement and support towards the research.
References
- Chen Y, Miao H, Lin M, Fan G, Hong Z, et al. (2006) Development and validation of a selective and robust LC-MS/MS method for high-throughput quantifying rizatriptan in small plasma samples: application to a clinical pharmacokinetic study. J Chromatogr B Analyt Technol Biomed Life Sci 844:268-277.
- Cumberbatch MJ, Hill RG, Hargreaves RJ (1997) Rizatriptan has central antinociceptive effects against durally evoked responses. Eur J Pharmacol 328:37-40.
- Mogili R, Kanala K, Challa B, Chandu B, Bannoth C (2011) Determination of Rizatriptan in Human Plasma by Liquid Chromatography Stable Isotope Dilution Electrospray MS–MS for Application in Bioequivalence Study. Chromatographia 74:585-592.
- Velusamy S, Masimukku V, Chereddy S, Jadapalli JK, Palur K, et al. (2013) Bioanalytical method development and validation of rizatriptan in human plasma using LC–MS/MS method. Int J Chemical Analytical Sci 4:108-114.
- Vyas KP, Halpin RA, Geer LA, Ellis JD, Liu L, et al. (2000) Disposition and pharmacokinetics of the antimigraine drug, rizatriptan, in humans. Drug Metab Dispos 28:89-95.
- Bressolle F, Bromet-Petit M, Audran M (1996) Validation of liquid chromatographic and gas chromatographic methods applications to pharmacokinetics. J Chromatogr B Biomed Appl 686:3-10.
- Chen J, Jiang X, Jiang W, Mei N, Gao X, et al. (2004) Liquid chromatographic method for the determination of rizatriptan in human plasma. J Chromatogr B Analyt Technol Biomed Life Sci 805:169-173.
- Barrish A, Olah TV, Gatto GJ, Michel KB, Dobrinska MR, et al. (1996) The use of stable isotope labeling and liquid chromatography/tandem mass spectrometry techniques to study the pharmacokinetics and bioavailability of the antimigraine drug, MK-0462 (rizatriptan) in dogs. Rapid Commun Mass Spectrom 10:1033-1037.
- Patel DS, Sharma N, Patel MC, Patel BN, Shrivastav PS, et al. (2012) Application of a Reliable LC-MS/MS Method for Determination of Rizatriptan in Healthy Subject Samples: Demonstration of Assay Reproducibility by Incurred Sample Reanalysis. ISRN Chromatography 2012:10.
- Guo JF, Zhang AJ, Zhao L, Sun XH, Zhao YM, et al. (2006) Determination of rizatriptan in human plasma by liquid chromatographic-eletrospray tandem mass spectrometry: application to a pharmacokinetic study. Biomed Chromatogr 20:61-66.
- Wang C, Quan LH, Guo Y, Liu CY, Liao YH (2007) Uptake and biodistribution of rizatriptan to blood and brain following different routes of administration in rats. Int J Pharm 337:155-160.
- Asakawa Y, Ozawa C, Osada K, Kaneko S, Asakawa N (2007) Reduction of carry-over in column-switching HPLC/MS system with automated system washing procedure for highly sensitive direct analysis of donepezil in dog plasma. J Pharm Biomed Anal 43:683-690.
- Joshi P, Rao S, Singh M, Vig N, Singh AK, et al. (2013) A sensitive LC-ESI-MS/MS method for the quantification of low concentrations of buspirone in human plasma. Analytical Methods 5:7014-7021.
- Pfannkoch EA, Foster FD, Stuff JR (2008) Minimizing Carryover Using a Four Solvent Wash Station. Gerstel, Global analytical solutions, USA, pp:1-10.
- Saha M, Giese RW (1993) Primary contribution of the injector to carryover of a trace analyte in high-performance liquid chromatography. J Chromatogr 631:161-163.
- Dolman S, Eeltink S, Vaast A, Pelzing M (2013) Investigation of carryover of peptides in nano-liquid chromatography/mass spectrometry using packed and monolithic capillary columns. J Chromatogr B Analyt Technol Biomed Life Sci 912:56-63.
- Hughes NC, Wong EY, Fan J, Bajaj N (2007) Determination of carryover and contamination for mass spectrometry-based chromatographic assays. AAPS J 9:353-360.
- https://www.federalregister.gov/documents/2001/05/23/01-12908/guidance-for-industry-on-bioanalytical-method-validation-availability
- Srikanth CH, Joshi P, Bikkasani AK, Porwal K, Gayen JR (2014) Bone distribution study of anti leprotic drug clofazimine in rat bone marrow cells by a sensitive reverse phase liquid chromatography method. J Chromatogr B Analyt Technol Biomed Life Sci 960:82-86.
- Devalapalli MMR, Cheruvu HS, Yertha T, Veeravalli VB, Sampathi S, et al. (2017) Hansen solubility parameters for assay method optimization of simvastatin, ramipril, atenolol, hydrochlorothiazide and aspirin in human plasma using liquid chromatography with tandem mass spectrometry. J Sep Sci 40:3662-3674.
- Blume H, Brendel E, Brudny-Kloppel M, Grebe S, Lausecker B, et al. (2011) Workshop/conference report on EMA draft guideline on validation of bioanalytical methods. Eur J Pharm Sci 42:300-305.
- Srikanth CH, Chaira T, Sampathi S, Sreekumar V, Bambal RB (2013) Correlation of in vitro and in vivo plasma protein binding using ultracentrifugation and UPLC-tandem mass spectrometry. Analyst 138:6106-6116.
- Hasnain MS, Rao S, Singh MK, Vig N, Gupta A, et al. (2013) Development and validation of LC-MS/MS method for the quantitation of lenalidomide in human plasma using Box-Behnken experimental design. Analyst 138:1581-1588.
Citation: Joshi P, Cheruvu HS, Vig N, Ansari A, Singh P (2021) Development and Minimizing the Carryover of A Sensitive and High Throughput LC–ESI-MS/MS Method for the Quantification of Rizatriptan in Human Plasma and Its Application in a Clinical Trial. Clin Pharmacol Biopharm, 10: 231.
Copyright: © 2021 Joshi P, et al. This is an open-access article distributed under the terms of the Creative Commons Attribution License, which permits unrestricted use, distribution, and reproduction in any medium, provided the original author and source are credited.
Share This Article
Recommended Journals
Open Access Journals
Article Usage
- Total views: 2331
- [From(publication date): 0-2021 - Apr 02, 2025]
- Breakdown by view type
- HTML page views: 1602
- PDF downloads: 729

