Determination of Organochlorine Pesticides in Sediments Using Gas Chromatography and Mass Spectrometry
Received: 03-Oct-2017 / Accepted Date: 17-Oct-2017 / Published Date: 20-Oct-2017 DOI: 10.4172/2155-9872.1000383
Abstract
Seventeen Organochlorine Pesticides (OCPs) were evaluated in 14 surface sediment samples from a dam lake in Northwestern Turkey. As analytical tool GC-Mass system; HP (Hewlett Packard) 6890 series gas chromatograph coupled with HP 5973 mass spectrometer was used. The HP 5MS capillary column had 30 m length with 0.32 mm internal diameter. A 0.25 mm film thickness cross-linked with stationary phase of 5% Phenyl methyl siloxane and Ultra-pure Helium gas was used as mobile phase. Ultrasonic bath extraction method was applied and cleaned up process were carried up with anhydrous Na2SO4 and Florisil column. Total pesticides concentrations were ranged from=0.237-2.39 mg/kg for dry weıght. Percent total organic carbon (TOC) were observed between 1 and 3%. Average total OCP concentrations was 58.00 ± 45.44 mg/kg. The total concentrations of OCPs in sediment samples ranged from 12.9 to 169.9 mg/kg, with a mean value of 58.00 mg/kg. Although organochlorine pesticides have been banned in Turkey still the residues can be seen in sediment samples indicating the use of prohibited pesticides in the country. Comparison of organochlorine pesticides concentrations in sediment samples with other lakes in Turkey implies the higher concentration therefore higher usage of synthetic chemicals.
Keywords: Organochlorine pesticides; Persistent organic pollutants; Gas chromatography-mass spectrometry; Pollutants
Introduction
The concerened about OCPs on environment and human health rised up last four decades. The Stockholm Convention on persistent organic pollutants (POPs) ratified by many countries in order to reduce the use of OCPs [1]. In the period of 1940s-1980s a wide range of application seen in the field of agriculture, domestic and public health sectors [2,3]. The OCPS residues are still seen due to their high photochemical, biological and chemical resistance to degradation in the environment [4]. OCPs are toxic, environmentally persistent and able to undergo long range environmental transport [5-8]. Organochlorine pesticides are commonly classified in persistent organic pollutants as a result of high chemical stability, poor water solubility and low vapor pressures in the environment [9]. Due to higher hydrophobicity, OCPs can adsorb to sedimentary surfaces which leds to accumulate in estuaries and lakes [10], and they may be transferred to food chain. These synthetic chemicals are banned by many countries starting from 1970s and still are used in some developing countries [11]. Turkey signed the Stockholm Convention on Persistent Organic Polluters in 2001 in order to provide the withdrawal and reduction of the releases of some organochlorine pesticides including DDT, aldrin, endrin, dieldrin, heptachlor and hexachlorobenzene [12]. However, these pollutants still exist in the environment of Turkey [13,14] Distribution and sources of organochlorinated contaminants in sediments from Izmir Bay [15]. The studies on pesticides residue are elevating in Turkey day by day. Some of these researches are conducted with the samples from central Anatolia [16], along the coast of mid Black Sea [17], from Uluabat Lake [18], from Meriç Delta [19]. The results show a different variation due to different times and different places, vary in terms of concentration.
Pesticide usage has soared in past decades around the world, 21 different types of organophosphates, organochlorines and carbamates insecticides available in the market to boost agricultural production and combat disease are banned [20]. Some researches on pesticides have estimated the potential risk to human health [21-25] which arised from the consumption of pesticide contaminated food in dietary intake. The nondietary exposures of pesticides effects should also be researched. Model studies should be conducted to understand the risks which include the chronic daily intake (CDI) [26].
Experimental
Study area and sampling
Bal?kesir is among one of the cultivated area in Turkey. Agricultural activities are high and the sources of income are from olive production. Besides cereals, sugar beets, tomatoes, melons and cotton. The farmer is trying their best to increase the yield and the over use of pesticides is unavoidable. The study area which is a dam lake called ?kizcetepeler, was an agricultural field before the dam was constructed in 1991. The dam lake water is major source for drinking and irrigation. ?kizcetepeler Reservoir, is only 25 km far away from the city center. The area is under the influence of the urban pollution. The dense traffic on Bal?kesir?zmir- Bursa link highway passing near the dam lake, and the industrial zone of the city pollute the dam lake. Figure 1 shows the sampling area and the Geographical Positioning System (GPS) image of the Dam Lake. The dam lake should be under controlled since the water is used for drinking and irrigation. The sampling was done by grids of 0.123 km2 and total 44 sampling points were determined. Fourteen samples were used for OCPs determination to figure out the OCP pollution distribution. The samples were collected by Van Veen grab sampler, an amount of 200-500 grams collected and were stored in a refrigerator at -20°C in nylon bags, dark medium was preferred to prevent the samples from the sunlight.

Figure 1: The sampling area and the GPS image of the Dam Lake.
Materials And Methods
All the solvents and standards used in the experiments were extra pure analytical grade. The organochlorine pesticide standards (EPA Method 508-Chlorinated Pesticide Mix 1, 1000 μg/ml), internal standards (Accustandard, Pentachloronitrobenzene, 1.0 mg/ml) and surrogate standards (2,4,5,6-Tetrachloro-m-xylene, 10 ng/μl and Decachlorobiphenyl, 0.5 mg/ml) were purchased from Dr. Ehrenstorfer (Ausburg, Germany. Standard reference materials (SRM 2261 and SRM 2275) were purchased from National Institute of Standards (NIST).
The materials used for the extraction were cleaned. The sodium sulfate, Florisil were pre-cleaned with hexane and acetone solvents by passing through glass column and then they were conditioned in an oven at 400°C for 4 h. For column packing glass wool was used, it was pre-cleaned with hexane and acetone then were conditioned overnight in an oven at 200°C.
All of the glassware used in laboratory were cleaned with Alconox detergent (Supelco) in hot water and deionized water. They were left to dry in an oven after rinsing with hexane and acetone at 100°C.
Analytical procedures
Sediments samples are dried in room condition and grinned with mortar. Two grams of sediment samples were weighed in an amber glass bottle with Teflon cap and 100 μL of 1.0 μg/L surrogate standards (2,4,5,6 Tetrachloro-m-xylene and Decachlorobiphenyl) were added. Sixty milliliters of hexane:acetone mixture (3:1) was added to the bottle and closed for ultrasonic bath extraction for two hours. Then, the extracts were firstly eluted through Na2SO4 column to eliminate the water moisture and then cleaned up with Florisil column to remove the polar compounds that interfere with the analytes. The mixture was evaporated with rotary evaporator and 100 μL internal standard (Pentachloronitrobenzene) having a concentration of 0.5 μg/L was added. The final solution was pre-concentrated to 1 mL with a minivap evaporator under pure nitrogen gas and taken into a 2 ml amber glass vial and kept in refrigerator at 4°C before the analysis with GC-MS [27].
Surrogate standards, internal standards and standard reference materials were used for Quality assurance /Quality control studies. An HP (Hewlett Packard) 6890 series gas chromatograph coupled with HP 5973 mass spectrometer was used for the analysis. A 30 m, 0.32 mm id., 0.25 mm film thickness, crosslinked 5% Phenyl methyl siloxane, HP 5MS, capillary column (Agilent Tech.) was used for the separation of OCPs throughout the study.
For Total Organic Carbon studies Method 5310 was applied to the sediment samples. Procedure is as follows; 25 grams of the sediment sample was treated with 25 ml 0.1 M H2SO4 for 2 h on hot plate. The samples then dried in oven at 200°C for 4 h.
Results And Discussion
Organochlorine pesticides in sediments
Dry weight concentrations of the organochlorine pesticides were determined from sediment samples and results are shown in Table 1. In this table, the concentrations that are below limit of detection are mentioned as n.d. (not detectable). β-HCH and p-p’-DDT was found in all fourteen samples. Whereas, Heptachlor Epoxide was not observed in any samples. Sample 8 was located in the middle of sampling area and contain all analytes except p-p’-DDD. It was concluded is the most contaminated position with fifteen organochlorine pesticides. This sampling point was in the middle of the lake. Likewise sampling points 2, 4 and 14 are in the middle region and contain nearly all of the pesticides in the sediment samples. Total pesticides concentration in these sediments samples were ranged from 236.82-2388.59 μg/kg for dry weight. The highest concentration were seen in sample 8 and 11 with 2159.96 and 2388.59 μg/kg.
| Pesticide / Sample | 1 | 2 | 3 | 4 | 5 | 6 | 7 | 8 | 9 | 10 | 11 | 12 | 13 | 14 | |
|---|---|---|---|---|---|---|---|---|---|---|---|---|---|---|---|
| α-HCH | 0.68 | 0.44 | n.d. | n.d. | 0.29 | 0.48 | 3.10 | 9.68 | 0.40 | 1.34 | 11.36 | 3.30 | n.d. | 4.71 | |
| β-HCH | 26.07 | 74.00 | 115.44 | 450.49 | 138.72 | 23.15 | 698.19 | 196.69 | 152.46 | 421.49 | 1630.00 | 621.52 | 541.87 | 349.63 | |
| γ-HCH | 2.88 | n.d. | n.d. | 88.58 | 3.39 | 1.82 | n.d. | 157.45 | n.d. | n.d. | n.d. | n.d. | 4.50 | 11.18 | |
| δ-HCH | 52.35 | 62.81 | n.d. | 12.34 | 73.73 | n.d. | 153.15 | 56.53 | n.d. | n.d. | 221.39 | n.d. | n.d. | n.d. | |
| p,p'-DDD | n.d. | n.d. | n.d. | n.d. | 1.53 | 0.07 | n.d. | n.d. | n.d. | 0.88 | n.d. | 2.01 | 2.74 | 6.90 | |
| p,p'-DDE | n.d. | n.d. | n.d. | n.d. | n.d. | n.d. | n.d. | 22.77 | n.d. | 0.11 | n.d. | 0.15 | n.d. | 9.05 | |
| p,p'-DDT | 34.91 | 39.42 | 49.57 | 48.55 | 65.23 | 65.07 | 259.94 | 30.25 | 20.04 | 49.13 | 289.04 | 46.22 | 20.71 | 32.56 | |
| Methoxychlor | 0.16 | 25.87 | n.d. | 1.49 | n.d. | 0.47 | 2.54 | 1.75 | 2.36 | n.d. | 78.19 | 38.30 | 2.14 | 0.97 | |
| Aldrin | n.d. | n.d. | n.d. | 0.71 | n.d. | n.d. | n.d. | 282.95 | n.d. | n.d. | 6.00 | n.d. | n.d. | 102.24 | |
| Dieldrin | 3.59 | 19.26 | 0.33 | 17.44 | n.d. | n.d. | 67.13 | 508.64 | n.d. | 6.33 | 57.57 | 17.08 | n.d. | 242.93 | |
| Endrin | n.d. | 1.86 | 1.90 | 2.44 | n.d. | n.d. | n.d. | 305.74 | n.d. | 1.00 | 2.19 | 2.89 | n.d. | 243.99 | |
| Endrin Aldehyde | n.d. | n.d. | n.d. | 96.70 | n.d. | n.d. | n.d. | 29.63 | n.d. | n.d. | 60.57 | n.d. | n.d. | n.d. | |
| Heptachlor | n.d. | 14.25 | 168.70 | 606.17 | 2.81 | 1.16 | 10.47 | 18.73 | 0.30 | 3.12 | 13.23 | 3.29 | n.d. | 3.69 | |
| Endosulfan | 4.63 | 1.34 | n.d. | 4.85 | 11.06 | 1.22 | n.d. | 91.51 | 3.36 | 9.49 | 19.04 | n.d. | n.d. | n.d. | |
| Endosulfan II | n.d. | n.d. | 26.40 | 17.32 | n.d. | n.d. | n.d. | 23.14 | 11.14 | n.d. | n.d. | n.d. | 50.75 | n.d. | |
| Endosulfan sulfate | 232.78 | 237.48 | 74.58 | 176.94 | 365.26 | 143.40 | n.d. | 421.46 | 259.13 | 390.33 | n.d. | 121.94 | 194.74 | 139.74 | |
| Total | 358.06 | 476.72 | 436.90 | 1524.02 | 662.04 | 236.82 | 1194.52 | 2156.91 | 449.18 | 883.32 | 2388.59 | 856.68 | 817,46 | 1147.62 | |
Table 1: Concentrations of the organochlorine pesticides according to the sampling points (µg/kg, dry weight).
The pollution contains natural and anthropogenic origin sources beside organics synthetic also observed, most natural waters and sediment samples contain organic substances with natural origin (Env. Chem. Analysis). The toxicity of the contaminants and the concentrations of these organic substances have been found to be well correlated [28]. However, it is not correlated with the dry weight concentration of the chemicals present in sediments. Therefore, the Sediment Management Standards criteria for organic chemicals have been set on an OC-normalized basis. The treatment of the sediment samples for Total Organic Carbon analysis was explained in the Experimental section. According to this treatment, OC normalization is applied to sample by sample basis since TOC values vary from station to station. The data set for the TOC concentrations was given in Table 2.
| Sampling Point | %TOC |
|---|---|
| 1 | 2.01 |
| 2 | 2.22 |
| 3 | 1.97 |
| 4 | 2.02 |
| 5 | 1.42 |
| 6 | 1.83 |
| 7 | 1.38 |
| 8 | 2.03 |
| 9 | 1.27 |
| 10 | 0.52 |
| 11 | 2.4 |
| 12 | 2.81 |
| 13 | 4.01 |
| 14 | 1.71 |
Table 2: The total organic Carbon for fourteen samples.
Standard values for TOC is different for every environmental medium. The values greater than 3% are common satiated as near shore sedimental environment. This value is higher in boggy areas and other wetland environments. The contamination with the organic substances with artificial factors such as sewage, petroleum hydrocarbons, wood chips raise the percent TOC values. Sandy and erosional areas or areas with fast flowing currents such as rivers have percent TOC values smaller than 1%.
From the Table 2 it can be seen that except sampling points 10 and 13 the %TOC values in the sediments are between 1 and 3%.
Total pesticide concentrations and %TOC values show no significant correlation therefore this suggests that the distributions of these organochlorine pesticides in the lake are not controlled by the distribution of organic matter. This situation also shows that the TOC and pesticides have different sources.
The dry weight concentrations are converted to OC-normalized concentrations via dividing the mg/kg dry weight concentrations by percent TOC values as shown in the following equation:
Where, mg/kg OC=milligrams of the chemical per kilogram of organic carbon; mg/kg dry weight=milligrams of the chemical per kilogram of dry weight sample; kg TOC/kg dry weight=percent
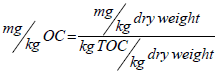
Where, mg/kg OC=milligrams of the chemical per kilogram of organic carbon; mg/kg dry weight=milligrams of the chemical per kilogram of dry weight sample; kg TOC/kg dry weight=percent total organic carbon in dry weight sample (expressed as decimal; for example, 1% TOC=0.01).
The concentrations of the pesticides in the samples showed significant change after the OC normalization was applied. Total sediment concentration ranged from 12941.20 μg/kg, OC normalized (sampling point 6) to 169850.81 OC normalized (sampling point 10) were given in Table 3.
| Pesticides / samples | 1 | 2 | 3 | 4 | 5 | 6 | 7 | 8 | 9 | 10 | 11 | 12 | 13 | 14 |
|---|---|---|---|---|---|---|---|---|---|---|---|---|---|---|
| α-HCH | 33.85 | 19.90 | n.d | n.d. | 20.70 | 26.29 | 224.30 | 476.76 | 31.26 | 257.47 | 473.43 | 117.44 | n.d. | 275.69 |
| β-HCH | 1297.09 | 3333.22 | 5859.75 | 22301.52 | 9769.02 | 1264.90 | 50593.67 | 9689.32 | 12004.62 | 81055.02 | 67916.60 | 22118.08 | 13513.06 | 20446.18 |
| γ-HCH | 143.34 | n.d. | n.d. | 4385.00 | 238.77 | 99.52 | n.d. | 7756.37 | n.d. | n.d. | n.d. | n.d. | 112.23 | 654.07 |
| δ-HCH | 2604.68 | 2829.10 | n.d. | 610.68 | 5192.34 | n.d. | 11097.91 | 2784.70 | n.d. | n.d. | 9224.41 | n.d. | n.d. | n.d. |
| p,p'-DDD | n.d. | n.d. | n.d. | n.d. | 108.04 | 3.76 | n.d. | n.d. | n.d. | 170.15 | n.d. | 71.48 | 68.45 | 403.64 |
| p,p'-DDE | n.d. | n.d. | n.d. | n.d. | n.d. | n.d. | n.d. | 1121.59 | n.d. | 20.49 | n.d. | 5.43 | n.d. | 529.52 |
| p,p'-DDT | 1736.69 | 1775.65 | 2516.07 | 2403.55 | 4593.98 | 3555.75 | 18836.09 | 1490.18 | 1577.59 | 9447.91 | 12043.14 | 1644.68 | 516.42 | 1904.22 |
| Methoxychlor | 8.17 | 1165.09 | n.d. | 73.91 | n.d. | 25.58 | 183.77 | 86.21 | 186.05 | n.d. | 3257.92 | 1362.90 | 53.42 | 56.98 |
| Aldrin | n.d. | n.d. | n.d. | 35.36 | n.d. | n.d. | n.d. | 13938.46 | n.d. | n.d. | 250.11 | n.d. | n.d. | 5979.12 |
| Dieldrin | 178.36 | 867.60 | 16.50 | 863.30 | n.d. | n.d. | 4864.76 | 25055.94 | n.d. | 1217.93 | 2398.90 | 607.67 | n.d. | 14206.72 |
| Endrin | n.d. | 83.73 | 96.21 | 120.73 | n.d. | n.d. | n.d. | 15060.94 | n.d. | 192.54 | 91.31 | 102.73 | n.d. | 14268.14 |
| Endrin Aldehyde | n.d. | n.d. | n.d. | 4787.02 | n.d. | n.d. | n.d. | 1459.46 | n.d. | n.d. | 2523.96 | n.d. | n.d. | n.d. |
| Heptachlor | n.d. | 641.94 | 8563.49 | 30008.47 | 198.22 | 63.14 | 758.65 | 922.60 | 23.98 | 600.01 | 551.34 | 116.98 | n.d. | 215.98 |
| Endosulfan | 230.19 | 60.36 | n.d. | 239.88 | 778.99 | 66.43 | n.d. | 4507.97 | 264.35 | 1825.40 | 793.51 | n.d. | n.d. | n.d. |
| Endosulfan II | n.d. | n.d. | 1340.27 | 857.57 | n.d. | n.d. | n.d. | 1139.95 | 876.81 | n.d. | n.d. | n.d. | 1265.64 | n.d. |
| Endosulfan sulfate | 11581.34 | 10697.20 | 3785.58 | 8759.48 | 25722.34 | 7835.84 | n.d. | 20761.48 | 20403.96 | 75063.88 | n.d. | 4339.45 | 4856.30 | 8171.99 |
| Total concentration | 17813.71 | 21473.81 | 22177.87 | 75446.47 | 46622.41 | 12941.20 | 86559.14 | 106251.93 | 35368.61 | 169850.81 | 99524.63 | 30486.86 | 20385.52 | 67112.24 |
Table 3: Concentrations of the organochlorine pesticides according to the sampling points (μg/kg, OC normalized).
The dry weight concentration and TOC corrected concentrations were compared for pesticides. The results were given in the Figure 2. Sampling point with higher TOC percentage and samller dry weight concentration becomes fairly important. When we compare with a group of pesticides. The individual pesticide corrected of TOC will be smaller. Sample 10 Beta-HCH concentration is not significant without TOC corrected. However after the TOC correction it results became fairly high concentration.
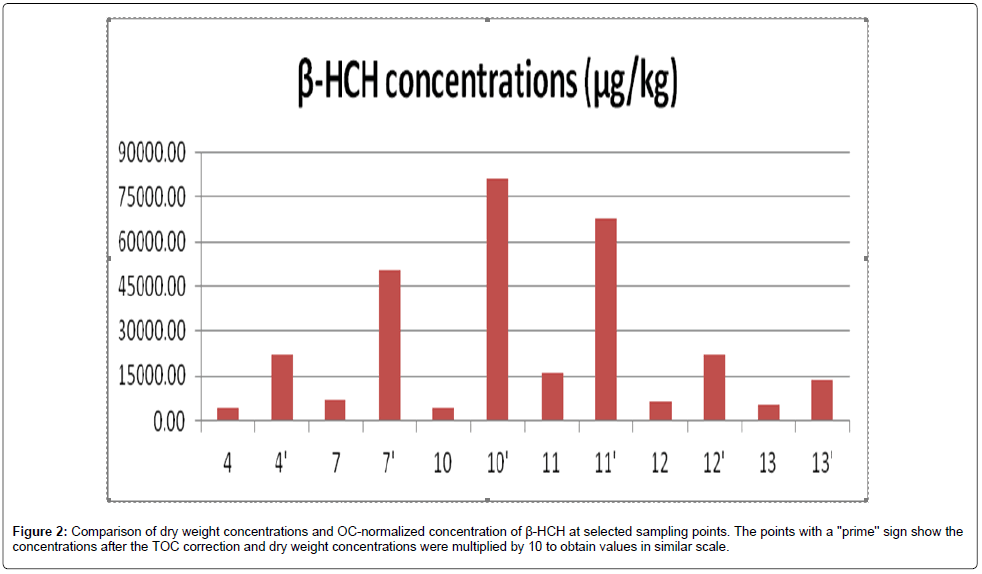
Figure 2: Comparison of dry weight concentrations and OC-normalized concentration of β-HCH at selected sampling points. The points with a ''prime'' sign show the concentrations after the TOC correction and dry weight concentrations were multiplied by 10 to obtain values in similar scale.
The data set obtained in whole study period for Organochlorine Pesticides (OCPs) in 14 sediment samples are displayed in Table 4. The values presented are for the concentrations above the Limit of Quantification, which is determined as the concentration at S/N value of 10. Heptachlor epoxide concentration was found below limit of quantification for all of the samples therefore not shown in the Table 4. Injection of each fourteen sample solutions was performed as three replicates in order to evaluate the precision of the data set. The average, minimum and maximum concentrations and standard deviations of organochlorine pesticides are given in Table 4. According to this table, beta- HCH is the prominent pesticide in the lake and Endosulfan Sulfate, Aldrin, Heptachlor and Dieldrin have the highest concentrations among the other organochlorine pesticides.
| Compounds | Concentrations (µg/g OC normalized) | ||
|---|---|---|---|
| Mean | SD | Range | |
| α-HCH | 0.18 | 1.24 | 0.02- 0.48 |
| β-HCH | 22.94 | 25.33 | 1.26- 67.92 |
| γ-HCH | 1.91 | 3.01 | 0.10- 7.76 |
| δ-HCH | 4.9 | 3.87 | 0.61- 11.10 |
| ∑HCHs | 29.93 | 26.92 | 1.39-81.31 |
| p,p'-DDD | 0.16 | 0.14 | 0.070-9.18 |
| p,p'-DDE | 0.42 | 0.53 | 0.110-22.8 |
| p,p'-DDT | 4.58 | 5.26 | 20.0-346 |
| Methoxychlor | 0.59 | 1.01 | 0.160-78.2 |
| ∑DDTs | 5.75 | 5.52 | 0.64-19.02 |
| Aldrin | 5.05 | 6.53 | 0.04- 5.98 |
| Dieldrin | 5.03 | 8.23 | 0.02- 25.06 |
| Endrin | 3.75 | 6.74 | 0.08-15.06 |
| Endrin Aldehyde | 2.92 | 1.70 | 1.46-4.79 |
| Heptachlor | 5.05 | 8.66 | 0.06-30.01 |
| ∑Cyclodienes | 21.8 | 17.91 | 0.02-34.67 |
| Endosulfan | 0.97 | 1.44 | 0.06-4.51 |
| Endosulfan II | 1.1 | 0.22 | 11.1-50.8 |
| Endosulfan sulfate | 16.83 | 19.67 | 74.6-422 |
| ∑Endosulfans | 18.9 | 19.88 | 0.79-76.89 |
Table 4: Statistics for Organochlorine Pesticides (Values in mg/kg, OC normalized).
The standard deviations of the concentrations between the samples of the different sampling stations are high, since the pollution level may not be the same in different locations due to different sources effective near the environment of the study area.
Average total OCP concentration in ?kizcetepeler sediment Samples Lake is 58.00 ± 45.44 mg/kg. The concentration distribution of sampling stations is shown in Table 5. Two OCPs (β-HCH, and p,p- DDT) were detected at all 14 sites. The total concentrations of OCPs in sediment ranged from 12.94 to 169.87 mg/kg, with a mean value of 58.00 mg/kg. The greatest concentration was observed at site 10. Among OCPs, residues of total HCHs (ΣHCHs, the summation of α-, β-, γ- and δ-HCH), DDTs (ΣDDTs, summation of p,p’-DDD, p,p’-DDE and p,p’-DDT), total cyclodienes (Σ Cyclodienes, summation of Aldrin, Dieldrin, Endrin, Endrin Aldehyde, Heptachlor)and total endosulfan derivatives (Σ Endosulfans summation of Endosulfan, Endosulfan II, Endosulfan sulfate) in sediment varied from 1.39 to 81.31 μg/g, 0.64 to 19.02 μg/g, 0.02 to 34.67 μg/g, 0.79 to 76.89 μg/g, respectively. Among cyclodienes, aldrin and heptachlor have the highest concentration in their subgroup. Among DDTs, p, p’-DDT is the prominent derivative.
| Sampling point | Total 17 OCP (ppm) |
|---|---|
| 1 | 17.81 |
| 2 | 21.47 |
| 3 | 22.18 |
| 4 | 75.45 |
| 5 | 36.99 |
| 6 | 12.94 |
| 7 | 86.56 |
| 8 | 106.25 |
| 9 | 35.37 |
| 10 | 169.87 |
| 11 | 99.52 |
| 12 | 30.49 |
| 13 | 20.39 |
| 14 | 67.11 |
| Average | 58.00 |
Table 5: Concentrations of seventeen organochlorine pesticides from fourteen sampling points (concentrations in mg/kg).
Among HCHs, β- HCH isomer was much higher than α-, γ- and δ-HCH. Endosulfan sulfate has the highest concentration among endosulfan subgroup.
The p,p’- DDT isomer covers the 87.72% of the total DDTs. Dieldrin is responsible for the 33.09% share of cyclodiene pollution. Endosulfan sulfate has a share of 93.41% in its subgroup and in HCH subgroup β- HCH has the greatest share with 86.60%. This finding indicates that HCH derivatives of the area are residues of former usages since β-HCH was the most stable isomer in HCHs due to low vapor pressure [11].
Sampling points 4, 7, 8, 10, 11, 14 have greater average total concentration than the total average concentration around the lake. The most polluted site is the sampling point 10 with 169.87 mg/kg concentration (Table 5).
The data obtained in this study are compared to the other studies performed in some regions in Turkey and China. The data are seen in Table 6. Concentrations are the dry weight measurements and given in μg/g.
|
|
∑ HCHs (µg/g) | ∑ DDTs (µg/g) | ∑ Cyclodienes (µg/g) | ∑ Endosulfans (µg/g) | Number of sampling points | Sampling Time | References |
|---|---|---|---|---|---|---|---|
| Hirfanl? Dam Lake | 2.33 | 1.23 | 3.65 | - | 10 | 1999-2000 | [16] |
| Tuz Lake | 4.26 | 3.70 | 3.02 | - | 10 | 1999-2000 | [16] |
| Meriç Delta | 0.0023 | 0.0017 | 0.0018 | 0.0017 | 8 | 2002-2003 | [19] |
| Black Sea, wet wt. | 0.012 | 0.011 | 0.069 | - | 14 | 1998-2000 | [17] |
| Taihu Lake, China | 0.018 | 0.00079 | 0.0074 | - | 20 | 2006 | [10] |
| ?kizcetepeler Dam Lake | 0.48 | 0.11 | 0.22 | 0.20 | 14 | 2009 | This study |
Table 6: Different studies and the sum of OCP analytes concentrations.
The comparison is made between the studies that include lakes since the fluvial effects become important when the rivers or seas are in discussion. Hirfanl? Dam Lake and Tuz Lake have higher pesticide concentrations than ?kizcetepeler Dam Lake however Meriç Delta, Black Sea and Taihu Lake were found to be less contaminated than the sampling region in this study. Tuz Lake is the most polluted lake in terms of organochlorine pesticides, Hirfanl? Dam Lake follows it and ?kizcetepeler Dam Lake is the third most contaminated region among these six selected sampling regions.
Conclusion
Fourteen surface sediment samples were analysed from Bal?kesir (?kizcetepeler) Dam Lake for seventeen Organochlorine Pesticides (OCPs) analytes. The dry weight concentrations and OC-normalized concentrations were calculated. Concentrations of organochlorine pesticides in sediments were found higher. This made us to conclude that further studies can direct how harmful is using of the water from Dam Lake. It indicates that there is an environmental pollution related to pesticides contamination. Besides this, there may be PAH and other organics contaminations are also possible.
References
- Haynes D, Johnson JE (2000) Organochlorine, heavy metal and polyaromatic hydrocarbon pollutant concentrations in the Great Barrier Reef (Australia) environment: a review. Mar Pollut Bull 41: 267-278.
- Duodu GO (2017) Marine Pollution Bulletin. Factors influencing organochlorine pesticides distribution in the Brisbane River Estuarine sediment, Australia.
- Duodu GO, Goonetilleke A, Ayoko GA (2016) Optimization of in-cell accelerated solvent extraction technique for the determination of organochlorine pesticides in river sediments. Talanta 150: 278-285.
- Buah-Kwofie A, Humphries MS (2017) The distribution of organochlorine pesticides in sediments from iSimangaliso Wetland Park: Ecological risks and implications for conservation in a biodiversity hotspot. Environmental Pollution 229: 715-723.
- Dalla Valle M, Codato E, Marcomini A (2007) Climate change influence on POPs distribution and fate: a case study. Chemosphere 67: 1287-1295.
- Ritter L, Solomon KR, Forget J (1995) Persistent Organic Pollutants an Assessment Report on DDT-aldrin-dieldrin-endrin-chlordane Heptachlor-hexachlorobenzene Mirex-toxaphene-polychlorinated Biphenyls-dioxins and Furans.
- Solomon GM, Schettler T (2000) Environment and health: 6. Endocrine disruption and potential human health implications. Can Med Assoc J 163: 1471-1476.
- Bouwman H (2004) South Africa and the Stockholm convention on persistent organic pollutants. S Afr J Sci 100: 323-328.
- Zhou R, Zhu L, Yang K, Chen Y (2006) Distribution of organochlorine pesticides in surface water and sediments from Qiantang River, East China. J Hazard Mater 137: 68-75.
- Doong RA, Peng CK, Sun YC, Liao PL (2002) Composition and distribution of organochlorine pesticide residues in surface sediments from the Wu-Shi River estuary, Taiwan. Marine Pollution Bulletin 45: 246-253.
- Da?l? S (2007) The Stockholm convention and the current situation of POPs in Turkey, TUBITAK Marmara Research center Chemistry and Environmental institute. Anibal mevkii, Gebze, kocaeli-Turkey. The Fate of Persistent Organic Pollutants in the Environment, pp: 21-30.
- Cindoruk S (2011) Atmospheric organochlorine pesticide (OCP) levels in a metropolitan city in Turkey. Chemosphere 82: 78-87.
- Aksoy A, Das YK, Yavuz O, Güvenc D, Atmaca E, et al. Organochlorine pesticide and polychlorinated biphenyls levels in fish and mussel in Van region, Turkey. Toxicology Letters 196.
- Pazi I, Küçüksezgin F, Gönül LT (2011) Distribution and sources of organochlorinated contaminants in sediments from Izmir Bay (Eastern Aegean Sea). Marine Pollution Bulletin 62: 1115-1119.
- Barlas EN (2002) Determination of organochlorine pesticide residues in water and sediment samples in inner Anatolia in Turkey. Bull Environ Contam Toxicol 69: 236-242.
- Bakan G, Ariman S (2004) Persistent organochlorine residues in sediments along the coast of mid-Black Sea region of Turkey. Mar Pollut Bull 48: 1031-1039.
- Barlas N, Cok I, Akbulut N (2006) The contaminat?on levels of organochlorine pesticides in water and sediment samples in Uluabat Lake. Turkey Environmental Monitoring and Assessment 118: 383-391.
- Erkmen B. Kolankaya D (2006) Determination of organochlorine pesticide residues in water, sediment, and fish samples from the Meric¸ Delta, Turkey. Intern J Environ Anal Chem 86: 161-169.
- Taiwo AM, Olujimi OO, Bamgbose O, Arowolo TA (2012) Surface Water Quality Monitoring in Nigeria: Situational Analysis and Future Management Strategy. Water Quality Monitoring and Assessment.
- Darko G, Akoto O (2008) Dietary intake of organophosphorus pesticide residues through vegetables from Kumasi, Ghana. Food Chem Toxicol 46: 3703-3706.
- Ogbeide O, Tongo I, Ezemonye L (2015) Assessing the distribution and human health risk of organochlorine pesticide residues in sediments from selected rivers Chemosphere 144: 1319-1326.
- Fianko RJ, Augustine D, Samuel TL, Paul OY, Eric TG, et al. (2011) Healthrisk associated with pesticide contamination of fish from the Densu river Basin in Ghana. J Environ Prot 2: 115-123.
- Yohannes YB, Ikenaka Y, Nakayama SMM, Ishizuka M (2013) Organochlorines pesticides in fish species from Lake Ziway, Ethiopa; association with tropic level and human health risk assessment. Paper Presented at 5th International Toxicology Symposium in Africa. Hokkaido University Publication.
- Ezemonye L, Ogbeide O, Tongo I, Enuneku A, Ogbomida E (2015) Pesticide contaminants in Clarias, gariepinus and Tilapiazilli from three rivers in Edo State, Nigeria; implications for human exposure. Int J Food Contam 2: 3.
- Huang T, Guo Q, Tian H, Mao X, Ding Z, et al. (2014) Assessing spatial distribution, sources, and human health risk of organochlo-rine pesticide residues in the soils of arid and semiarid are as of north west China. Environ Sci Pollut Res 21: 6124-6135.
- Manirakazi P, Covaci A, Scheepns P (2001) Comparative study on Total Lipid determination using Soxlet, Rose-Gottlieb, Bligh and Dyer and modified Bligh and Dyer extraction Method. J Food Compos Anal 4: 93-100.
- Toro DM, Zarba CS, Hansen DJ, Berry WJ, Swarm RC, et al. (1991) Technical basis for establishing sediment quality criteria for nonionic organic chemicals using equilibrium partitioning. Environ Toxicol Chem 10: 1541-1583.
Citation: Sifatullah KM, Gokmen P, Tuncel SG (2017) Determination of Organochlorine Pesticides in Sediments Using Gas Chromatography and Mass Spectrometry. J Anal Bioanal Tech 8: 383. DOI: 10.4172/2155-9872.1000383
Copyright: ©2017 Sifatullah KM, et al. Determination of Organochlorine Pesticides in Sediments Using Gas Chromatography and Mass Spectrometry. J Anal Bioanal Tech 8: 383. doi: 10.4172/2155-9872.1000383
Share This Article
Open Access Journals
Article Tools
Article Usage
- Total views: 6330
- [From(publication date): 0-2017 - Jun 30, 2024]
- Breakdown by view type
- HTML page views: 5558
- PDF downloads: 772