Research Article Open Access
Solid Phase Extraction and Spectrophotometric Determination of Methylene Blue in Environmental Samples using Bentonite and Acid Activated Bentonite from Egypt
Youssef AM1, Al-Awadhi MM2 and Akl MA1*1 ChemistryDepartment, Faculty of Science, Mansura University, Egypt
2 Chemistry Department, Faculty of Science, Mansura University, Mansura, Egypt
- *Corresponding Author:
- Prof. Magda Akl
Chemistry Department
Faculty of Science, Mansura University
P.O. Box 70, Mansura, Egypt
Tel: +20502217833
Fax: + 20502316781
E-mail: magdaakl@yahoo.com
Received date: December 20, 2013; Accepted date: January 22, 2014; Published date: January 24, 2014
Citation: Youssef AM, Al-Awadhi MM, Akl MA (2014) Solid Phase Extraction and Spectrophotometric Determination of Methylene Blue in Environmental Samples using Bentonite and Acid Activated Bentonite from Egypt. J Anal Bioanal Tech 5:179. doi: 10.4172/2155-9872.1000179
Copyright: © 2014 Youssef AM, et al. This is an open-access article distributed under the terms of the Creative Commons Attribution License, which permits unrestricted use, distribution, and reproduction in any medium, provided the original author and source are credited.
Visit for more related articles at Journal of Analytical & Bioanalytical Techniques
Abstract
In the present work, bentonite (Bn) clay, from Egypt, has been modified using HCl to produce the acid-activated bentonite (A-ABn). Both Bn and A-ABn adsorbents have been characterized using Fourier-transform infrared spectroscopy (FTIR), scanning electron microscopy (SEM) and nitrogen adsorption measurements. The prepared adsorbents have been used for removal of methylene blue(MB) dye from environmental samples via batch test. The factors influencing the adsorption capacities of Bn and A-ABn, such as: pH, adsorbent dosage, initial dye concentration, contact time, ionic strength and temperature, were systematically investigated and discussed. The adsorption capacities are 336.741 mg/g and 174.83 for Bn and A-ABn, respectively.The experimental data were analyzed using first order kinetics, pseudo-second order kinetics and intra-particle diffusion models. It is found that kinetics followed the pseudo-second order equation. The equilibrium isotherm data are analyzed according to Langmuir and Freundlich equations. The thermodynamic parameters including ΔG°, ΔH° and ΔS°for the adsorption processes of MB on Bn and A-ABn were also calculated; and the negative values of ΔG° indicated the spontaneous nature of adsorption. The proposed adsorbents were successfully applied to the removal of MB from different water samples with a recovery % >95% and a relative standard deviation, RSD,<3%.
Keywords
Methylene blue; Bentonite; FTIR; SEM
Introduction
Generally, dyes are classified into three groups: (i) cationic: all basic dyes; (ii) nonionic: disperse dyes and (iii) anionic: direct, acid and reactive dyes [1]. Cationic dyes such as methylene blue (MB) can be applied to leather, wool, silk, paper, plastics, as well as for the production of ink, copying paper and cotton mordant with tannin [2,3]. MB is a toxic dye and can cause mutations, allergic dermatitis, cancer, skin irritation, eye burns in humans and animals, cyanosis, methemoglobinemia, convulsions, dyspnea, tachycardia, and if ingested irritation to the gastrointestinal nausea, tract, diarrhea and vomiting [4,5]. There are various methods for dye removal, such as biological methods, coagulation, coagulation–flocculation, oxidationozonation and adsorption. Adsorption process is one of the simplest and effective techniques with easy working conditions for many applications, such as liquid mixture separation, wastewater treatment and purification, or polar organic solutes recovery from biotechnology processes. Adsorption is a widely used technique for the removal of dyes due to economical and environmentally friendly reasons [6].
Nowadays, there are many different adsorbents that can be used for water treatment and purification such as silica gel, activated alumina, zeolites, polymers & resins, clay and activated carbon and metal oxide loaded activated carbons [7-11].
Clay minerals are concerned as widely used adsorbents because of their high specific surface area, sustainable, low-cost and effective ability of the elimination of pollutants from environmental samples.
Bentonite is a clay mineral, which is mainly composed of montmorillonite with chemical composition of SiO2, Al2O3, CaO, MgO, Fe2O3, Na2O and K2O. It comprises one octahedral alumina sheet lying between two tetrahedral layers of silica [12]. The permanent negative charge of bentonite is attributed to the isomorphous replacement of Al3+ for Si4+ in the tetrahedral layer and Mg2+ for Al3+ in the octahedral layer. This negative charge is balanced by the presence of replacable cations (Ca2+,Na+, etc.) in the lattice structure which enhance the adsorption of cationic pollutants [12].
Bentonite is widely applied in many fields of adsorption technology including the adsorption of phenols [13], metals [14], polymers [15,16], organic molecules [17,18], radionuclides [19], pesticides [20] and dyes [21,22].
Bentonite, from Egypt, is used in this investigation, because of its local profusion and availability for use in Egyptian wastewater treatment. Although it is probable to increase the physicochemical activity and surface area of bentonite via acid activation, the relationship between the structural change and adsorption kinetics of bentonite is not evident after acidification by mineral acid [23]. So, it is very significant to study the adsorption of organic cations on Bn and A-ABn.
The aim of this investigation is to test the adsorption behavior of large organic cations from aqueous solution on Bn and A-ABn. To explain the role of the bentonite and the acid activated bentonite in the solid phase extraction of MB from environmental samples, the different experimental factors affecting the adsorption process are thoroughly investigated viz.: the initial MB concentration, contact time, ionic strength and temperature etc…. In addition, kinetic and thermodynamic studies were established to expect the adsorption behavior. The present work may be useful to environmental engineers for designing and establishing a continuous treatment plant for wastewaters and water by using the data obtained.
Experimental
Materials
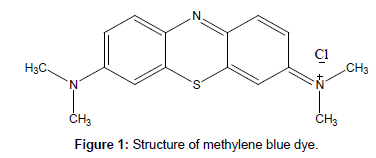
Bentonite applied in this investigation was obtained from Egypt. The chemical component of bentonite is illustrated in Table 1 (determined by x-ray fluorescence). The basic dye, methylene blue (Figure 1), was used without further purification. A stock solution of 2000 mg/L was prepared by dissolving a weighed amount of MB in 1000 mL distilled water. The experimental solution was prepared by diluting the stock solution with distilled water when necessary.
| Component | SiO2 | Al2O3 | Fe2O3 | MgO | Na2O | CaO | TiO2 | K2O | SO3 | other | Loss of ignition |
| Weight % | 70.7 | 15.5 | 2.23 | 0.212 | 0.85 | 0.46 | 0.00 | 2.7 | 0.170 | 1.06 | 8.6 |
Table 1: The chemical composition of bentonite.
Synthesis of acid-activated bentonite (A-ABn)
The acid-activated bentonite was synthesized as follow: 50 mL of 3 N HCl were added gradually to 30 g sample of the dried bentonite for 5 h at the boiling point (~ 378 K) with continuous stirring. After this time, the product was filtered and washed repeatedly with bi-distilled water until no Cl- ion was detected by titration with silver acetate solution (0.1 M). The Acid-activated bentonite was dried at 110°C for 12 h.
Characterization
Surface area measurements: The specific surface area of the adsorbents was estimated by BET method (Brunauer–Emmet–Teller) using liquid N2 adsorption at 77°K by means of a conventional volumetric apparatus. This was determined by a McLeod system connected to the apparatus.
Scanning Electron Microscopy (SEM): The morphology of the samples surfaces was investigated using scanning electron microscopy (SEM, model JSM-T 220A, JEOL, Japan) at an accelerated voltage 20 kv.
Fourier transform infrared spectroscopy (FT-IR): FTIR spectra were analyzed with a Nicolet FTIR spectrophotometer using KBr in a wave number range of 4000–400 cm-1 with a resolution accuracy of 4 cm-1.
Adsorption studies
The batch sorption was executed on Shaking Water Bath (NE5, Nickel-Electro Ltd., UK) at 220 rpm. To investigate the influence of Bn and A-ABn on sorption capacities of MB experiments, 0.1 g adsorbent and 50 mL MB solution (initial conc.1000 mgL-1, natural pH 6.9) were used. The method was operated under shaking at 25°C till adsorption balance was reached. The influence of pH on MB elimination was studied by adjusting 50 ml MB solutions (1000 mg/L) at pH range (2.0- 10.0) using 0.01 mol/L NaOH or HCl solution with 0.1 g of adsorbent for 120 min at 25°C. The influence of temperature on MB elimination was executed in the 50 mL MB solutions (2000 mgL-1, pH 6.9) by adding 0.1 g adsorbent till balance was completed. The influence of sorption time on MB elimination was executed in the 50 ml MB solutions (700 mg l-1, pH 6.9) by adding 0.1 g adsorbent at 25°C for determined period of time. The influence of the initial MB concentration on MB elimination was executed by exciting 50 mL several dye concentrations of MB solution at conditions: pH 6.9; 0.1 g/50 mL; T 25°C; 120 min. Subsequently, the samples were filtered and the adsorbate of residual concentrations was measured. The quantities of MB removed via sorbents qe and percent extracted %E can be calculated by the subsequent equations:
 (1)
(1)
 (2)
(2)
Where qe (mg/g) is the equilibrium concentration of MB on the adsorbent, C° and Ce are the initial and equilibrium liquid-phase concentrations of dye (mg/g), respectively, m (g) is the mass of adsorbent and V (L) is the volume of solution. The concentration of MB in the residual solution was analyzed spectrophotometrically by UV-Vis spectrophotometer at wavelength 662 nm and the amount of adsorption qt was calculated according to equation (1).
Results and Discussion
Characterization of bentonite and acid activated bentonite
Textural properties
Surface area, volume and width of the micropores: By modeling the adsorption of gases by porous materials, it is possible to evaluate various characteristics of the porous solids, such as surface area, pore volume and width. Obtaining these parameters is important since they are related to the sites available for adsorption. The surface area and porosity of an adsorbent are significant parameters in determining its adsorption capacity as well as its adsorption performance [24]. The adsorption isotherms so obtained were analyzed by the traditional BET equation. Table 2 reveals that activation of bentonite with HCl was found to be linked with an increase in the surface area, the mean diameter and total pore volume. The SBET (m2/g) increased from 32.17 to 79.84. The pore volume VT (ml/g) increased from 0.0162 to 0.0408. The average pore diameter (nm) increased from 1.009 to 1.022 nm. The acidification can cause replacement of exchangeable cations (Na+, Ca2+, K+) with H+ ions, removal of impurities and leaching of Mg2+, Al3+ and Fe3+ from the tetrahedral and octahedral sites in bentonite which expose the edges of platelets [6].
| Adsorbent | Surface area SBET(m2/g) | BET-C constant | Pore volume VT (ml/g) | Average pore diameter. r (nm) |
|---|---|---|---|---|
| Bentonite | 32.17 | 75.29 | 0.0162 | 1.009 |
| A-ABn | 79.84 | 210 | 0.0408 | 1.022 |
Table 2: The textural properties of the investigated Bentonites as determined from nitrogen adsorption isotherms
These textural activations are illustrated when the textural properties of bentonite are compared with those of A-ABn. The evident changes in the textural parameters caused by activated bentonite by HCl may be ascribed to the construction of smaller pores takes place as the impurities are removed and the exchangeable cations are substituted by H+ ions [25].
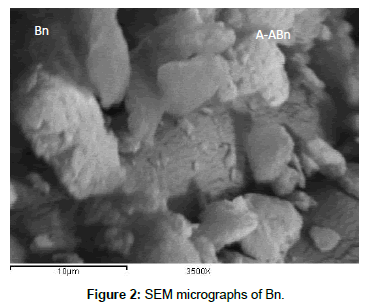
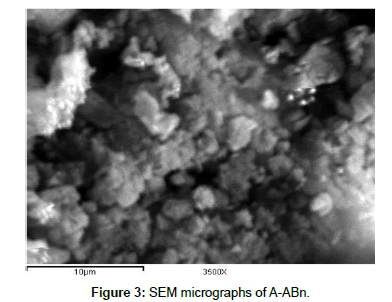
SEM: The SEM images of Bn and A-ABn are shown in Figures 2 and 3, respectively. Obviously, the agglomerates of Bn contain few numbers of particles compared with those of A-ABn. The particles of A-ABn are more eroded than the particles of bentonite which increased the surface area. This acidification alters the morphology of the bentonite as the pores open up. So, the SEM images of Bn and A-ABn confirm the results obtained from the surface area. Activation of bentonite by HCl was associated also with evident change in the morphology and particle size.
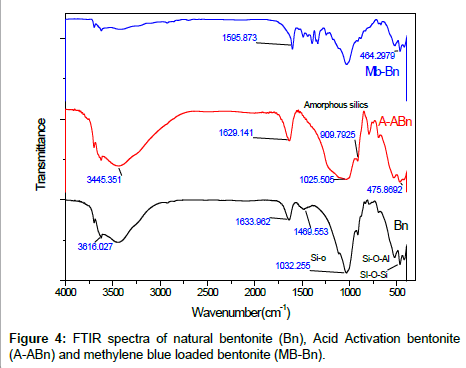
FTIR spectroscopy: To obtain evidence for the adsorption of MB into bentonite and acid-activated, the FTIR spectra of bentonite, A-ABn and MB loaded bentonite (Mb-Bn) are shown in Figures 4a-4c. The broad absorption bands observed at 3350–3650 cm−1 are caused by the O–H stretching vibration of the Si–OH bands and HO–H vibration of the H2O adsorbed on silica surface. The band appearing at 1630 cm−1 is due to the H2O bending vibration [26]. The broad bands at 1093-1032 cm−1 are related to the stretch vibrations of Si-O in the Si-O-Si groups of the tetrahedral sheet. Also, the bands at 524 and 464 cm−1 are caused by Si-O-Al (octahedral sheet) and Si-O-Si bending vibrations [27,28]. For Mb-Bn, two peaks appear at 3020, 2924 cm−1 which represent the stretching vibration of -CH- aromatic and -CH3 methyl groups of MB, the band near 1488 cm−1 is related to the -CH3 peak and the peaks at 1397-1323 cm−1 region and the feature conforming to the C=C skeleton stretching at 1596 cm−1 create from the aromatic ring vibrations of MB (Figure 2c). The percolating of Al and Mg was shown by the disappearance of the Al–Mg–OH bands and the intensity reduction of Al–Al–OH bands. The band of amorphous silica was shown in the range of 1260-1120 cm−1 (Figure 2b) [29].
Adsorption of methylene blue
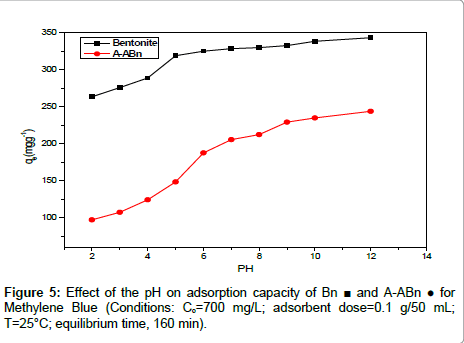
Effect of pH: The pH value of the solution, which affects the surface charge of the adsorbent and the degree of speciation of adsorbate, was an important controlling parameter in the adsorption process. Figure 5 shows the effect of pH on the removal of MB onto Bn and A-ABn from aqueous solution. The pH of the solution was controlled by the addition of 0.1 M HCl or 0.1 M NaOH solution. When the pH value of the dye solution was raised from 2 to 10 the adsorption capacity increases significantly from 264 to 343 mg/g. The high increase in adsorption may be attributed to the attraction between cationic dye molecules and the excessive hydroxyl ions at alkaline pH values. Similar results have also been reported for MB sorption onto modified mesoporous clay [30] and vegetal fiber activated carbons [31].
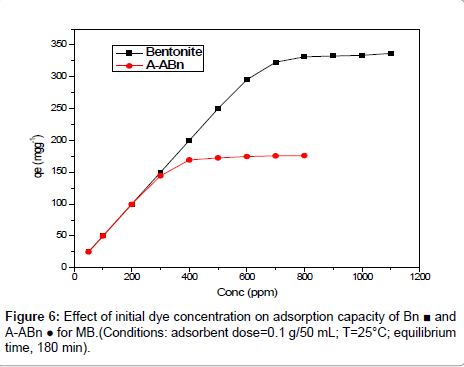
Effect of initial dye Concentration: In general, the sorption of dye was dependent on the initial concentration of the dye [32]. Figure 6 shows the effect of initial MB concentration on the adsorption capacity of bentonite and A-ABn towards MB. It can be shown that qe increased sharply from 295.40 to 331.46 mg/g for Bn and from 144.49 mg/g to 172.58 mg/g for A-ABn when the initial MB concentration increased from 600 to 800 mg/l. However, the amount of MB adsorbed at equilibrium (qe) enhanced slightly from 331.46 to 336.74 mg/g for Bn with an increase in the initial MB concentration from 800 to 1100 mg/l. For A-ABn the qe increased from 172.58 mg/g to 176.18 mg/g from with an increase in the initial MB concentration from 500 to 800 mg/l at 25°C. Figure 6 shows that higher elimination of MB onto Bn is greater than that of A-ABn. It appears that an increase in adsorbate concentration results in an increase in the driving force which leads to an increase in the MB diffusion rate [33]. The amount of MB adsorbed at equilibrium (qe) increased from 25 to 336.74 mg/g and from 24.898 to 176.18 mg/g for Bn and A-ABn, respectively. The results indicated that the Bn is an efficient adsorbent for MB.
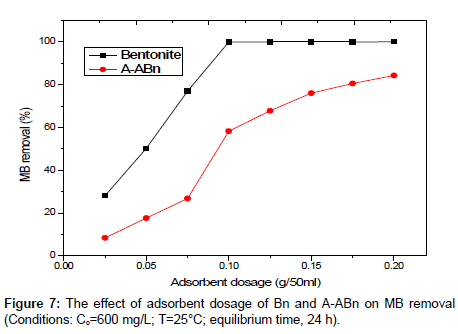
Effect of amount of adsorbent: The effect of adsorbent dosage on removal %s of MB by bentonite and A-ABn is shown in Figure 7. When the sorbent dose increases from 0.025 to 0.2 g, the percent dye removal by Bn and A-ABn increases from 27.51% to 99.97% and from 8.61% to 84.43%, respectively. It was observed that the adsorption of the MB enhanced rapidly with increasing amount of adsorbent from 0.025 to 0.075 g and slightly enhanced from 0.1 to 0.25 g. This can be simply attributed to the increased sorbent surface area and the availability of more sorption sites. However, the amount of MB adsorbed (mg/g) was found to decrease with further increase in adsorbent dosage due to the high number of unsaturated adsorption sites.
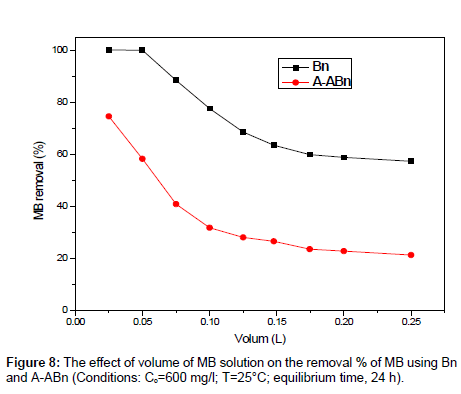
Effect of volume of MB: The volume of MB solution is one of the factors that influence the effective capacity of the adsorption for MB. Various volumes of MB solutions (0.025-0.25 L) with 0.1 g sorbent were applied at pH 6.9, 25°C, and MB 600 mg/l. Figure 8 shows that the removal % of MB onto Bn is higher than that of A-ABn. The MB removal % decreased slightly from 99.99% to 57.30% (Bn) and from 74.53% to 21.35% (A-ABn) with increasing volume of MB solution from 0.025 to 0.25 L.
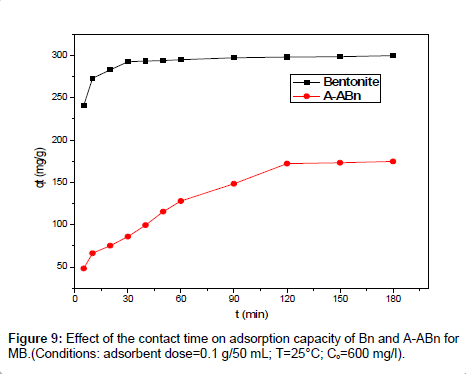
Effect of contact time on adsorption: Figure 9 shows the influence of contact time on the sorption capacity of Bentonite and A-ABn for dye solution using 600 ppm MB. It is evident that the sorption capacity of Bn and A-ABn increases rapidly by the increase of contact time from 0 to 90 min and more than 92% of the equilibrium sorption capacity for MB are executed at 90 min. After 120 min, the sorption capacity became constant and the adsorption equilibrium is accomplished. Consequently, 120 min was chosen as the contact time for the sorption of MB onto the adsorbents under our study conditions. As shown, the sorption process can be divided into three steps: (a) an initial step with sorption occurring promptly, (b) subsequently slow sorption, and (c) a final step with sorption getting equilibrium and residual constant. The first step can be attributed to the rapid attachment of MB to the surface of the bentonite by surface mass transfer. At this step (0-20 min) more than 85% of MB adsorption was achieved in Bn, while more than 55% was achieved in A-ABn. The second step was slower (20- 90), probably because many of the available external sites were already occupied in addition to the slow diffusion of MB molecules into the network of bentonite. The kinetics of the sorption process shows that the adsorption of MB onto Bn and A-ABn indicate a fast sorption process because more than 85% of MB was adsorbed within 20 min especially at MB concentration lower than the maximum adsorbed. This result reveals the advantages of using this low-cost adsorbent for the treatment of aqueous solutions loaded in dyes in general and MB in particular.
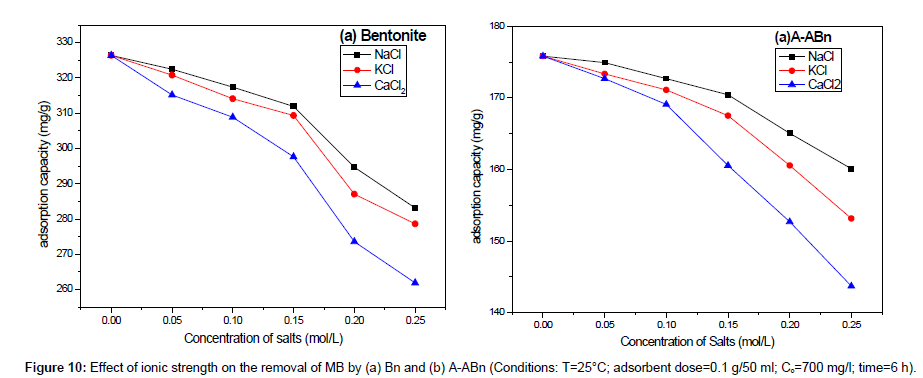
Effect of ionic strength: The presence of salt in water leads to high ionic strength that may affect the efficiency of the adsorption process [33]. As can be shown in Figure 10, the variation of salts concentration (NaCl, KCl, and CaCl2) had a major effect on the range of basic dye adsorption. The current study indicates that the sorption of positively charged MB on Bn and A-ABn decreased with the addition of salts in the order: NaCl<KCl<CaCl2. The escalates of ionic strength in aqueous solution may be resulting in the compression of the diffuse double layer on the adsorbent which eases the electrostatic attraction and participates to the adsorption consequently [34].
Effect of temperature on adsorption: The influence of temperature on adsorption was investigated at 25, 35 and 45°C, Table 3. It can be clearly seen that the amount of MB adsorbed at equilibrium increases with increasing temperature. When the temperature increased from 25°C to 45°C, the maximum amounts of MB removed increased from 336.742 to 352.472 mg/g and from 172.58 to 178.99 mg/g for Bn and A-ABn, respectively. It is found that high temperature eased the sorption of MB on Bn. It is common that increasing temperature may create a swelling influence inside the adsorbent structure facilitating the penetrative addition of big dye molecule [30].
| Samples | Qe(mg g-1) | ||
|---|---|---|---|
| 25°C | 35°C | 45°C | |
| Bentonite | 336.7416 | 347.5281 | 352.4719 |
| A-ABn | 172.58 | 175.28 | 178.99 |
Table 3: Effect of temperature on maximum adsorption capacities of MB by Bentonite and A-ABn.
Adsorption kinetics
In order to understand the process of adsorption, two kinetic models were applied to analyze the experimental data. The first-order rate expression given by Lagergren [35] can be expressed as Eq. (3):
 (3)
(3)
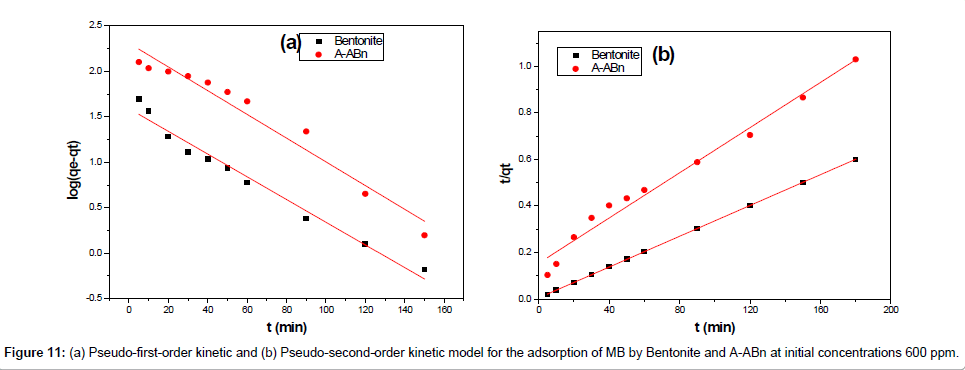
Where qe and qt (mg/g) are the amounts of MB adsorbed at equilibrium and at time t, respectively and k, is the equilibrium constant (min-1) which were obtained from the slopes of the linear plots of ln(qe – qt) versus time t (Figure 11a).
The pseudo-second-order model [36] can be expressed as Eq. (4):
 (4)
(4)
Where k2 (g/mg min) is the equilibrium rate constant for the pseudo second-order adsorption and qe can be obtained from the plot of  against t (Figure 11b).
A comparison of the results with the correlation coefficients for the first-order kinetic and second-order kinetic models is shown in Table 4. For Bentonite and A-ABn the pseudo-second order model is the best fit model for experimental kinetic data. The value of the calculated qe approved very well with the experimental data and R2 is greater than 0.977 for all adsorbents. These results also indicated the applicability of this kinetic equation and the second-order nature of the adsorption process of MB on clays [34].
| Pseudo first-order kinetic model | ||||
|---|---|---|---|---|
| Qe,exp.( mg g-1) | Qe,1cal (mg g-1) | k1 (min-1) | R12 | |
| Bentonite: | 299.89 | 38.873 | 0.02879 | 0.97416 |
| A-ABn: | 174.83 | 204.164 | 0.03001 | 0.95204 |
| Pseudo second-order kinetic model | ||||
| Qe,exp. (mg g-1) | Qe,2cal (mg g-1) | k2 (g mg-1 min-1) | R22 | |
| Bentonite: | 299.89 | 302.115 | 5.62*10-8 | 0.99998 |
| A-ABn: | 174.83 | 206.186 | 3.627*10-6 | 0.97749 |
Table 4: Kinetic parameters for the adsorption of MB onto Bentonite and A-ABn.
Adsorption isotherms
The equilibrium adsorption isotherms were explained using Langmuir and Freundlich isotherm equations which are defined by the following equations, respectively:
 (5)
(5)
 (6)
(6)
where b is Langmuir equilibrium constant (L mg-1), and qm (mgg-1) is the monolayer adsorption capacity; n and Kf (mgg-1) are the Freundlich constants. The Freundlich parameters can be obtained by the following linearized equation:
 (7)
(7)
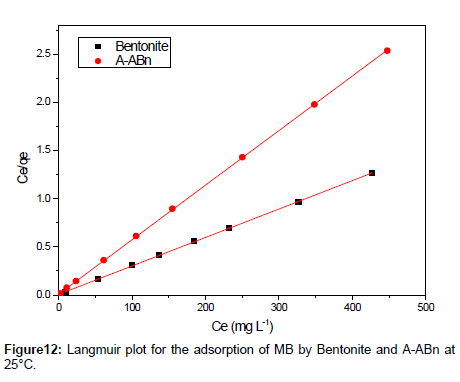
By linear plotting of ln qe as the function of ln Ce, the values of Kf and n can be obtained from the intercept and the slope of the plot (Figure 12).The isotherm parameters for the adsorption of MB onto Bn and A-ABn are given in Table 5. Langmuir adsorption model provides the best fit with experimentally obtained data for Bn and A-ABn with (R2 = 0.999). This shows that the surface of bentonite was enveloped by the monolayer of methylene blue.
| Adsorbent | Langmuir | Freundlich | ||||
|---|---|---|---|---|---|---|
| qmax (mg/g) | b (L/mg) | R2 | Kf (mg/g) | n | R2 | |
| Bentonite: | 336.74 | 0. 454 | 0.9999 | 306.7828 | 65.92 | 0.8555 |
| A-ABn | 176.18 | 0.704 | 0.9999 | 136.3957 | 21.94 | 0.7782 |
Table 5: Adsorption isotherm parameters for the adsorption of MB on Bn and A-ABn.
Thermodynamic studies
Thermodynamic parameters were calculated from the difference of the thermodynamic distribution coefficient, kc with change in temperature. The standard free energy change, ΔG°, was calculated using the expression:
ΔG° = −RTlnKc(8)
ΔG° = ΔH°−TΔS°(9)
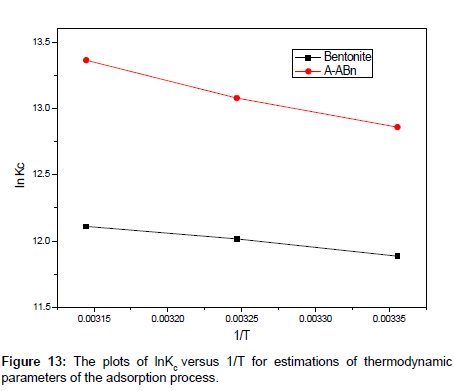
where R is gas constant (8.314 J/mol/K), T the is absolute temperature in K0 and Kc is the Langmuir constant. Standard enthalpy (ΔH°) and entropy (ΔS°) of adsorption could be estimated from Van’t Hoff equation [37]:
 (10)
(10)
By plotting a graph of ln Kc versus 1/T (Figure 13), the values of ΔH° and ΔS° can be estimated from the slope and intercept of Van’t Hoff plots, respectively. The thermodynamic parameters are presented in Table 6. It is evident from Table 6, that the values of ΔG° are negative for bentonite and A-ABn. The negative values of ΔG° for all adsorbents at various temperatures indicate that the process is feasible and spontaneous. The magnitude of ΔG° increased with increasing temperature, which also indicated that better adsorption was actually obtained at higher temperatures. A more negative ΔG° implied a greater driving force of adsorption, resulting in a higher adsorption capacity.
| Sample Code | ΔH° (KJ/mol) | ΔS°(KJ/mol K) | ΔG° (KJ/mol) | ||
|---|---|---|---|---|---|
| 298 K | 308 K | 318 K | |||
| Bentonite | 8.857254 | 0.12858 | -29.4482 | -30.7698 | -32.0182 |
| A-ABn | 19.86235 | 0.17345 | -31.8953 | -33.4911 | -35.3545 |
Table 6: Thermodynamic parameters for adsorption of MB by Bentonite and A-ABn at different temperatures.
For all the sorbents, the positive value of ΔH° suggested the endothermic nature of the adsorption process. The positive value of ΔH° reflects an endothermic nature of MB adsorption on Bn and A-ABn and indicates that the adsorption is favored at high temperature, which is supported by the increase of MB adsorption onto Bn and A-ABn with rising temperature. The adsorption is more favorable at higher temperature and MB was strongly adsorbed on the surface of both Bn and A-ABn.
Moreover, the positive value of ΔS° indicates the increased randomness during sorption process.
Analytical applications
The prepared adsorbents were successfully applied for the removal of known amounts of methylene blue spiked to different natural water samples. The recovery % ranged between 70.00 and 99.30% with a relative standard deviation (RSD, %, <3), Table 7.
| Sample (location) | Methylene blue Added, ppm | Bentonite | Acid activated bentonite | ||
|---|---|---|---|---|---|
| R,% | RSD, % | R,% | RSD,% | ||
| Bidistilled water (Our lab) | 5 10 15 |
99.30 98.70 98.20 |
0.201 0.041 0.041 |
70.00 70.50 73.10 |
0.078 0.114 0.100 |
| Tab water (domestic supply) | 5 10 15 |
99.13 98.55 98.00 |
0.211 0.050 0.039 |
72.50 74.30 76.00 |
0.076 0.210 0.099 |
| Waste water (Sewage drainage station) | 5 10 15 |
99.00 98.50 98.00 |
0.211 0.056 0.042 |
71.79 71.32 78.87 |
0.065 0.100 0.110 |
| Underground water (Salaka Village) | 5 10 15 |
98.70 98.43 97.77 |
0.211 0.321 0.097 |
75.60 71.10 78.80 |
0.086 0.202 0.223 |
Table 7: Recovery of methylene blue from different water samples using bentonite and acid activated bentonite (n=5).
Conclusion
Bentonite deposits have been reported in different parts of Egypt. In the present study, bentonite clay was selected as a local, cheap and readily available adsorbent for the removal of MB from the aqueous solutions. Natural and acid activated bentonite was characterized using nitrogen adsorption isotherms, FTIR and SEM. Adsorption of the MB dye was studied by batch adsorption experiments. Natural bentonite used is of montmorillonite nature as confirmed by the chemical composition found in literature. FTIR and SEM analyses confirmed modification of bentonite treated with acid. The amount of MB adsorbed was found to increase in order Bn (336.7416 mg/g) > A-ABn (172.58 mg/g). The results revealed that the adsorption of the dye increases with increasing the pH using natural bentonite and acid activated bentonite. In addition, they indicated a gradual increase in the percentage removal of MB dye with temperature for natural and acid activated bentonite. An optimum dosage of both natural and acid activated bentonite is 10 gL-1. The adsorption kinetic studies showed that the removal of MB is a rapid process and the adsorption process obeys the pseudo-second order model, indicating that cationic dye has a very strong affinity for the bentonite surface. It was found that the experimental isotherm data can be fitted well to the Langmuir equilibrium isotherm model. Thermodynamic studies indicated that the adsorption process was endothermic and spontaneous in nature. The Bn and A-ABn adsorbents were successfully applied to the removal of MB from different environmental samples. The adsorption capacities for MB onto Bn and A-ABn are in good agreement with the previously reported data, Table 8.
| Adsorbent | Adsorption capacity (mg/g) | Reference |
|---|---|---|
| Bentonite | 336.7416 | Present study |
| acid-activated bentonite | 172.58 | Present study |
| 50 wt% bentonite | 168.63 | [7] |
| Activated carbon from Posidoniaoceanica | 285.7 | [38] |
| Salix psammophila activated carbon | 225.89 | [39] |
| Sepiolite | 57.38 | [30] |
| supersorbent polymeric nanocomposite hydrogels (Acm 4%) | 635.63 | [40] |
| Date stone | 316.11 | [41] |
| activated carbon from cottonstalk-based | 180.0 | [42] |
| activated carbon from oil palm wood-based | 90.9 | [43] |
| activated carbon from oilpalm shell-based | 243.9 | [44] |
Table 8: Adsorption capacities of selected adsorbents used for MB removal from polluted water.
References
- Silva MMF, Oliveira MM, Avelino MC, Fonseca MG, Almeida RKS, et al. (2012) Adsorption of an industrial anionic dye by modified-KSF-montmorillonite: Evaluation of the kinetic, thermodynamic and equilibrium data. Chemical Engineering Journal 203:259-268.
- Eren E (2009) Investigation of a basic dye removal from aqueous solution onto chemically modified Unyebentonite. J Hazard Mater 166: 88-93.
- GhasemiJSA (2007) Thermodynamics’ study of the adsorption process of methylene blue. J Chem Thermodynamics 39:967-971.
- Vargas AM, Cazetta AL, Kunita MH, Silva TL, Almeida VC (2011) Adsorption of methylene blue on activated carbon produced from flamboyant pods (Delonix regia): Study of adsorption isotherms and kinetic models. Chemical Engineering Journal 168: 722-730.
- Ur Rehman MS, Kim I, Han JI (2012) Adsorption of methylene blue dye from aqueous solution by sugar extracted spent rice biomass. CarbohydrPolym 90: 1314-1322.
- Toor M, Jin B (2012) Adsorption characteristics, isotherm, kinetics, and diffusion of modified natural bentonite for removing diazo dye. Chemical Engineering Journal 187: 79-88.
- Liu Y, Kang Y, Mu B, Wang A (2014) Attapulgite/bentonite interactions for methylene blue adsorption characteristics from aqueous solution. Chemical Engineering Journal 237: 403-410.
- Roosta M, Ghaedi M, Daneshfar A, Sahraei R(2014) Experimental design based response surface methodology optimization of ultrasonic assisted adsorption of safaranin O by tin sulfide nanoparticle loaded on activated carbon, SpectrochimActa A MolBiomolSpectrosc 122C: 223-231.
- Roosta M, Ghaedi M, Daneshfar A, Sahraei R, Asghari A (2014) Optimization of the ultrasonic assisted removal of methylene blue by gold nanoparticles loaded on activated carbon using experimental design methodology. UltrasonSonochem 21: 242-252.
- Ghaedi M, Larki HA, Kokhdan SN, Marahel F, Sahraei R, et al.(2013) Synthesis and characterization of zinc sulfide nanoparticles loaded on activated carbon for the removal of methylene blue. Environmental Progress and Sustainable Energy 32: 535-542.
- Ghaedi M, Ghaedi AM, Hossainpour M, Ansari A, Habibi MH, et al.(2013) Least square-support vector (LS-SVM) method for modeling of methylene blue dye adsorption using copper oxide loaded on activated carbon: Kinetic and isotherm study. Journal of Industrial and Engineering Chemistry Article in Press.
- Hu Q, Qiao S, Haghseresht F, Wilson M, Lu G (2006) Adsorption study for removal of basic red dye using bentonite. Industrial & engineering chemistry research 45: 733-738.
- Andini S, Cioffi R, Montagnaro F, Pisciotta F, Santoro L (2006) Simultaneous adsorption of chlorophenol and heavy metal ions on organophilicbentonite. Applied clay science 31: 126-133.
- Eren E, Afsin B (2008) An investigation of Cu(II) adsorption by raw and acid-activated bentonite: a combined potentiometric, thermodynamic, XRD, IR, DTA study. J Hazard Mater 151: 682-691.
- Asselman T, Garnier G (2000) Adsorption of model wood polymers and colloids on bentonites. Colloids and Surfaces A: Physicochemical and Engineering Aspects 168: 175-182.
- Bacquet M, Martel B, Morcellet M, Benabadji K, Medjahed K, et al. (2004) Adsorption of poly (4-vinylpyridine) onto bentonites. Materials Letters 58: 455-459.
- Demirbas A, Sari A, Isildak O (2006) Adsorption thermodynamics of stearic acid onto bentonite. J Hazard Mater 135: 226-231.
- Ayari F, Srasra E, Trabelsi-Ayadi M (2007) Retention of organic molecule “quinalizarin” by bentonitic clay saturated with different cations. Desalination 206: 499-506.
- Bors J, Dultz S, Riebe B (2000) Organophilicbentonites as adsorbents for radionuclides: I. Adsorption of ionic fission products. Applied clay science 16: 1-13.
- Bojemueller E, Nennemann A, Lagaly G (2001) Enhanced pesticide adsorption by thermally modified bentonites. Applied Clay Science 18: 277-284.
- Yue Q-Y, Li Q, Gao B-Y, Wang Y (2007) Kinetics of adsorption of disperse dyes by polyepicholorohydrin-dimethylamine cationic polymer/bentonite. Separation and purification technology 54: 279-290.
- Eren E, Afsin B (2008) Investigation of a basic dye adsorption from aqueous solution onto raw and pre-treated bentonite surfaces. Dyes and Pigments 76: 220-225.
- Eren E, Afsin B (2009) Removal of basic dye using raw and acid activated bentonite samples. J Hazard Mater 166: 830-835.
- Yener N, Biçer C, Önal M, Sarikaya Y (2012) Simultaneous determination of cation exchange capacity and surface area of acid activated bentonite powders by methylene blue sorption. Applied Surface Science 258:2534-2539.
- Kul AR, Koyuncu H (2010) Adsorption of Pb(II) ions from aqueous solution by native and activated bentonite: kinetic, equilibrium and thermodynamic study. J Hazard Mater 179: 332-339.
- Sapawe N, Jalil AA, Triwahyono S, Shah MIA, Jusoh R, et al. (2013) Cost-effective microwave rapid synthesis of zeolite NaA for removal of methylene blue. Chemical Engineering Journal 229:388-398.
- Senturk HB, Ozdes D, Gundogdu A, Duran C, Soylak M (2009) Removal of phenol from aqueous solutions by adsorption onto organomodifiedTirebolubentonite: equilibrium, kinetic and thermodynamic study. J Hazard Mater 172: 353-362.
- Tabak A (2009) Structural analysis of reactive dye species retained by the basic alumina surface. Journal of Thermal Analysis and Calorimetry 95: 31-36.
- Hajjaji M, El Arfaoui H (2009) Adsorption of methylene blue and zinc ions on raw and acid-activated bentonite from Morocco. Applied Clay Science 46:418-421.
- Auta M, Hameed BH (2012) Modified mesoporous clay adsorbent for adsorption isotherm and kinetics of methylene blue. Chemical Engineering Journal 198-199:219-227.
- Cherifi H, Fatiha B, Salah H (2013) Kinetic studies on the adsorption of methylene blue onto vegetal fiber activated carbons. Applied Surface Science 282: 52-59.
- Yao Y, Xu F, Chen M, Xu Z, Zhu Z (2010) Adsorption behavior of methylene blue on carbon nanotubes. BioresourTechnol 101: 3040-3046.
- Eren E (2009) Removal of basic dye by modified Unyebentonite, Turkey. J Hazard Mater 162: 1355-1363.
- Rida K, Bouraoui S, Hadnine S (2013) Adsorption of methylene blue from aqueous solution by kaolin and zeolite. Applied Clay Science 83-84:99-105.
- Lagergren S (1898) About the theory of so-called adsorption of soluble substances. KungligaSvenskaVetenskapsakademiensHandlingar 24: 1-39.
- Ho Y-S, McKay G (1999) Pseudo-second order model for sorption processes. Process Biochemistry 34: 451-465.
- Li Q, Yue Q-Y, Su Y, Gao B-Y, Sun H-J (2010) Equilibrium, thermodynamics and process design to minimize adsorbent amount for the adsorption of acid dyes onto cationic polymer-loaded bentonite. Chemical Engineering Journal 158: 489-497.
- Dural MU, Cavas L, Papageorgiou SK, Katsaros FK (2011) Methylene blue adsorption on activated carbon prepared from Posidoniaoceanica(L.) dead leaves: Kinetics and equilibrium studies. Chemical Engineering Journal 168:77-85.
- Bao Y, Zhang G (2012) Study of Adsorption Characteristics of Methylene Blue onto Activated Carbon Made by Salix Psammophila. Energy Procedia 16: 1141-1146.
- Atta A, Akl MA, Youssef AM, Ibraheim MA (2013) Superparamagnetic Core-Shell Polymeric Nanocomposites for Efficient Removal of Methylene Blue from Aqueous Solutions. Adsorption Science & Technology 31: 397-420.
- Foo KY, Hameed BH (2011) Preparation of activated carbon from date stones by microwave induced chemical activation: Application for methylene blue adsorption. Chemical Engineering Journal 170:338-341.
- Girgis BS, Smith E, Louis MM, El-Hendawy ANA (2009) Pilot production of activated carbon from cotton stalks using H3PO4. J Anal ApplPyrol 86: 180-184.
- Ahmad AL, Loh MM, Aziz JA (2007) Preparation and characterization of activated carbon from oil palm wood and its evaluation on methylene blue adsorption. Dyes Pigments 75: 263-272.
- Tan IAW, Ahmad AL, Hameed BH (2008) Enhancement of basic dye adsorption uptake from aqueous solutions using chemically modified oil palm shell activated carbon. Colloids Surf A 318: 88-96.
Relevant Topics
Recommended Journals
Article Tools
Article Usage
- Total views: 17661
- [From(publication date):
February-2014 - Apr 04, 2025] - Breakdown by view type
- HTML page views : 12856
- PDF downloads : 4805

