Research Article Open Access
Determination of Heavy Metals in Blood, Urine and Water Samples by Inductively Coupled Plasma Atomic Emission Spectrophotometer and Fluoride Using Ion-Selective Electrode
Akan JC*, Sodipo OA, Liman Y and Chellube ZMDepartment of Chemistry, University of Maiduguri, P.M.B 1069, Maiduguri, Borno State, Nigeria
- *Corresponding Author:
- Dr. J.C. Akan
Department of Chemistry
University of Maiduguri, P.M.B 1069
Maiduguri, Borno State, Nigeria
Tel: +2348036000506
E-mail: joechemakan@yahoo.com
Received: October 16, 2014; Accepted October 30 2014; Published October 04, 2014
Citation: Akan JC, Sodipo OA, Liman Y, Chellube ZM (2014) Determination of Heavy Metals in Blood, Urine and Water Samples by Inductively Coupled Plasma Atomic Emission Spectrophotometer and Fluoride Using Ion-Selective Electrode. J Anal Bioanal Tech 5:217 doi: 10.4172/2155-9872.1000217
Copyright: © 2014 Akan JC, et al. This is an open-access article distributed under the terms of the Creative Commons Attribution License, which permits unrestricted use, distribution, and reproduction in any medium, provided the original author and source are credited.
Visit for more related articles at Journal of Analytical & Bioanalytical Techniques
Abstract
This study was conducted in Maiduguri Metropolis of Borno State, Nigeria. The levels of fluoride, cadmium, arsenic, lead and nickel were determined in sachet, tap and ground water. The levels of fluoride and some heavy metals were also determined in blood and urine samples with respect to age groups. The sample collection and preparation were carried out using standard procedures. The concentrations of the heavy metals were determined by using Inductively Coupled Plasma Atomic Emission Spectrophotometer (ICPAES), while fluoride was determined Potentiometrically Using Ion-Selective Electrode. The results of this study showed that the concentration of fluoride was highest in male subject with a value of 1.65 mg/l within the age group of 51-60, while the lowest concentration of 0.02 mg/l was observed in female subject within the age group of 1-10. The concentrations of the metals studied in blood samples from male subject were significantly higher than in the female subject. The concentrations of these metals were significantly higher at an age group of 51-60, while the age group 1-10 showed the lowest concentrations. It was also observed that the concentration of fluoride in urine samples from male subject increased significantly with increase in age (P<0.05). The concentration of fluoride in borehole water from Gamboru, Bolori, Mairi and Gwange ward ranged between 0.02 mg/l and 0.01 mg/l, 0.04 mg/l and 0.11 mg/l Ni, 0.05 mg/l and 0.07 mg/l Cd, while for tap water the concentration of fluoride ranged from (0.034 to 0.73 mg/l), (0.026 to 0.54 mg/l)As, (0.15 to 0.24 mg/l)Pb, (0.08 to 0.22 mg/l)Ni, and (0.12 to 0.31 mg/l)Cd. Similarly for sachet water (Hauwa, Madube, Mustapha and Rahama waters) the concentration of fluoride ranged between 0.01 mg/l and 0.06 mg/l, 0.01 mg/l and 0.03 mg/l As, 0.001 mg/l to 0.05 mg/lPb, 0.01 mg/l and 0.0007 mg/l Ni, 0.01 mg/l to 0.05 mg/l Cd. The highest concentration of Cd in borehole water was observed in Mairi, while the lowest concentration of F was in Gamboru. Similarly, the concentration of F in tap water was significantly higher (P<0.05) in Bolori, while Ni showed the lowest concentration in Gamboru. From the above results, the concentrations of all the metals in the water samples were lower than those of the blood and urine samples, this is possible because; metals can be accumulated and concentrated in human bodies. Hence, it may be concluded that the water samples consumed by these inhabitants might not be responsible for the presence of these studied metal in the blood and urine samples.
Keywords
Heavy metals; Fluoride; Blood; Urine; Water; ICPAES; Ion-selective electrode
Introduction
Arsenic is a naturally occurring element found in soil. Cereals, seafood, meats, mushrooms, baked foods, fats/oils, wine, beer, soft drinks, juices, coffee, and cocoa all contain arsenic. Sea food, rice/rice cereals, mushroom, and poultry usually have the highest arsenic levels. Blood and urine normally contain arsenic. The amount of arsenic in blood or urine associated with a specific health symptom (e.g., nausea) varies for individuals and varies depending on the arsenic test used. In children, total urine arsenic levels are usually between 5 and 10 micrograms per liter. Children whose parents smoke have higher urine arsenic levels than children of parents who do not smoke. The World Health Organization recommends intervention for twenty-four hour total urine arsenic levels >100 μg/L. The best specimen is a 24 hrs urine collection; although a single void or “spot” urine specimens can be helpful in an emergency. Normal total 24-hour urinary arsenic values are <50 μg/L in the absence of consumption of seafood in the past 48 hours. Values in excess of 200 μg/L are unusual and may require treatment. In most people, blood arsenic levels are normally <70 μg/ dL. Blood arsenic levels, however, are less useful than urinary arsenic measurements because the body clears arsenic from the blood within a few hours. Although blood arsenic levels vary, the Florida Poison Control Center considers <70 μg/dL as normal. Arsenic occurs in two forms: organic and inorganic. Pesticides used on cotton plants contain organic arsenic. Pressure-treated wood contains inorganic arsenic compounds. Organic arsenic is less toxic than inorganic arsenic. Organic arsenic found in fish and other foods is mostly in a nonharmful form. Most physicians order urine and blood tests for total arsenic. They must order a specific test to distinguish between organic and inorganic arsenic. The body rapidly excretes arsenic. Urine tests are only useful for measuring exposure to arsenic in the past two days. Blood tests are only useful for measuring exposure to arsenic in the past three to four hours [1]. Arsenic (As) constitutes one of the most important environmental contaminants when global human health hazards are considered. Epidemiological studies reveal that chronic human exposure, as may be associated with peripheral artery disease, cardiovascular effects, diabetes mellitus, various cancers and adverse reproductive effects [2]. As-associated cancer has been observed in populations highly exposed, as occupationally, medically or through contaminated drinking water [2]. The general human exposure, as is primarily through the ingestion of food. In some areas, the drinking water, smelting activities, coal combustion and contaminated soils contribute to an additional environmental, as exposure. The total daily intake of total as shows great inter-regional variation, mainly due to the worldwide variation in the consumption of sea food and fish products.
Cadmium is a natural element in the earth’s crust. It combines with other elements such as oxygen (cadmium oxide), chlorine (cadmium chloride) or sulfur (cadmium sulfate, cadmium sulfide). All soils and rocks, including coal and mineral fertilizers, contain some cadmium. Production of zinc, lead, and copper also produces cadmium. Cadmium does not corrode easily and has many uses, such as in batteries, pigments, metal coatings, and plastics [3]. Cadmium stays in the body for a very long time and can build up from many years of exposure to low levels. A balanced diet can reduce the amount of cadmium taken into the body from food and drink. Tests are available in some medical laboratories that measure cadmium in blood, urine, hair, or nails. Blood levels show recent exposure to cadmium, and urine levels show both recent and easily exposure. The reliability of tests for cadmium levels in hair or nails is unknown. Blood cadmium levels are mainly used for determining recent exposure(s) to cadmium rather than whole body burdens. According to the World Health Organization, blood concentrations <10 μg/dL are considered acceptable in occupational exposures. According to one study, environmental exposure can elevate blood cadmium concentration to above 10 μg/dL.
Lead is a naturally occurring bluish-grey metal found in small amounts in the earth’s crust. It has no characteristic taste or smell. Metallic lead does not dissolve in water and does not burn. Lead can combine with other chemicals to form lead compounds or lead salts. Some lead salts dissolve in water better than others do. Some natural and manufactured substances contain lead but they do not look like lead in its metallic form. Some of these substances can burn—for example, organic lead compounds in gasoline. Blood lead concentration is the most widely used biomarker of lead exposure. A blood lead concentration greater than 10 μg/dl indicates excessive lead exposure. The half-life of lead in blood is 28–36 days [4]. Blood lead concentrations in all of the north Suwannee County site in live Oak (US) residents tested were below the Centers for Disease Control and Prevention’s guideline of 10 μg/dL and are not likely to cause illness. Out of the 20 children whose urine samples were tested, 17 were below detection limits. The other three had urinary lead levels of 1 to 2 μg/L.
Fluoride occurs notably as Sellaite, Fluorspar, CaF2; Cryolite, Na3AlF6; Fluorapatite, 3Ca3(PO4)2 Ca(FCl2). As fluorspar it is found in sedimentary rocks and as cryolite in igneous rocks. These fluoride minerals are nearly insoluble in water. Hence fluorides will be present in ground water only when conditions favour their solution. It is also present in sea water (0.8-1.4 ppm), in mica and in many drinking water supplies. Fluoride in drinking water is known for both beneficial and detrimental effects on health [5]. Leaching of fluoride from the earth crust is the chief source of fluoride content in ground water; however the other sources like food items also add to increase in the overall ingestion of fluoride into the human body [6]. Fluoride exposure by ingestion at high levels of concentration (1.5 ppm) has been shown to result in skin irritation and staining of teeth, gums and enamels; in excess, it could lead to fluorosis (rapture of teeth). Therefore it becomes necessary to investigate the levels of fluoride in drinking water in such an environment [7]. In many parts of the world, high concentrations of fluoride occurring naturally in groundwater and coal have caused widespread fluorosis - a serious health disease among local populations. In some communities, fluoride is added to public water supplies; a process known as fluoridation. Water fluoridation involves adjusting the natural level of fluoride to the levels recommended to prevent tooth decay. There is no difference in potential health effects between naturally occurring fluoride or that added through fluoridation. Fluoride concentration in drinking water cannot be detected by taste, sight or smell except by analytical methods. Fluoridation of a range of everyday products, notably toothpaste and drinking water are made because for decades, it is believed that fluoride in small doses has no adverse effects on health and have shown proven benefits in preventing dental decay [8]. The dental benefits from consuming water containing optimum levels of fluoride are well-documented. Water fluoridation has been designated as one of the ten most important public health measures currently available (Centres for Disease Control and Prevention WHO). Presently, around 350 million people worldwide are continuing to benefit from water fluoridation and new schemes are regularly introduced [8]. Fluoride compounds in the earth’s upper crust are soluble in water; fluoride is found in both surface waters and groundwater. In surface freshwater, however, fluoride concentrations are usually low - 0.01 ppm to 0.3 ppm [9]. In groundwater, the natural concentration of fluoride depends on the geological, chemical and physical characteristics of the aquifer, the porosity and acidity of the soil and rocks, the temperature, the action of other chemical elements, and the depth of wells. Because of the large number of variables, the fluoride concentrations in groundwater can range from well under 1 ppm to more than 35 ppm. In Kenya and South Africa, the levels can exceed 25 ppm. In India, concentrations up to 38.5 ppm have been reported [10]. The National Academy of Sciences has studied the possibility of adverse health effects from continuous consumption of fluoride over long periods of time. The Academy reported that the daily intake required to produce chronic toxicity after years of consumption is 20 to 80 mg or more per day depending upon body weight. This level of fluoride intake has been associated with water supplies containing at least 10 mg/L of natural fluoride, as in parts of India and where water consumption is high because of extreme climatic conditions. Drinking water standards established by Environmental Protection Agency (EPA) fall into two categories – Primary and Secondary Standards. Primary Standards are based on health considerations and are designed to protect human health. Secondary Standards are based on aesthetic factors such as taste, odour, colour, corrosivity, foaming and staining properties of water that may affect water’s suitability for drinking and other domestic uses. Water with a contaminant at or below the Primary Standard is acceptable for drinking every day over a lifetime and does not pose a health risk [10]. The Secondary Maximum Contaminant Level (SMCL) for fluoride is 2 mg/l which is equal to 2 ppm. Water with a fluoride concentration at or below 2 mg/l does not present a health risk and should not cause fluorosis [5]. While it was reported that the Primary Maximum Contaminant Level (PMCL) for fluoride in drinking water is 4 mg/l, daily consumption of water with a fluoride concentration at or below 4 mg/l does not present a health risk, but could cause fluorosis if the level exceeds the SMCL of 2 mg/l [11].
Maiduguri (Lat. 11O 50’N, Log. 13O 13’E) is located in Borno state and occupies the North east position of Northern Nigeria. It is underlined by the sediments of the Chad Basin. The temperature ranges from 22-28°C, with means of the daily maximum exceeding the onset of the rain during March, April and May. It has a minimum temperature drop as low as 12°C in December-February. Studies have shown that the Nigerian population is at risk of the adverse health effects that may result from metal toxicity. Studies have shown that there is a high prevalence of Kidney problem and dental fluorosis in some areas of Borno State, which might be associated with high fluoride and metal levels in potable water and foods; thus posing a major health challenge to humans especially children, hence the need for this study.
Materials and Methods
Sample collection
Blood, urine and water samples were collected from male and female subjects with respect to age group within Maiduguri Metropolis Borno, State, Nigeria. Water samples (tap, sachet and ground water) were collected from Maiduguri Metropolis, Borno State, Nigeria. Standard methods of collection were used as described by [12]. The polyethylene container AS used for sampling were washed with detergent, rinsed with distilled water and pre-treated with 20% nitric acid (HNO3), then finally rinsed through with deionized water followed by drying in an oven to eliminate errors due to metal contaminants. Blood and urine samples were collected from male and female subjects with respect to age at Maiduguri Teaching Hospital (UMTH) in the Haematology laboratory of the study area. This was done after approval had been provided by the Research Ethics Committee of UMTH (ethical clearance, 2013) and with the assistance of health personnel at the hospital. Random sampling was done across all age groups and the ages were categorized as follows: 1-10, 11-20, 21-30, 31-40, 41-50, 51- 60. Blood samples were put into 5ml capacity plain plastic bottles while urine samples were collected in Sandoz sterile vials.
Digestion of Water samples for heavy metal determination
Water samples (tap, sachet and ground water) were digested as follows: 100 cm3 of the sample was transferred into a beaker and 5 ml concentrated HNO3 was added. The beaker with the content was placed on a hot plate and evaporated down to about 20 ml, cooled and another 5 ml concentrated HNO3 was added. The beaker was covered with a watch glass and returned to the hot plate. The heating continued, and then a small portion of HNO3 was added until the solution appeared light coloured and clear. The beaker wall and watch glass were washed with distilled water and the sample filtered to remove some insoluble materials that could clog the atomizer. The volume was adjusted to 100 cm3 with distilled water [12].
Preparation of Urine samples for heavy metal determination
One hundred and twenty five (125 cm3) of each urine samples were evaporated on a water bath to 25 cm3. On cooling, the samples were frozen, lyophilized and stored in the refrigerator (International Atomic Energy Agency [13]. The lyophilized urine sample was allowed to stand at room temperature and then reconstituted with 20 cm3 water [13]. The resultant solution was acidified with 5 cm3 concentrated HNO3 and evaporated on a water bath to about 10 cm3. On cooling, equal volumes of concentrated HNO3 and HClO4 were transferred into a fume chamber. The solution was heated on a hot plate; the heating was stopped after the appearance of a dense and white fume and a clear solution. On cooling the solution, water was added and boiled for 10 minutes to expel free chloride and oxide of nitrogen. The resultant solution was filtered through an acid-washed Whatman 540 filter paper into a 100 cm3 volumetric flask and made up to the mark with distilled water.
Preparation of Blood samples for heavy metal determination
Blood samples were collected into plain bottles and allowed to clot. The clotted samples were centrifuged at 2000 rpm for 10 minutes to obtain serum. The serum samples were stored in plastic vials at 20°C prior to elemental analyses. One ml of serum was diluted to 10 ml with de-ionized water.
Elemental analysis of samples
Determination of Arsenic, Lead, Nickel and Cadmium were made directly on each final solution using Inductively Coupled Plasma Atomic Emission Spectrophotometer.
Sample preparations for fluoride in Blood and Urine Samples
The samples were analysed potentiometrically using the Ion- Selective Electrode (ISE) for fluoride ion (ELIT 8221 crystal membrane, NICCO, UK). All sample preparations were made in accordance with the general operating instruction of the instrument.
Analytical requirements
Ion-Selective Electrode for fluoride ion (ELIT 8221 crystal membrane)
Reference electrode: single junction silver chloride (ELIT 001)
Dual electrode head (ELIT 201)
Standard solution: 1000 ppm F as NaF
Buffer solution: TISAB = Total Ionic Strength Adjustment Buffer
ELIT Computer Interface/Ion Analyser, or Ion/pH/mV meter.
100 or 150 ml polypropylene beakers, 100 ml volumetric flask, 1, 2, 5, 10, 25 ml pipettes.
Calibration
Electrodes were calibrated by measuring a series of known standard solutions, made by serial dilution of the 1000 ppm standard solution; i.e. 100 ml of solutions containing 200, 100, 10, 1 and 0.1 ppm F.
Determination of fluoride
Direct potentiometric measurements for all aqueous samples are possible with the (ISE-fluoride ion ELIT 8221). However, for low ionic strength samples with pH between 4 and 8, no sample preparation is necessary. Approximately 50 to 100 ml of sample in a plastic beaker were used. For samples with high ionic strength and/or pH >8 or pH <4, equal (25 ml) of sample and buffer solution were made and mixed well before measurement. Results of measurement for each sample as displayed on the digital readout were recorded accordingly. Necessary precautions were taken, e.g the electrodes were washed and dried between each sample to avoid cross contamination and sufficient time was allowed (2 or 3 minutes), before taking a reading after immersion, to permit the electrode signal to reach a stable value. Also, frequent recalibration of instrument was made for high precision.
Results
Concentration of fluoride and heavy metals in blood samples
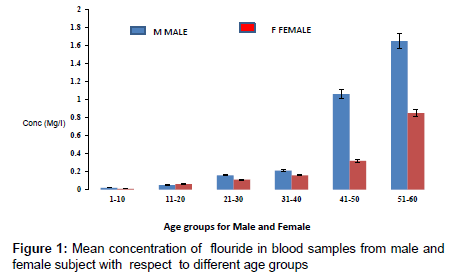
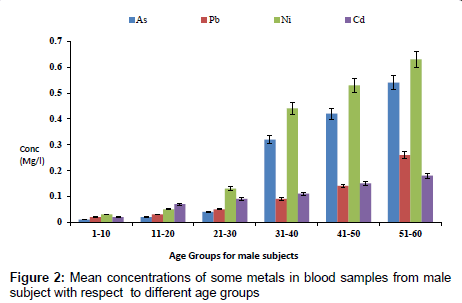
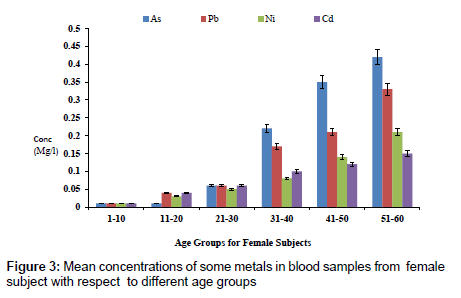
The concentration of fluoride in blood samples from male and female subjects with respect to age is as presented in Figure 1. The concentration of fluoride in male subjects ranged from 0.02 to 1.65 mg/l and 0.01 to 0.85 mg/l for female subjects. The highest concentration of 1.65 mg/l was detected in male subjects within the age group of 51- 60, while the lowest concentration of 0.02 mg/l was observed in female subjects within an age group 1-10. Figure 2 presents the concentrations of some heavy metals in blood samples from male subjects with respect to age. The concentration of As ranged from 0.01 to 0.54 mg/l; 0.02 to 0.26 mg/l Pb; 0.03 to 0.63 mg/l Ni and 0.02 to 0.18 mg/l Cd. The concentrations of these metals were significantly higher at an age group of 51-60, while the age group 1-10 showed the lowest concentrations. The concentrations of some heavy metals in blood samples from female subjects with respect to age are as presented in Figure 3. The concentration as ranged from 0.01 to 0.42 mg/l; 0.01 to 0.33 mg/l Pb; 0.01 to 0.21 mg/l Ni and 0.01 to 0.15 mg/l for Cd.
Concentration of fluoride and heavy metals in urine samples
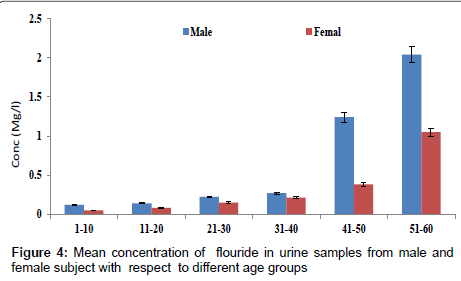
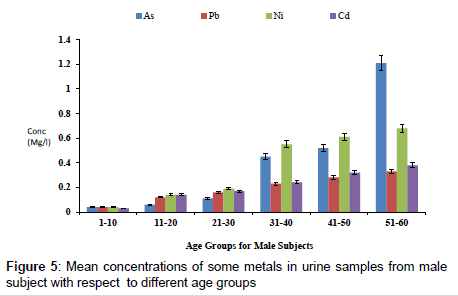
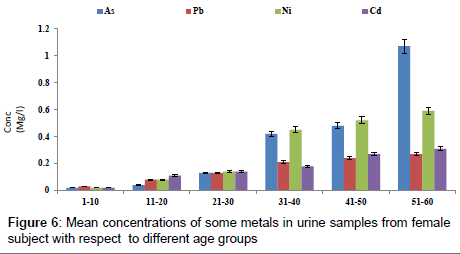
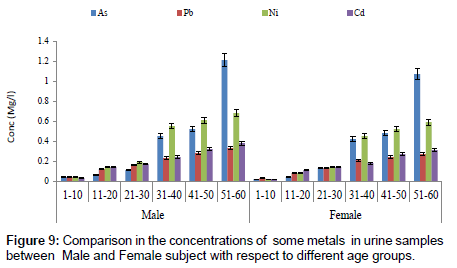
Figure 4 shows the concentration of fluoride in urine samples from male and female samples with respect to age groups. The concentration of fluoride in male subjects ranged from 0.12 to 2.04 mg/l and 0.05 to 1.05 mg/l for female subjects. The concentration of fluoride in the urine samples increased significantly with increase in age (p<0.05). Figure 5 shows the concentrations of some heavy metals in urine samples from male subjects with respect to age. The concentration of As ranged from 0.04 to 1.21 mg/l; 0.04 to 0.33 mg/l Pb; 0.02 to 0.68 mg/l Ni and 0.03 to 0.38 mg/l Cd. the concentrations of this metal were significantly higher at an age group of 51-60 (p<0.05), while the age group 1-10 showed the lowest concentrations. The concentrations of some heavy metals in urine samples from female subjects with respect to age are as presented in Figure 6. The concentration as ranged from 0.02 to 1.07 mg/l; 0.03 to 0.27 mg/l Pb; 0.02 to 0.59 mg/l Ni and 0.02 to 0.31 mg/l Cd.
Comparison in concentrations of fluoride and heavy metals in blood and urine samples
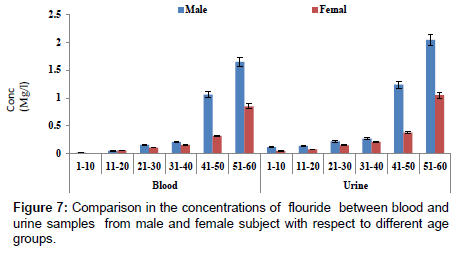
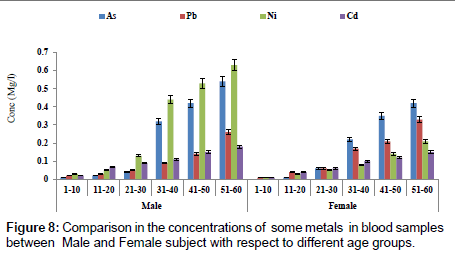
Figure 7 showed a comparison in concentration of fluoride between blood and urine samples with respect to age groups. The concentration of fluoride in male subjects ranged from 0.02 to 2.04 mg/l and 0.01 to1.05 mg/l for female subjects. The concentration of fluoride was significantly higher in the urine sample when compared to blood samples. Figure 8 shows a comparison in concentrations of some heavy metals in blood samples from male and female subjects with respect to age. The concentration of As ranged from 0.01 to 0.54 mg/l; 0.01 to 0.33 mg/l Pb; 0.01 to 0.63 mg/l Ni and 0.01 to 0.18 mg/l Cd. Figure 9 shows a comparison in concentrations of some heavy metals in urine samples from male and female subject with respect to age. The concentration as ranged from 0.02 to 1.21 mg/l; 0.03 to 0.33 mg/l Pb; 0.02 to 0.68 mg/l Ni and 0.02 to 0.38 mg/l Cd.
Concentrations of some elements in tap, sachet and borehole water samples
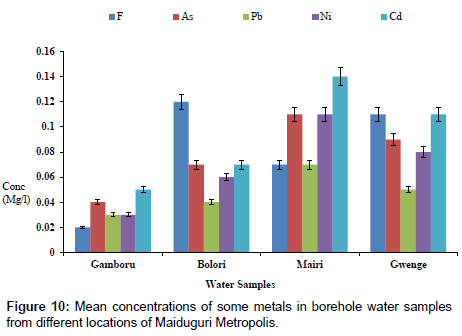
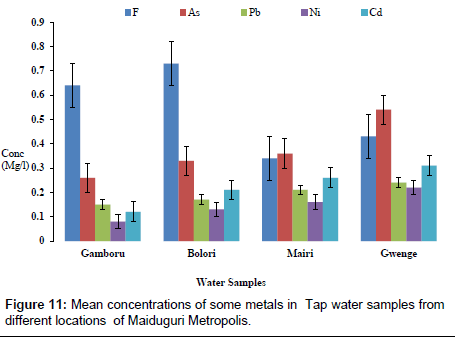
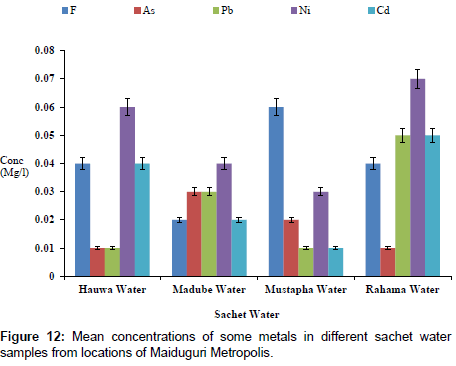
The concentrations of some elements in borehole samples from different locations within Maiduguri Metropolis are as presented in Figure 10. The concentration of F from Gomboru , Bolori, Mairi and Gwange wards ranged from 0.01 to 0.06 mg/l; 0.01 to 0.03 mg/l As; 0.01 to 0.07 mg/l and 0.01 to 0.05 mg/l Cd. Figure 11 present the concentrations of some heavy metals in Tap Water from Gomboru , Bolori, Mairi and Gwange in Maiduguri Metropolis. The concentration of F ranged from 0.34 to 0.73 mg/l; 0.26 to 0.54 mg/l As; 0.15 to 0.24 mg/l Pb; 0.08 to 0.22 mg/l Ni and 0.12 to 0.31 mg/l Cd. Figure 12 shows the concentrations of some metals in different Sachet Water from Maiduguri Metropolis. The concentration of F ranged from 0.01 to 0.06 mg/l; 0.01 to 0.03 mg/l As; 0.01 to 0.05 mg/l Pb; 0.01 to 0.07 mg/l Ni and 0.01 to 0.05 mg/l Cd.
Discussion
The concentration of fluoride was observed to be higher in the male subjects when compared to the female subjects. It was also observed that the concentrations of fluoride were significantly higher in the urine than in the blood samples. Such variation is because the body clears fluoride from the blood within a few hours [14]. Another reason is that once Fluoride is absorbed from the gastro-intestinal tract, approximately 50% is excreted in the urine [15], although this proportion can vary considerably, depending on numerous variables, including F intake, acid-base balance, and urinary pH [16]. Chloride concentrations were much higher in male subject than females, such variation might be due to the fact that male subject are more exposed to fluoride. Such High concentrations of fluoride occurring naturally in groundwater and coal have caused widespread fluorosis. In warmer areas, because of the greater amounts of water consumed, dental fluorosis can occur at lower concentrations in the drinking-water [14,17,18]. It is possible that in areas where fluoride intake via routes other than drinking-water (e.g., air, food) is elevated, dental fluorosis will develop at concentrations in drinking water below 1.5 mg/l [14]. Elevated fluoride intakes can also have more serious effects on skeletal tissues. Skeletal fluorosis (with adverse changes in bone structure) may be observed when drinking water contains 3–6 mg of fluoride per litre. The Secondary Maximum Contaminant Level (SMCL) for fluoride is 2 mg/l. Water with a fluoride concentration at or below 2 mg/l does not present a health risk and would not cause fluorosis [5], while that of Primary Maximum Contaminant Level (PMCL) for fluoride in drinking water is 4 mg/l. Daily consumption of water with a fluoride concentration at or below 4 mg/l does not present a health risk, but could cause fluorosis if the level exceeds the SMCL of 2 mg/l [11]. Results from the present study do not present any health risk because the concentrations of fluoride in all the water samples were below the Secondary Maximum Contaminant Level (SMCL) of 2 mg/l and Primary Maximum Contaminant Level (PMCL) of 4 mg/l.
Arsenic (As)
Nickel accumulation was followed by the present study where the values were observed to be highest in the urine than the blood samples. Arsenic is a naturally occurring element found in soil. Cereals, seafood, meats, mushrooms, baked goods, grains, fats/oils, wine, beer, soft drinks, juices, coffee, and cocoa all contain arsenic. Seafood, rice/ rice cereals, mushrooms, and poultry usually have the highest arsenic levels. The concentrations of arsenic in the water samples were lower than that of blood and urine samples. Hence, the water may not be responsible for the present of Arsenic in the blood and urine samples.
Cadmium (Cd)
The principal form of cadmium in air is cadmium oxide, although some cadmium salts, such as cadmium chloride, can enter the air, especially during incineration. Environmental discharge of cadmium due to the use of petroleum products, combustion of fossil fuels (petroleum and coal) and municipal refuge contribute to airborne cadmium pollution [19] and possibly introduce high concentrations of this potential reproductive toxicant into the environment. This may be particularly true for Nigeria where refuse is burnt without control. In addition, humans may be unwittingly exposed to cadmium via contaminated food or paper cosmetics and herbal folk remedies [20]. All these factors put Nigerian population at high risk of cadmium toxicity [20]. The greatest potential for above average exposure of the general population to cadmium is from smoking which may double the exposure of a typical individual. Smokers with additional exposure are at highest risk [21]. Soil distribution of urban waste and sludges is also responsible for significant increase in cadmium content of most food crops [9]. Persons, who have cadmium-containing plumbing, consume contaminated drinking water or ingest grains or vegetables grown in soils treated with municipal sludge or phosphate fertilizer may have increased cadmium exposure [21]. Production of zinc, lead, and copper also produces cadmium. Cadmium does not corrode easily and has many uses, such as in batteries, pigments, metal coatings and plastics [3]. Cadmium stays in the body for a very long time and can build up from many years of exposure to low levels. A balanced diet can reduce the amount of cadmium taken into the body from food and drink. Blood Cd levels were significantly higher in blood and urine samples with regard to water samples (p<0.05). The data are in accordance with previous studies that reported an increased Cd level in blood [22]. According to the World Health Organization, blood concentrations <10 μg/dL are considered acceptable in occupational exposures. The concentrations of Cadmium in the water, blood and urine samples were lower than these limits.
Lead (Pb)
Lead is a naturally occurring bluish-gray metal found in small amounts in the earth’s crust. It has no characteristic taste or smell. Metallic lead does not dissolve in water and does not burn. Lead can combine with other chemicals to form lead compounds or lead salts. Some lead salts dissolve in water better than others do. Some natural and manufactured substances contain lead but do not look like lead in its metallic form. Some of these substances can burn—for example, organic lead compounds in gasoline. Nevertheless, the mean levels of lead in the blood samples were below the reference values of 1.58–3.82 mg/L, 10–300 mg/L reported [23]. A blood lead concentration greater than 10 micrograms per deciliter (μg/dL) indicates excessive lead exposure [4].
The concentrations of all the metals were significantly higher in the urine and blood samples than the water samples (p<0.05). Hence, the present study suggests that the water samples were not responsible for the high blood-urine concentrations. We could also speculate that an alternative explanation could be through food and other exposure such as smoking, alcoholism and occupational exposure, although there is no evidence to rule out or confirm this possibility. Potential transfer of pollutants from metal-accumulating macrophytes to herbivores may occur [22]. This may be a significant food chain transfer pathway which could possibly reach the human population. Urinary metal levels showed a significant correlation to age, such that older people presented increased metal levels. [22] found that age strongly influenced blood metal levels. These findings support the accumulative potential of Pb, Cd and Ni in the present study. Regarding sex differences, the concentrations of all the metals in the blood and urine samples were significantly higher in male than in female subjects (p<0.05).
Nickel (Ni)
A person may be exposed to nickel by breathing air, drinking water, or smoking tobacco containing nickel. Skin contact with soil, bath or shower water, or metals containing nickel, as well as exposure to metals plated with nickel. Coins contain nickel. Some jewellery are plated with nickel or made from nickel alloys [24]. Exposure of an unborn child to nickel is through the transfer of nickel from the mother’s blood to fetal blood. Likewise, nursing infants are exposed to nickel through the mother to breast milk. However, the concentration of nickel in breast milk is either similar or less than the concentration of nickel in infant formulas and cow milk. Children may also be exposed to nickel by eating soil. Normally, the exact form of nickel one is exposed to is not known. It could be in form of nickel sulphate, nickel oxide, nickel silicate, iron-nickel oxides, nickel subsulfide or metallic nickel [24]. Patients may be exposed to nickel in artificial body parts made from nickel-containing alloys which are used in patients in joint prostheses, sutures, clip, and screws for fractured bones. Corrosion of these implants may lead to elevated nickel levels in the surrounding tissue and to the release of nickel into extracellular fluid. Serum albumin solutions used for intravenous infusion fluids have been reported to contain as much as 222 μg nickel/L, but are very rarely encountered. Dialysis fluid has been reported to contain as much as 0.82 μg nickel/L. Studies of nickel in serum pre- and post-dialysis show between 0 and 33% increases in nickel concentrations in patients [25].
Conclusion
In conclusion, the metal concentrations of the subject from water, blood and urine samples were in all cases below the reference values. From the above results, the concentrations of all the metals in the water samples were lower than those of the blood and urine samples, this is possible because; metals can be accumulated and concentrated in human bodies. The concentrations of all the metals with respect to sex and age were higher in urine when compared to blood samples. The concentrations of all the metals in the blood and urine samples increased with increase in age group, which shows that metal accumulation is dependent on age.
References
- ATSDR (2007) Toxicological profile for Arsenic. Agency for Toxic Substances and Disease Registry, Atlanta: US Department of Health and Human Services.
- World Health Organization (2001) Arsenic and Arsenic Compounds. Environmental Health Criteria 224, 2nd edition. WHO, Geneva. Protection Agency, Office of Drinking Water (TR-823-825).
- ATSDR (2012) Toxicological profile for Cadmium. Agency for Toxic Substances and Disease Registry, Atlanta: US Department of Health and Human Services.
- ATSDR (2007) Toxicological profile for Lead. Agency for Toxic Substances and Disease Registry, Atlanta: US Department of Health and Human Services.
- Choubisa SL, Choubisa L, Choubisa DK (2001) Endemic fluorosis in Rajasthan. Indian J Environ Health 43: 177-189.
- Yadav JP, Lata S (2003) Urinary fluoride levels and prevalence of dental fluorosis in children of Jhajjar District, Haryana. Indian J Med Sci 57: 394-399.
- Waldbott GL (1981) Mass intoxication from accidental overfluoridation of drinking water. Clin Toxicol 18: 531-541.
- McDonagh MS, Whiting PF, Wilson PM, Sutton AJ, Chestnutt I, et al. (2000) Systematic review of water fluoridation. BMJ 321: 855-859.
- World Health Organization (1996) Trace elements in human nutrition and health. International atomic energy agency. WHO Library publication data. Geneva 194-215, 256-259.
- Kilham P, Hecky RE (1973) Fluoride: Geochemical and Ecological Significance in East African Waters and Sediments. Limnology and Oceanography 18: 932-945.
- Czarnowski W, Krechniak J (1990) Fluoride in hair and urine of children in the vicinity of a phosphate industry waste disposal site. Fluoride 23: 119-122.
- Radojevic M, Bashkin VN (1999) Practical Environmental Analysis. The Royal Society of Chemistry, Cambridge 466.
- IAEA (2008) International Atomic Energy Agency: Assessments of levels and health effect of airborn particulate matter in mining, metal refining and metal working industries using nuclear and Related Analytical Techniques IAEA-TEC-DOC 1576.
- Cao SR, Li YF (1992) The evaluation of indoor air quality in areas of endemic fluorosis caused by coal combustion. In: Proceedings of the XIX Conference of the International Society for Fluoride Research, Kyoto, Japan, Kyoto, Department of Hygiene and Public Health, Osaka Medical College, 38.
- World Health Organization (1994) Fluorides and oral health. World Health Organization, Geneva 7-9.
- Whitford GM (1996) Metabolism and toxicity of fluoride. Karger, Basel 1: 12-15, 46-58.
- IPCS (1984) Fluorine and fluorides. Geneva, World Health Organization, International Programme on Chemical Safety (Environmental Health Criteria 36).
- US EPA (1985b) National primary drinking water regulations; fluoride; final rule and proposed rule. US Environmental Protection Agency. Federal Register 50: 47142–47171.
- De Rosa M, Zarrilli S, Paesano L, Carbone U, Boggia B, et al. (2003) Traffic pollutants affect fertility in men. Hum Reprod 18: 1055-1061.
- Wu TN, Yang GY, Shen CY, Liou SH (1995) Lead contamination of candy: an example of crisis management in public health. Lancet 346: 1437-1438.
- Elinder CG (1985) Cadmium: uses, occurrence and intake. Cadmium and health: A toxicological and epidermiologicalappraisal. Vol 1. Exposure, dose and metabolism. Effects and response. Boca Raton, FL. CRS. Press 23-64.
- Moreno MA, Marin C, Vinagre F, Ostapczuk P (1999) Trace element levels in whole blood samples from residents of the city Badajoz, Spain. Sci Total Environ 229: 209-215.
- Ewers U, Krause C, Schulz C, Wilhelm M (1999) Reference values and human biological monitoring values for environmental toxins. Report on the work and recommendations of the Commission on Human Biological Monitoring of the German Federal Environmental Agency. Int Arch Occup Environ Health 72: 255-260.
- ATSDR (2005) Toxicological profile for nickel. Public health service for Agency toxic substances and diseases. Atlanta Georgia 27, 79, 134-144, 166-167.
- IARC (1990) IARC (International Agency for Research on Cancer) monographs on the evaluation of carcinogenic risks to humans. Chromium, nickel and welding. Lyon, France: International Agency for Research on Cancer, World Health Organization 49: 257-445.
Relevant Topics
Recommended Journals
Article Tools
Article Usage
- Total views: 23287
- [From(publication date):
December-2014 - Apr 04, 2025] - Breakdown by view type
- HTML page views : 17671
- PDF downloads : 5616

