Research Article Open Access
Determination of Epinephrine at a Screen-Printed Composite Electrode Based on Graphite and Polyurethane
Dias IARB, Saciloto TR, Cervini P and Cavalheiro ETG*Departamento de Química e Física Molecular, Instituto de Química de São Carlos, Av. Trabalhador São Carlense, 400, Centro, São Carlos, São Paulo CEP 13566-590, Brazil
- *Corresponding Author:
- Cavalheiro ETG
Departamento de Química e Física Molecular
Instituto de Química de São Carlos
Av. Trabalhador São Carlense, 400, Centro
São Carlos, São Paulo CEP 13566-590, Brazil
Tel : 55 (16) 3373-8054
E-mail: cavalheiro@iqsc.usp.br
Received date: February 03, 2017; Accepted date: February 20, 2017; Published date: February 27, 2017
Citation: Dias IARB, Saciloto TR, Cervini P, Cavalheiro ETG (2017) Determination of Epinephrine at a Screen-Printed Composite Electrode Based on Graphite and Polyurethane. J Anal Bioanal Tech 8:350. doi: 10.4172/2155-9872.1000350
Copyright: © 2017 Dias IARB, et al. This is an open-access article distributed under the terms of the Creative Commons Attribution License, which permits unrestricted use, distribution, and reproduction in any medium, provided the original author and source are credited.
Visit for more related articles at Journal of Analytical & Bioanalytical Techniques
Abstract
A screen-printed electrode based on a graphite and polyurethane composite (SPGPU) was used in the determination of epinephrine (EP) in cerebral synthetic fluid (CSF) sample. Both Differential Pulse Voltammetry (DPV) and Square Wave Voltammetry (SWV) were used to investigate the suitability of sensor for determination of EP. Under the optimum conditions, the analyte oxidation signal was observed at 0.17 and 0.080 V for DPV and SWV, respectively (vs. pseudo-Ag¦AgCl) in phosphate buffer (pH=7.4). A linear region between 0.10 and 1.0 µmol L-1 was observed in DPV, with detection limit of 6.2 × 10⁻⁷ mol L-1 (R=0.997). In SWV two linear ranges were observed, the first one between 0.10 and 0.80 µmol L-1 and the second from 1.0 to 8.0 µmol L-1 with limit of detection 9.5 × 10⁻⁸ and 6.0 × 10⁻⁷ mol L-1 (R=0.998) respectively. Recoveries of 99 to 100% were observed using the sensor for determination of epinephrine in the CSF. Interference tests showed that uric and ascorbic acids as well as dopamine increase the current of epinephrine, with acceptable levels for UA. The use of a standard addition of EP in the CSF solution containing the ascorbic acid allowed minimizing such interference.
Keywords
Epinephrine; Screen printed electrode; Graphitepolyurethane composite; Dopamine
Introduction
Catecholamines control many processes in the body. The interest in the study of such compounds is due to fact that they are connected to the neurotransmitting process and associated with the Parkinson and Alzheimer diseases [1]. Thus, studies regarding determination of this analyte are of utmost importance.
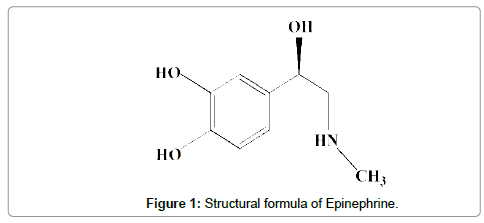
Epinephrine (EP, Figure 1) is one of the members of this group present in sympathetic nervous system and synthesized by adrenal glandule, acting when the individual is subjected to strong emotions and whose main function is reducing the amount of blood in peripheral circulation, transferring the blood flow for other organs as heart, brain, liver and kidneys [2].
Despite their importance as neurotransmitter, the amount of catecholamines present in organism can induce a series of diseases, for example, in high concentrations can cause diabetes, trauma in central nervous system and arterial hypertension, in low concentrations can induce cognition and memorization problems and even schizophrenia [1].
Several analytical methods have been developed and employed in the determination of EP. Examples are those involving high performance liquid chromatography (HPLC) [3,4], extraction prior of fluorometric detection [5], solid-phase extraction for liquid chromatography [6], solid-phase extraction combined with LCMS/ MS [7], chemiluminescence [8], solid phase reactor based on molecularly imprinted polymer (MIP) [9] and others. Usually these techniques result in low analytical frequencies requiring complex sample preparation and generation of relatively large amounts of waste.
In a general sense, electroanalytical methods present many advantages in the determination of electroactive substances such as analyzing small volumes of samples, faster analysis time, among others. They are also used for the determination of EP with hundreds of proposed procedures and strategies of electrode modifications. Some representative examples of these determinations are summarized in Table 1.
| Electrode | Modification | Linear Range (mmol L-1) | LOD (mol L-1) | Reference |
|---|---|---|---|---|
| Paste Carbon | Pre-anodized | 0.2-400 | 6.2x10⁻⁸ | [10] |
| Nanotube Carbon Paste | Au | 10-150 | 2.8x10⁻⁶ | [11] |
| Carbon Paste | Pristine Multi-Walled Carbon Nanotubes | 0.1-1.0 and 1.0- 100 | 4.5x10⁻⁸ | [12] |
| Nanotubes Carbon Paste | Poly(Serine)/Multi-Walled | 1-220 | 6.0x10⁻⁷ | [13] |
| Glassy Carbon | Composite Film of MnO2 and Nafion | 0.03-10 and 10-100 |
5.0x10⁻⁹ | [14] |
| Glassy Carbon | Au-nanoparticle poly-fuchsine acid film | 0.5-792.7 | 1.0x10⁻⁸ | [15] |
| Screen Printed Electrodes | Oxidized Single-Wall Carbon Nanohorns (o-SWCNHs) | 2-2500 | 1.0x10⁻⁷ | [16] |
| Carbon Nanotube | Multiwalled Carbon Nanotubes (MWCNTs) in a Chitosan Matrix |
10-100 | 9.0x10⁻⁷ | [17] |
| Carbon Paste | Multi-walled carbon nanotube | 10-100 and 0.5-10 |
2.9x10⁻⁸ | [18] |
| Glassy Carbon | Polypyrrole/multi-walled carbon nanotube | 0.1-8.0 and 10-100 | 4.0x10⁻⁸ | [19] |
| Screen-Printed Electrodes (SPE) | Graphite and Polyurethane Composite (SPGPU) | 0.1-1.0 and0.1-0.8 | 6.23x10⁻⁷ and 9.51x 10⁻⁸ | This work |
Table 1: Comparison of some analytical characteristics of the proposed method with other examples of electrochemical procedures found in the literature.
On top of these advantages, screen-printed electrodes (SPE) present, suitability for automation procedures associated to higher reliability and repeatability [20,21] with a so low cost that they are disposable. Furthermore the preparation and modification of the ink with others materials such as metals, enzymes, polymers, nanomaterials and complexing agents increase the selectivity and sensibility of sensor in the determination of several analytes.
In this work the use of a screen-printed electrode based on a graphite and polyurethane composite (SPGPU) is presented as an electroanalytical sensor in the determination of EP in cerebrospinal synthetic fluid. The same sensor has been earlier evaluated with satisfactory results in electroanalytical determination of acetaminophen [22], simultaneous determination of acetaminophen and caffeine [23] and simultaneous determination of Zn(II), Pb(II), Cu(II), and Hg(II) in ethanol fuel using the SPGPU modified with organofunctionalized SBA-15 silica [24].
The ink used in this work is based on the same graphite-polyurethane composite previously used as conventional disk working electrode in the determination of many analytes, as recently reviewed [25] while here the material was used to construct the printed device as well as the electrical contacts of the SPE.
Experimental
Reagents and solutions
All solutions were prepared with water purified in a BarnsteadTM EasyPure© RoDi (Thermoscientific, model D13321) system with resistivity ≥ than 18 MΩ cm. The EP used was of analytical grade (Sigma-Aldrich, Germany). A stock 1.0 × 10⁻⁴ mol L-1 solution was prepared daily by dissolving the analyte in 0.1 mol L-1 phosphate buffer pH 7.4 and protect of light.
Apparatus
Voltammetric experiments were performed in an AUTO-LAB PGSTAT-30 (Ecochemie, The Netherlands) potentiostat/galvanostat coupled to a personal computer and controlled with a GPES 4.9 software.
Preparation of the screen-printed electrodes
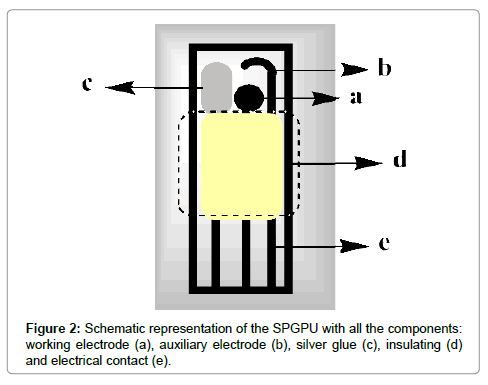
The SPGPU was prepared as previously described Saciloto et al. [26]. The graphite-polyurethane composite (60%, graphite m/m) was used to prepare the components of the screen-printed electrodes as working and auxiliary electrodes as well as in the electrical contacts of the printed device. As already discussed [27], the composite does not respond in graphite contents lower than 50% (m/m) and it is not physically resistant in graphite contents higher than 70% (m/m). The best signals can be found using 60% (graphite, m/m). Briefly, the process consists in forcing the ink composed by composite GPU and solvent to pass through a mask to be deposited on a PVC plate (0.5 mm thickness). So, this set is partly covered by a layer of pure PU resin, used as insulation to define the area of electrical contact at one end. At the other end, there was another uncoated area to define the active area allowing the electrodes to be exposed. To one of the imprints it was attached a strip of silver epoxy (Conductive Silver Epoxy Kit, Electron Microscopy Sciences, USA) to serve as a pseudo-reference electrode (Figure 2).
After curing of the polymers and concluded the assembling step the electrodes were activated by cycling between -0.8 to +1.2 V (vs Ag�??AgCl), in 0.10 mol L-1 buffer phosphate pH 7.4, with 150 cycles at 200 mVs-1 scan rate.
Procedures for preparation of the cerebrospinal synthetic fluid
For determination of EP, a 250.0 mL solution of the cerebrospinal synthetic fluid (CSF) was prepared according to Oser [28] and Zhang et al. [29] as described in Table 2, containing the major constituents of the biologic fluid. This solution was spiked with EP and the pH adjusted for 7.4. The solution was immediately used after preparation to avoid the hydrolysis of the urea.
| Substance | Amount/g |
|---|---|
| NaCl | 2.10 |
| KCl | 0.07 |
| CaCl2 | 0.08 |
| Glucose | 0.20 |
| NaHCO3 | 0.40 |
| Urea | 0.002 |
Table 2: Composition of the CSF for the biologic analysis, amount of each component in 250.0 mL [28,29].
Optimization of the DPV and SWV parameters
The experimental parameters for DPV and SWV were optimized in 0.1 mol L-1 phosphate buffer pH 7.4, containing 5.0 × 10⁻⁵ mol L-1 de EP.
For the DPV, the scan rates ranged from 10 to 50 mV s -1 and pulse amplitude between 10.0 and 100 mV in potential a window -0.25 to +0.20 V (vs. pseudo-Ag�??AgCl). In SWV the potential window used was -0.12 to +0.40 V (vs. pseudo-Ag�??AgCl), scan rate ranged from 10 to 50 mV s-1, frequency 8.0 to 50 s-1, scan increment 2.0 to 20 mV and amplitude between 10.0 to 100 mV.
Effect of the pH in redox process of EP
The experiments were realized using cyclic voltammetry in 0.1 mol L-1 phosphate buffer with pH varying of 0.5 unit between 5.0 to 8.0 in the presence of 1.00×10⁻⁴ mol L-1 epinephrine.
Interference studies
Interference studies were performed using substances with biological relevance as uric acid, ascorbic acid and dopamine at SPGPU in 0.1 mol L-1 phosphate buffer pH 7.4. In these studies, the peak current of 4.0 × 10⁻⁷ mol L-1 of epinephrine was compared with those obtained in the presence of 2.0, 4.0 and 8.0 10-7 mol L-1 of each potential interfering specie.
Results and Discussion
Electrochemical behavior of epinephrine at SPGPU
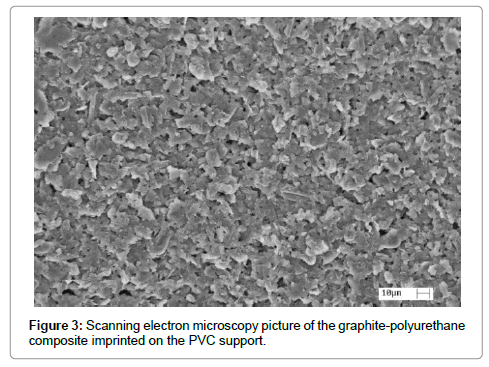
The morphology of the imprinted layer of the polymer can be observed in the SEM image in Figure 3. In which a homogeneous distribution of the particles of the composite can be noticed with average size in the 10 μm order as well as several porous inherent from the imprinting process and solvent evaporation. The diameter of the working electrode is presented in experimental section as 3 mm and the thickness of the composite layer is defined by the imprinting mask as 100 μm.
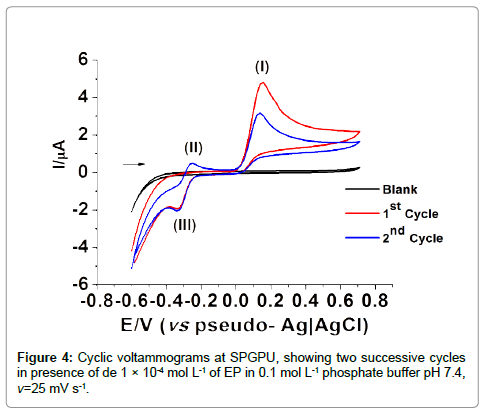
Figure 4 presents the cyclic voltammograms at SPGPU in 0.1 mol L-1 phosphate buffer pH 7.4 after the activation of electrode in potential window -0.80 to +1.2 V, at 200 mV s-1 scan rate during 150 cycles, in the presence of 1 × 10⁻⁴ mol L-1 of EP. The first peak in 0.15 V generates a product that presents a reversible redox couple of peaks II/ III in -0.25/-0.33 V (vs. pseudo-Ag�??AgCl) associated to the presence of epinephrinechrome and leucoepinephrinechrome [30,31].
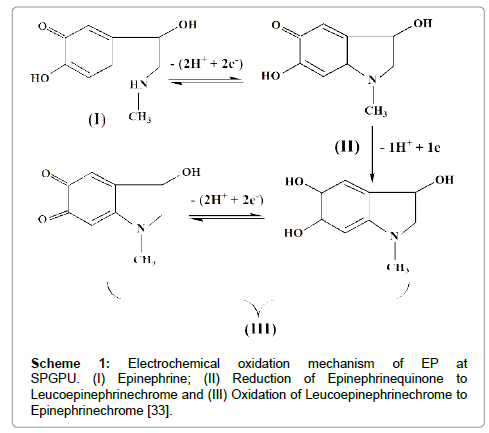
The mechanism of EP oxidation was proposed by Hawley and Kim et al. as represented in Scheme 1 [32,33].
According to the literature [34] the peak I represents the oxidation of EP, which involves two electrons and two protons producing epinephrinequinone (peak II). The oxidation-reduction involving the couple of peaks II/III corresponds to the electron transferring process that occurs via cyclization of leucoepinephrinechrome to epinephrinechrome. Because of signal intensity the peak I in 0.15 V (vs pseudo-Ag�??AgCl) was chosen for further detailed studies of electrochemical determination of EP, being the potential window set at -0.25 to 0.20 V and -0.12 to 0.40 V (vs pseudo-Ag�??AgCl) in DPV and SWV respectively.
The same process was observed in other studies for determination of the EP using sensor based on carbon nanotube film modified carbon electrodes [17] and electrochemical studies of oxidation of catecholamines [32].
Effect of the pH in redox process of EP
The effect of pH in redox process of the EP at SPGPU was investigated by studying the dependence of EP oxidation peak potential with the pH. The experiments were performed by cyclic voltammetric with the values of pH varying of 0.5 unit between 5.0 to 8.0 in the presence of 1.0 × 10⁻⁴ mol L-1 EP solutions. Figure 5 shows the dependence of the anodic peak current and the peak potential with of pH.
The curve of Ipa vs. pH revealed that the peak of anodic current have a maximum value in pH=7.5, decreasing in higher pH values. This is explained considering the oxidation-reduction mechanism of the EP, presented in Scheme 1. The oxidation process involves the liberation of 2H+/molecule that is injured in acid medium. On the other hand EP presents a pKa=8.88 [12], and in higher pH values the increasing concentration of the non-electroactive deprotonated form, causes a decrease in peak current. The physiologic pH of the cerebrospinal fluid for healthy individuals is approximated of 7.4, that corresponding to the region of maximum current in Figure 5, thus this pH 7.4 was chosen for the further experiments.
Analytical curve for epinephrine
After optimizing of the experimental conditions for DPV the potential interval of -0.25 to +0.20 V (vs. pseudo-Ag�??AgCl) was chosen due to the presence of an irreversible and more intense peak near to 0.17 V (vs. pseudo-Ag�??AgCl) relative to epinephrinequinone oxidation.
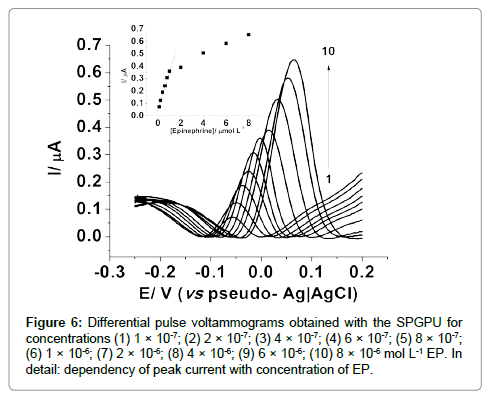
An analytical curve was thus obtained using 50 mV pulse amplitude and 10 mV s-1 scan rate for concentrations between 0.10 to 8.0 μmol L-1 as presented in Figure 6, with linear response between 0.10 to 1.0 μmol L-1, represented by Equation 1:
ΔI =5.377×10⁻⁸ (μA) + 0.313(μAμmol-1 L)×CEpineprine (1)
Figure 6: Differential pulse voltammograms obtained with the SPGPU for concentrations (1) 1 �? 10-7; (2) 2 �? 10-7; (3) 4 �? 10-7; (4) 6 �? 10-7; (5) 8 �? 10-7; (6) 1 �? 10-6; (7) 2 �? 10-6; (8) 4 �? 10-6; (9) 6 �? 10-6; (10) 8 �? 10-6 mol L-1 EP. In detail: dependency of peak current with concentration of EP.
The correlation coefficient obtained was 0.997 and a detection limit of 6.23×10⁻⁷ mol L-1 calculated as three times the standard deviation of the background divided by the slope of the linear curve [35] and a limit of quantification 2.07 ×10⁻⁶ mol L-1 calculated as 10 times the background standard deviation divided by the slope of the straight line.
It is important to note that there is a displacement in the peak potential (Figure 5) while increasing the analyte concentration, so currents were taken at the higher values, in the respective peak potential. In addition for concentrations higher than 1.0 μmol L-1 saturation of electrode surface, resulting in non-linear responses were observed.
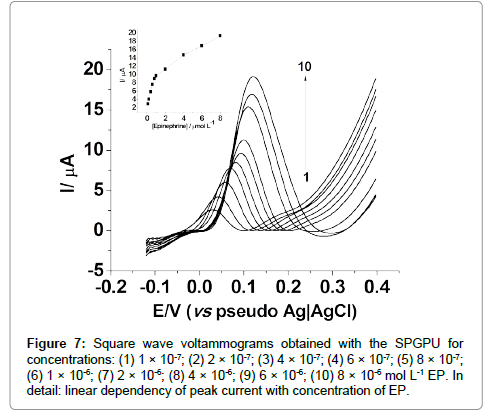
In SWV, an analytical curve was obtained in the potential interval of -0.12 a +0.40 V (vs pseudo-Ag�??AgCl), 35 mV s-1 scan rate; 5 mV step potential, 8 s-1 frequency and 50 mV amplitude. The analytical curve presented two linear regions, being most sensitive the first one between 0.10 μmol L-1 to 0.80 μmol L-1 as shown in Figure 7, represented by the Equation 2:
ΔI = 2.276×10⁻⁷ (μA) + 0.871(μAμmol-1 L)×CEpineprine (2)
Figure 7: Square wave voltammograms obtained with the SPGPU for concentrations: (1) 1 �? 10-7; (2) 2 �? 10-7; (3) 4 �? 10-7; (4) 6 �? 10-7; (5) 8 �? 10-7; (6) 1 �? 10-6; (7) 2 �? 10-6; (8) 4 �? 10-6; (9) 6 �? 10-6; (10) 8 �? 10-6 mol L-1 EP. In detail: linear dependency of peak current with concentration of EP.
The first region presented a correlation coefficient of 0.998, with detection limit of 9.51 × 10⁻⁸ mol L-1 and a limit of quantification 3.17×10⁻⁷ mol L-1. The second one presented a correlation coefficient of 0.998, with a detection limit of 6.00×10⁻⁷ mol L-1. Thus for analytical purposes the first linear range will be considered.
The presence of two linear regions in the analytical curves from both techniques suggests a competition by the active sites of the electrode above a certain concentration, probably provoked by the turnover on these active sites occupied by the electroactive molecules, once the kinetics of electron transfer is relatively slow, in an irreversible process.
Interferences study
To investigate the chemical interference in the EP analytical signal the effect of substances usually present in biologic fluids was evaluated using a fixed 4 × 10⁻⁷ mol L-1 EP solution in the presence of varying concentrations of uric (UA) and ascorbic (AA) acids and dopamine (DA), as detailed in Table 3.
| Technique | Interferant/μmol L-1 | Epinephrine signal/μA | Interference/% | |
|---|---|---|---|---|
| DPV | AA | 0.20 | 0.142 | 350 |
| 0.40 | 0.152 | 317 | ||
| 0.80 | 0.152 | 394 | ||
| DA | 0.20 | 0.450 | 220 | |
| 0.40 | 0.675 | 380 | ||
| 0.80 | 0.932 | 562 | ||
| UA | 0.20 | 0.113 | 1.49 | |
| 0.40 | 0.124 | 8.20 | ||
| 0.80 | 0.111 | 2.54 | ||
| SWV | AA | 0.20 | 0.0296 | 40.2 |
| 0.40 | 0.193 | 291 | ||
| 0.80 | 0.160 | 222 | ||
| DA | 0.20 | 0.737 | 362 | |
| 0.40 | 1.39 | 729 | ||
| 0.80 | 1.54 | 868 | ||
| UA | 0.20 | 0.171 | 3.60 | |
| 0.40 | 0.160 | 9.84 | ||
| 0.80 | 0.164 | 7.65 | ||
Table 3: Effect of interfering in the presence of 0.40 mmol L-1 of Epinephrine.
Severe interference from AA and DA while acceptable interference levels were observed for UA was observed in both techniques. The increase in peak current of the EP in presence of these interferants suggests a superposition of redox process involving both the analyte and the interfering species at similar potentials. The interference from AA was overcome by standard addition of the EP in CSF solutions containing the ascorbic acid.
Determination of epinephrine in sample of cerebrospinal synthetic fluid (CSF)
Table 4 presents the results of recoveries of EP in CSF using the SPGPU.
| Technique | Addition | Ep/µmol L-1 | Recovery/% | |
|---|---|---|---|---|
| Added | Found | |||
| DPV | 1 | 0.100 | 0.103 | 103 |
| 2 | 0.150 | 0.149 | 99.3 | |
| 3 | 0.200 | 0.198 | 99.0 | |
| average | 100 ± 2* | |||
| SWV | 1 | 0.150 | 0.145 | 97.3 |
| 2 | 0.200 | 0.198 | 99.3 | |
| 3 | 0.250 | 0.253 | 101 | |
| Average | 99.3 ± 4* | |||
Table 4: Cytotoxic activity of the volatile oil and total extract of Salvia macrosiphon.
These results are comparable to that using edge plane pyrolytic graphite electrode modified with nanotubes for determination of EP in samples of blood and urine. This study showed recoveries of 97-104% [36]. The results obtained showed that the EIGPU can be used as sensor electroanalytical in the determination of EP in biologic samples with good results regarding recoveries.
These devices are supposed to be disposable due to its relatively low cost and have demonstrated to be stable for a relatively large period of time, at least 2 years, after production. After electrochemical pretreatment the devices are being used in our lab for more than 50 measurements, at least.
Conclusions
The composite SPGPU presented a satisfactory limit of detection and recoveries when compared to the literature and the possibility of determining EP in cerebral synthetic fluid using DPV and SWV in a simple, low cost and waste generation procedure in a disposable device even in the presence of AA and interference from UA and DA.
Acknowledgements
The authors are indebted to the Brazilian agencies CNPq and FAPESP.
References
- Grossman M, Glosser G, Kalmanson J, Morris J, Stern MB, et al. (2001) Dopamine supports sentence comprehension in Parkinson��?s Disease. J Neurol Sci 184:123-130.
- Hoffman BB (2004) Cathecolamines:Encyclopedia of Endocrine Diseases. Amsterdam: Academic Press, p: 480.
- Silva DAF, Menezes ML, Kempinas WG (2007) A new method for simultaneous determination of catecholamines in reproductive organs from rats by high performance liquid chromatography with electrochemical detection. Ecletica Quim 32:35-42.
- Carrera V, Sabater E, Vilanova E, Sogorb MA (2007) A simple and rapid HPLC��?MS method for the simultaneous determination of epinephrine, norepinephrine, dopamine and 5-hydroxytryptamine: Application to the secretion of bovine chromaffin cell cultures. J Cromatography B 847:88-94.
- Davletbaeva P, Falkova M, Safonova E, Moskvin L, Bulatov A (2016)Flow method based on cloud point extraction for fluorometric determination of epinephrine in human urine. Anal Chim Acta 911:69-74.
- Woo HI, Yang JS, Oh HJ, Cho YY, Kimd JH, et al. (2016) A simple and rapid analytical method based on solid-phase extraction and liquid chromatography-tandem mass spectrometry for the simultaneous determination of free catecholamines and metanephrines in urine and its application to routine clinical analysis. Clin Biochem 49:573-579.
- Li XS, Li S, Kellermann G (2016)Pre-analytical and analytical validations and clinical applications of a miniaturized, simple and cost-effective solid phase extraction combined with LC-MS/MS for the simultaneous determination of catecholamines and metanephrines in spot urine samples. Talanta 159:238-247.
- Li T, Wang Z, Xie H, Fu Z (2012) Highly sensitive trivalent copper chelate-luminol chemiluminescence system for capillary electrophoresis detection of epinephrine in the urine of smoker. J Chromatogr B Analyt Technol Biomed Life Sci 911:1-5.
- Sartori LR, Santos WJR, Kubota LT, Segatelli MG, Tarley CRT (2011)Flow-based method for epinephrine determination using a solid reactor based on molecularly imprinted poly(FePP��?MAA��?EGDMA). Mat Sci and Eng C 31:114-119.
- Li J, Shangguan E, Guo D, Gao F, Li Q, et al. (2015) Influence of acidity and auxiliary electrode reaction on the oxidation of Epinephrine on the pre-anodized carbon paste electrode. Electrochim Acta 186:209-215.
- Wierzbicka E, Szultka-Mlynska M, Buszewskib B, Sulka GD (2016) Epinephrine sensing at nanostructured Au electrode and determination its oxidative metabolism. Sens and Act B 237:206-215.
- Thomas T, Mascarenhas RJ, D'Souza OJ, Detriche S, Mekhalif Z, et al. (2014) Pristine multi-walled carbon nanotubes/SDS modified carbon paste electrode as an amperometric sensor for epinephrine. Talanta 125:352-360.
- Narayana PV, Reddy TM, Gopal P, Reddy MM, Naidu GR (2015)Electrocatalytic boost up of epinephrine and its simultaneous resolution in the presence of serotonin and folic acid at poly(serine)/multi-walled carbon nanotubes composite modified electrode: A voltammetric study. Mat Sci and Eng C 56:57-65.
- Liu X, Ye D, Luo L, Ding Y,Wanga Y, et al. (2012) Highly sensitive determination of epinephrine by a MnO2/Nafion modified glassy carbon electrode. J Electroanal Chem 665:1-5.
- Taei M, Hasanpour F, Tavakkoli N, Bahrameian M (2015) Electrochemical characterization of poly(fuchsine acid) modified glassy carbon electrode and its application for simultaneous determination of ascorbic acid, epinephrine and uric acid. J MolLiq 211:353-362.
- Valentini F, Ciambella E, Conte V, Sabatini L, Ditaranto N, et al. (2014) Highly selective detection of Epinephrine at oxidized Single-Wall Carbon Nanohorns modified Screen Printed Electrodes (SPEs). Biosens and Bioelectron 59:94-98.
- Ghica ME, Brett CMA (2013) Simple and efficient Epinephrine sensor based on carbon nanotube modified carbon film electrodes. Anal Lett 46:1379-1393.
- Thomas T, Mascarenhas RJ, Martis P, Mekhalif Z, Swamy BEK (2013) Multi-walled carbon nanotube modified carbon paste electrode as an electrochemical sensor for the determination of epinephrine in the presence of ascorbic acid and uric acid. Mat Sci and Eng C 33:3294-3302.
- Shahrokhiana S, Saberib RS (2011) Electrochemical preparation of over-oxidized polypyrrole/multi-walled carbon nanotube composite on glassy carbon electrode and its application in epinephrine determination. Electrochim Acta 57:132-138.
- Alonso-Lomillo MA, DomÃnguez-Renedo O, Arcos-MartÃnez MJ (2010) Screen-Printed biosensors in microbiology: A Review. Talanta 82:1629-1636.
- Barry RC, Lin Y, Wang J, Liu G, Timchalk CA (2009) Nanotechnology based electrochemical sensors for biomonitoring chemical exposures. JExpo Sci Environ Epidemiol 19:1-18.
- Saciloto TR, Cervini P, Cavalheiro ETG (2013) New Screen printed electrode based on graphite and polyurethane composite for the determination of acetaminophen. Anal Lett 46:312-322.
- Saciloto TR, Cervini P, Cavalheiro ETG (2013) Simultaneous voltammetric determination of acetaminophen and caffeine at a graphite and polyurethane screen-printed composite electrode. J Braz Chem Soc 24:1461-1468.
- Saciloto TR, Cervini P, Cavalheiro ETG (2014) Simultaneous voltammetric determination of Zn (II), Pb (II), Cu (II) and Hg (II) in ethanol fuel using an organofunctionalized modified graphite-polyurethane composite disposable screen-printed device. Electroanal 26:1-14.
- Cavalheiro ETG, Brett CMA, Oliveira-Brett AM, Fatibello-Filho O (2012) Bioelectroanalysis of pharmaceutical compounds. Bioanal Rev 4:31-53.
- Saciloto TR, Cervini P, Cavalheiro ETG (2012) Tinta e processo para preparação de eletrodos impressos descartáveis a base de um compósito de grafite e poliuretana eletrodo obtido pelo referido processo. Br PI 104: 355.
- Mendes RK, Claro-Neto S, Cavalheiro ETG (2002) Evaluation of new rigid carbon-castor oil polyurethane composite as an electrode material. Talanta 57:909-917.
- Oser BL (1952) Hawk��?s Physiological Chemistry. TATA McGraw-Hill, New Delhi, p: 1054.
- Zhang F, Yang L, Shuping B, Liu J, Liu F, et al. (2001) Neurotransmitter dopamine applied in electrochemical determination of aluminum in drinking waters and biological samples. J Inorg Biochem 87:105-115.
- Luczak T (2009) Epinephrine oxidation in the presence of interfering molecules on gold and gold electrodes modified with gold nanoparticles and thiodipropionic acid in aqueous solution. A comparative study. Electroanalysis 21: 2557-2562.
- Mang D, Yueming Z,Xizhen L, Hongbin Z, Zhenzhen W, et al. (2016) An electrochemical sensor based on graphene/poly(brilliant cresyl blue) nanocomposite for determination of epinephrine. J Electrochem Soc 763:25-31.
- Hawley MD, Tatawadi SV, Piekarski S, Adams RN (1967) Electrochemical studies of oxidation pathways of cathecolamines. J Am Chem Soc 89:447-450.
- Kim SH, Lee JW, Yeo IH (2000) Spectroelectrochemical and electrochemical behavior of epinephrine at a gold electrode. Electrochim Acta 45:2889-2895.
- Wierzbicka E, Szultka-Mlynska M, Buszewskib B, Sulka GD (2016) Epinephrine sensing at nanostructured Au electrode and determination its oxidative metabolism.Sens and Act B 237:206-215
- Long GL, Winefordner JD (1983) Limit of detection. Anal Lett 55:712-724.
- Goyal RN, Bishnoi S (2011) Simultaneous determination of epinephrine and norepinephrine in human blood plasma and urine samples using nanotubes modified edge plane pyrolytic graphite electrode. Talanta 84:78-83.
Relevant Topics
Recommended Journals
Article Tools
Article Usage
- Total views: 3347
- [From(publication date):
February-2017 - Jul 18, 2024] - Breakdown by view type
- HTML page views : 2608
- PDF downloads : 739

