Research Article Open Access
Determination of Effects of Sample Processing on Hibiscus sabdariffa L. Using Tri-step Infrared Spectroscopy
Yew-Keong Choong1*, Nor Syaidatul Akmal Mohd Yousof1, Mohd Isa Wasiman1, Jamia Azdina Jamal2 and Zhari Ismail3
1Phytochemistry Unit, Herbal Medicine Research Centre, Institute for Medical Research, Jalan Pahang, 50588 Kuala Lumpur, Malaysia
2Drug and Herbal Research, Faculty of Pharmacy, UKM, Bangi, Selangor, Malaysia
3School of Pharmaceutical Science, USM, Gelugor, Penang, Malaysia
- *Corresponding Author:
- Yew-Keong Choong
Phytochemistry Unit, Herbal Medicine
Research Centre, Institute for Medical Research
Jalan Pahang, 50588 Kuala Lumpur, Malaysia
Tel: 0326162623
Fax: 0326938210
E-mail: yewkeong11@yahoo.co.uk
Received date: August 04, 2016; Accepted date: August 23, 2016; Published date:August 30, 2016
Citation: Choong YK, Yousof NSAM, Wasiman MI, Jamal JA, Ismail Z (2016) Determination of Effects of Sample Processing on Hibiscus sabdariffa L. Using Tri-step Infrared Spectroscopy. J Anal Bioanal Tech 7: 335. doi: 10.4172/2155-9872.1000335
Copyright: © 2016 Choong YK, et al. This is an open-access article distributed under the terms of the Creative Commons Attribution License, which permits unrestricted use, distribution, and reproduction in any medium, provided the original author and source are credited.
Visit for more related articles at Journal of Analytical & Bioanalytical Techniques
Abstract
Hibiscus sabdariffa tea is a widely used medicinal beverage and a treatment for high blood pressure and high blood cholesterol in many parts of the world. Many studies on H. sabdariffa have been conducted including extraction and identification of main biocompounds. However, information on the effects of processing the plant is scarce. This is important as sample processing procedure influence the composition of the end product. Hence, the main objective of this present study was to examine the effect of sample processing (non-extracted, ethanol extract and water extract) on H. sabdariffa composition. Fourier Transform Infrared (FTIR) was used for the process of identification. The powdered sample of H. sabdariffa (FT34) was obtained from a local company in Peninsula Malaysia. A fresh sample obtained from the same company was processed in the Phytochemistry Laboratory, Institute for Medical Research and labelled as FT35. Sample and potassium bromide (KBr) were mixed (1:250) to form a 1-2 mm transparent disk under 9.80 psi in vacuum. The FTIR Spectra were recorded with 32 scans and 0.2 cms-1 OPD speed. Spectra of FT34 and FT35 raw samples indicated obvious differences in the range of 1500-1135 cm-1. The FT34 ethanol extract using trifluoroacetic acid (TFA) showed that the peak at 1629 cm-1 was the highest in the range of 1800-1500 cm-1, whereas for FT35, the highest peak was 1739 cm-1. The peak at 1071 cm-1 of FT35 was the only one compatible to standard dephinidin-3-O-sambubioside and cyanidin-3-Osambubioside which are used for qualification of sample content. In fact, both standards showed up as different chromatographs in thin layer chromatography. Water extract of FT35 showed a peak at 1676 cm-1 which was not detected in water extract spectrum of FT34, while the pattern of spectrum varied within the range of 1300-400 cm-1. Second derivative spectra enhanced the comparable base peaks of both sample and the target standards. There were five matched ethanol extract base peaks, indicating the macrofingerprint of H. sabdariffa. Two dimensional correlation spectrum of FT34 raw powder showed different correlation spot especially in the cluster of 1425 cm-1 to 1743 cm-1 compared with FT35. The three-stage infrared spectroscopy comprehensively analysed the holographic spectra and hierarchically characterized the integrated constituents involved.
Keywords
Hibiscus sabdariffa; Sample processing; Tri-step infrared
Introduction
Hibiscus sabdariffa Linn has been well known in Malaysia as roselle with reddish calyces resembles blossom of roses [1]. The taste is sour and known as “Asam paya” locally. This plant is classified under the Family Malvaceae and is an annual dicotyledonous herbaceous shrub [2]. This plant thrives in Malaysia because of its strong adaptive growth in multi-type of soils except clay. Each cycle of planting requires 85 days for first harvest and the same plant could be harvested for more than 5 times. However, the harvest yield is reduced during the raining season.
Phytochemical study on roselle has revealed its main chemical composition [2]. The presence of phenolics content in the plant consists mainly of anthocyanins especially delphinidin-3-O-glucoside, delphinidin-3-O-sambubioside, and cyanidin-3-O-sambubioside which could be the therapeutic marker of roselle [3]. Typical bioactive roles of this natural substances and the synergistic effect with other correlated components provide promising medicinal potential for the therapy of infection and lower the blood pressure [4], lower blood cholesterol level [5] as well as lower overweight [6]. Its broad range of therapeutic effect has been shown in many studies.
Manufactory of roselle products is rightly focussed on instead of the raw materials seems products preformed higher commercial value. However, information on the effects of processing the plant is scarce. This is important as sample processing really influence the composition of the end product(s). There are many factors that interfere with the quality of roselle products in Malaysia. The most common factors affecting sample processing method include temperature control in the oven, deseed procedure, additives added and human error, similar to those in food processing.
Fourier transform infrared and 2DIR correlation spectroscopy [7] has widely been used in quality control of herbal product [8] due to it is rapid and accuracy in identification. It is now recognised as one of the reliable analysis methods in pharmacopeia. Therefore, this technique was used to study roselle samples prepared using different sample processing methods.
Hence, the main objective of this present study was to examine the effect of sample processing on roselle composition (non-extracted, ethanol extract and water extract) using tri-step infrared spectroscopy.
Materials and Methods
Sample source
The powdered sample (calyces) of H. sabdariffa (FT34) was obtained from a local company in Peninsular Malaysia. The H. sabdariffa fruits from the plantation are routinely harvested and sent to the company for processing. After the deseeding and washing by the machine, after which they were immediately dried in the oven at 60°C for 3-4 days. A batch of fresh sample of roselle obtained from the same company was processed in the Phytochemistry Laboratory in Institute for Medical Research (IMR), Kuala Lumpur and labelled as FT35. This samples were deseeded with hole puncher such as cork borer. Later cleaned with water and further air dried until 80% dryness before oven dried at 40°C for 3-4 days until a constant weight was obtained. The sample was then pulverized with a blender with the finest blades to a coarsely powdered material.
Authentication
A voucher specimen (PID 050515-05) was submitted to Forest Biodiversity Unit at Forest Research Institute Malaysia (FRIM).
Ethanol extraction with trifluoroacetic acid
The dried powdered calyx of H. sabdariffa L. (250 g) was extracted three times using a mixture of 2000 ml ethanol gradient grade (LiChrosolv® Reag. Ph Eurand) and 0.1% of Trifluoroacetic acid (TFA) and sonicated for 30 minutes at room temperature (25°C). The solution was then filtered using filter paper (Whatman™, Grade 1, circle, diam. 320 mm). The accumulated filtrate was dried by using a Rotavapor™ (brand) and Mivac Concentrator™ (brand) and stored in amber vial at -20°C until used.
Water extraction with trifluoroacetic acid
The dried and powdered calyx of H. sabdariffa L. (250 g) was extracted three times using 2500 ml hot double distilled/MilliQ Water (80°C) mixed with 0.1% of Trifluoroacetic acid (TFA) and sonicated for 30 minutes at room temperature (25°C). The solution was filtered by a few layers of cotton ball (cotton wool) (China National Chemical I/E Corp) into a bottle. The accumulated water filtrate was frozen at -40°C before proceeding to freeze drying. The freeze-dried extract was stored in sample bottle at -20°C.
Apparatus: Spectrum GX Fourier-transform infrared (FTIR) spectrometer (Perkin-Elmer) with an attached DTGS detector was used as the main equipment for the whole experiment. This system was set up at a range of 4000-400 cm-1 with a resolution of 4 cm-1. Spectra were obtained after a total of 32 scans. The dynamic FTIR spectra were recorded with the above mentioned spectrometer combined with a Love Control Corporation’s portable programmable temperature Controller (Model 50-886) with a range of 50-120°C.
Procedures of making 1D and 2D FTIR spectrum: About 1 mg of roselle samples was mixed with 250 mg dehydrated potassium bromide (KBr) powder. The mixture was further processed until a thin mini disk was formed. The mini disk was positioned on the sample reservoir in the system for the spectrum capture. Spectrum was accepted when 60- 80% transmission was achieved; nonetheless the disk may be reformed by adding either more sample or KBr. The second derivative IR spectra were an intermediate 13-points smoothing of the basic IR spectra taken at room temperature.
The 2DIR spectroscopy was carried out using similar disks with thermal perturbation ranging from 30°C to 120°C. The dynamic spectra were analyzed and transformed into 2D and autopeak diagram with TD software developed by the Analysis Center of the Chemistry Department, Tsinghua University.
Results and Discussion
IR spectra of roselle samples and theirs extract
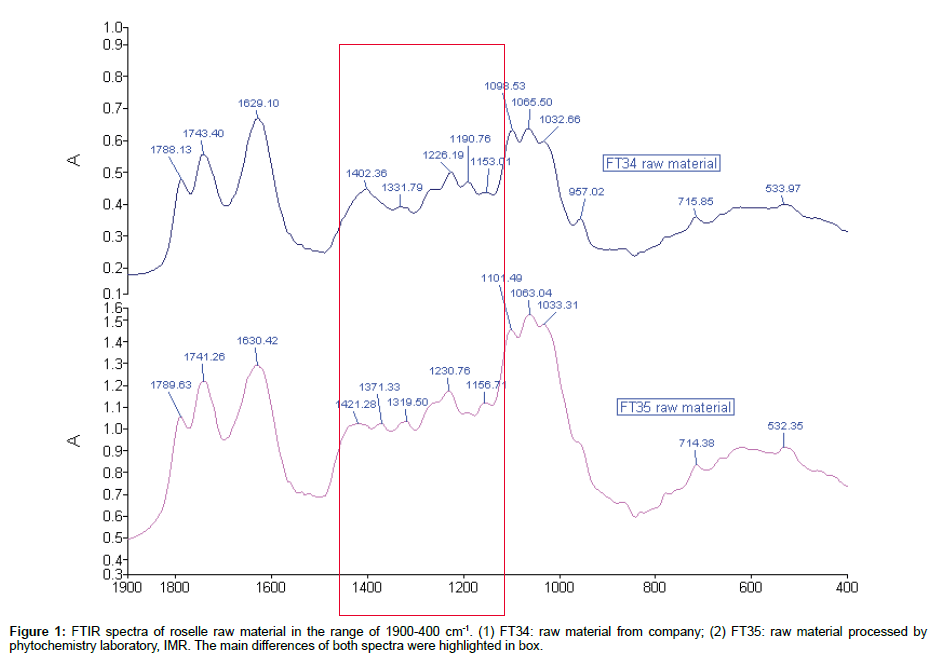
Comparison of IR spectra of roselle raw material: Owing to the uncertain quantity of sample added to KBr for more than 60% transmittance, the maximum and minimum absorbance reading of FT35 and FT34 spectrum were quantified and shown to vary within 1.1 and 0.5, respectively. Therefore the comparison was made by focussing on the width and the shape of the peaks. Both raw material extracts have similar pattern of peak from the range of 1800-1600 cm-1. The increasing sequence started from peak 1789 cm-1, 1741 cm-1 and 1630 cm-1 respectively. The strong peak at 1741/1743 cm-1 was the stretching mode of C=O in esters and the two peaks at 1230/1226 cm-1 and 1156/1153 cm-1 may be assigned to the C-O bonds. In contrast, peak 1789/1788 of both raw materials were very scarce in general spectra which was assigned to C=O in acid anhydride group. The obvious dissimilarity of both raw material spectra was located at the range of 1500-1150 cm-1. Most of the peaks in this range were different in term of their position and shape except two pairs of peaks 1226/1230 of FT 34 and 1153/1156 and FT35, respectively (Figure 1).
Table 1 showed the assignment of each peak in this region. The triple peaks of FT34 in the range of 1150-1000 cm-1 position were lower than the peak 1639 cm-1 when compared with parallel y, while, this position was opposite in FT35. The peaks below 1150 cm-1 indicated content of carbohydrate of the subject [9]. Therefore the content of carbohydrate of FT35 was more intense than FT34. In FT34, when taking 1065 cm-1 at the centre, both side peaks (1098 cm-1) were slightly higher than peak 1032 cm-1, while this condition was also opposite in FT35. However, the peak 1098 cm-1 and peak 1065 cm-1 of FT34 spectrum were clearer than peak 1032 cm-1. The peak 957 cm-1 was more clearly shown in FT34 rather than FT35. The peak 715/714 cm-1 was the band that is present in mono-, 1:3-, 1:3:5-, 1:2:3-substituted phenyls.
| Band(cm-1) | Vibration mode | Main attribution | Raw material | |
|---|---|---|---|---|
| FT34 | FT35 | |||
| 1800-1750 | R C=CH2 R |
Methylene, overtone of δ‘ CH (out of plane) | 1788 | 1789 |
| 1745 | vC=O | Ketone | 1743 | 1741 |
| 1630 | Ortho-CO-C6H4-OH | Influenced by I,M, and steric effects of substituent | 1629 | 1630 |
| 1420 | δ C-H of CH2 | Shifted lower from the usual 1470 cm-1 position because it is flanked by an aromatic ring and an acetylenic bond | - | 1421 |
| 1400 | vC=N | Coupled with v C=C | 1402 | - |
| 1370-1330 | R-SO2-N | Sulfoamide | 1371 | |
| Sulfoamide | 1331 | |||
| 1350-1310 | R-SO2-R’ | Sulfone | - | 1319 |
| 1226 | δC-H | In-plane | 1226 | 1230 |
| 1195 | vasSO3- | 1190 | - | |
| 1153 | Twist-boat form of cyclohexane | 1153 | 1156 | |
| -C-H | In-plane CH pending modes | 1098 | 1101 | |
| -C-H | In-plane CH pending modes | 1065 | 1063 | |
| 1034 | vsSO3- | 1032 | 1033 | |
| 964 | C=C | Twist of trans substituted ethylenes | 957 | - |
| 717 | Band that is present in mono-1:3-, 1:3:5-, and 1:2:3-substituted phenyls | 715 | 714 | |
| 529 | v S-S | Two polarized bands generally appear in the narrow range 525-510 cm-1 , (medium intensity) | 533 | 532 |
Table 1: The assignment of each peak in different region.
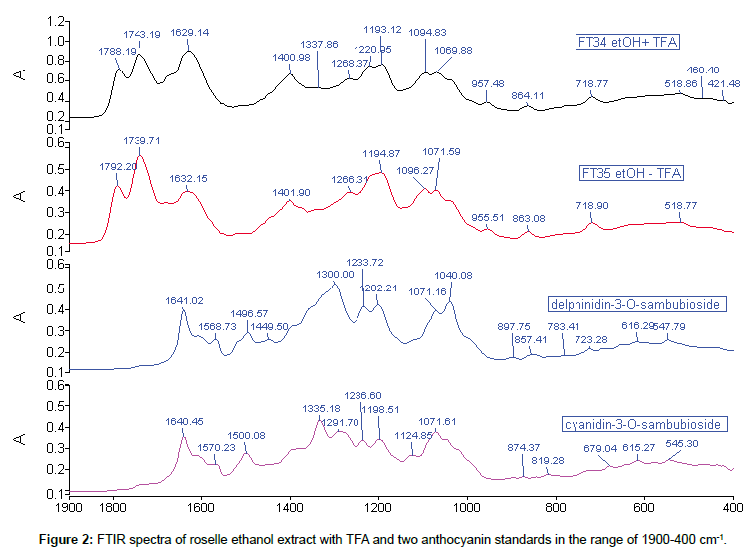
Comparison of roselle ethanol extract with TFA and standards: Comparison of the roselle ethanol extract with TFA and the anthocyanin standards was categorised into three sections: 1900- 1550 cm-1, 1549-1000 cm-1, 999-400 cm-1. The absence of any peak at the beginning section of 1900-1700 cm-1 was observed in both anthocyanin standards. For these standards, the main absorbance peaks were located in the range of 1650-900 cm-1, which was also found in the second and third sections of the ethanol extract with TFA. The appearances of peaks from 1645 until 1440 cm-1 in both standards were clear footage of their identification in the spectra. In FT34, sequence of 3 peak heights increased gradually from 1788 cm-1, while peak 1739 cm-1 of FT35 was highest between 1792 and 1632 cm-1. Only peak 1071 cm-1 of FT35 (1069 cm-1 of FT34) was comparable with standard d-3- O-sambubioside and c-3-O-sambubioside. Besides, peak 718 cm-1 of both ethanol extract matched with d-3-O-sambubioside but not c-3- O-sambubioside, indicating that most probably the content of ethanol extract with TFA consisted of d-3-O-sambubioside. The peak 1739 cm-1 and peak 1194 cm-1 of FT35 were slightly more intense than the same position of peaks in FT34 and this could be due to the different process of sample preparation (Figure 2).
The purpose of usage of TFA in the extraction was to stabilise the extracted components. There are minor differences in extraction with or without TFA in term of extracted contents based on spectroscopy analysis.
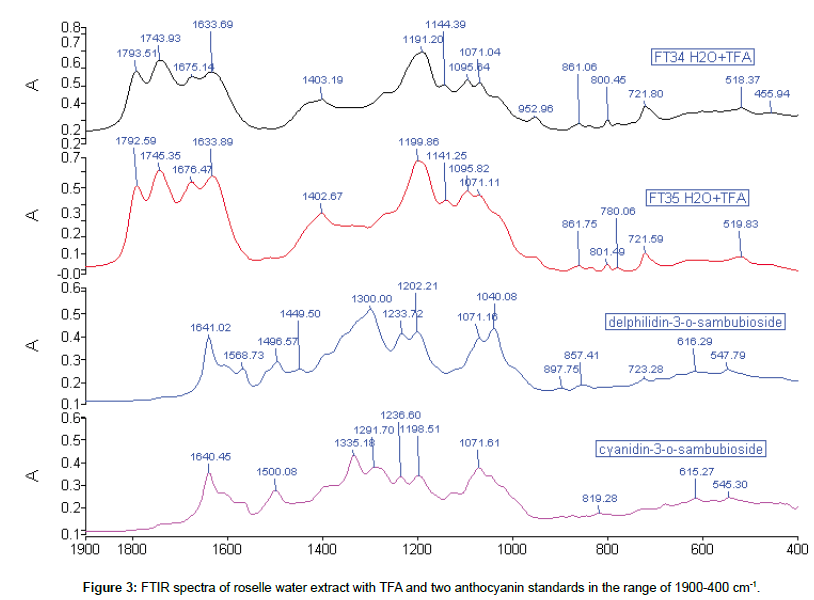
Comparison of roselle water extract with TFA and standards: The roselle water extract was oxidised when exposed to air and extraction had to be replicated until transmission of the spectrum achieved 50%. There were only four peaks in 1D FTIR spectra. The peak 1071 cm-1 was the only one appeared in each spectrum, and it was also found in the ethanol extract. Besides, the peaks around 861 and 721 cm-1 (718 cm-1 in ethanol extract) were maintained in water extract which were also associated well with both ethanol extracts and d-3-O-sambubioside. Both water and ethanol roselle extracts showed the existence of anthocyanin content (Figure 3).
Second derivation spectra of roselle sample and their extracts
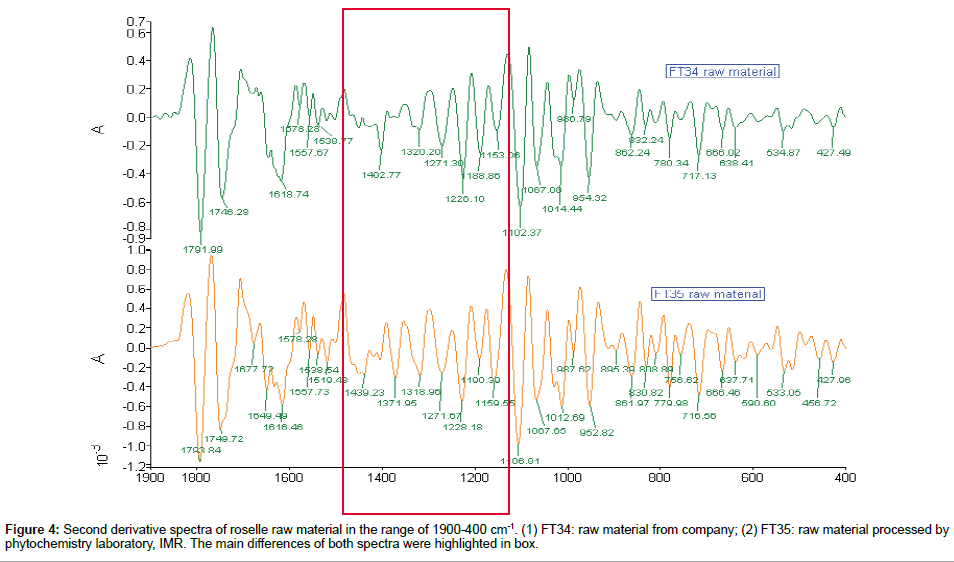
Comparison of 2nd derivative spectra of roselle raw material: The differences of both raw roselle material second derivative spectra were highlighted in Figure 4. For FT34, the range between 1402 and 1331 cm-1 of 1DFTIR has been derived into two small peaks; the peak 1402 cm-1 was reserved and peak 1320 cm-1 was shown in second derivative spectrum instead of 1331 cm-1. In contrast, similar derivative pattern was observed in FT35 for the range between 1421 and 1371 cm-1, but the peak 1439 was shown and the peak 1371 cm-1 was reserved. Hence the peak 1402 cm-1 of FT34 and peak 1371 cm-1 of FT35 were the dominant peaks for both differently processed samples. The derived peak 1320 cm-1 of FT34 was matched with shape derived peak 1318 cm-1 of FT35. Minor changes were observed in peak 1226 and 1190 cm-1 of FT34 in 2nd derivative spectra, however, the peak 1230 cm-1 of FT35 was derived to two sharp peaks in this region.
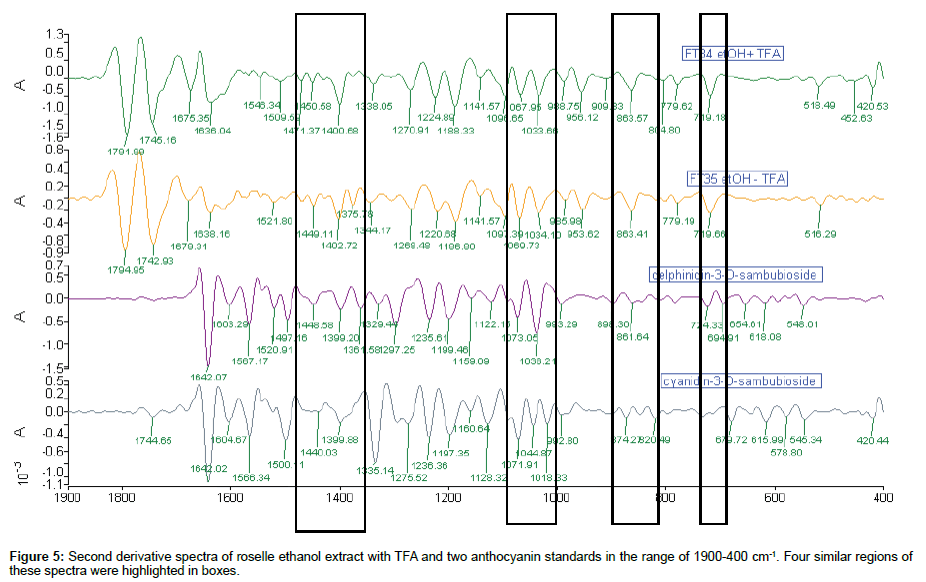
Comparison of 2nd derivative spectra of roselle ethanol extract with TFA: The similarity of 2nd derivative spectra were detected in at least four regions along the range of 1900-400 cm-1 in Figure 5. There were only two pairs of peaks associated with these four spectra, i.e., peaks around 1400 and 1071 cm-1 which were the solid evidence of the presence of anthocyanin in the content of roselle ethanol extract. Four regions of 2nd derivative spectra were matched for both roselle ethanol extract and d-3-O-sambubioside. The peak 1522 cm-1 of FT35 was matched with standard d-3-O-sambubioside spectrum. In detail, there was 14.3% matched base peak of FT34 with d-3-O-sambubioside compared to 16.7% of FT35 with d-3-O-sambubioside. On the other hand, 7.1% of matched base peak of FT34 with c-3-O-sambubioside compared to 4.8% of FT35. Even though these were not significant, nevertheless these differences indicated the dissimilarity of the content of FT34 and FT35.
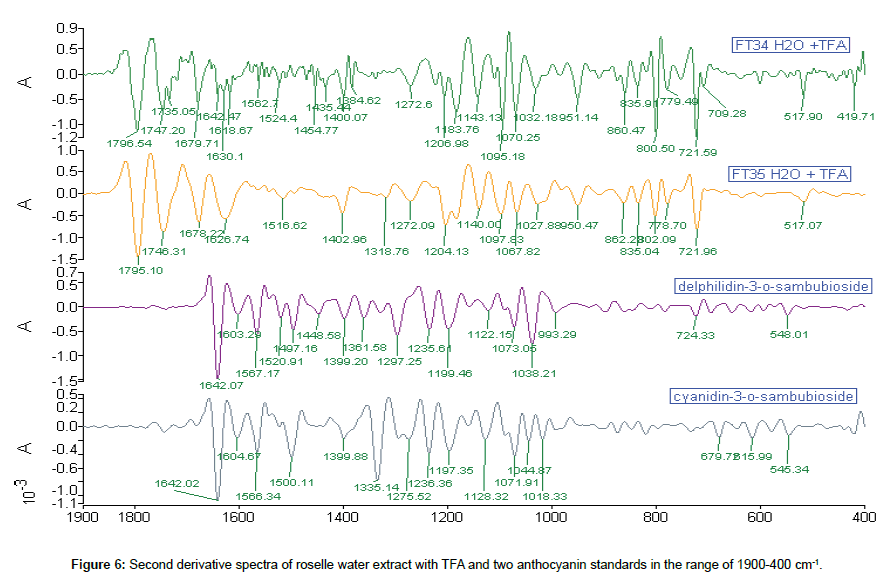
Comparison of 2nd derivative spectra of roselle water extract with TFA: More peaks were detected in 2nd derivative spectra. Eight peaks of extract matched with standards. FT34 water extract with TFA have a congested region of base peaks which contained 15 small peaks in the range of 1650-1350 cm-1. Five peaks occurred and matched with the carbohydrate region in roselle extract and standards (Figure 6).
2DIR synchronous correlation spectral
Comparison of 2DIR synchronous of FT34 and FT35 raw material
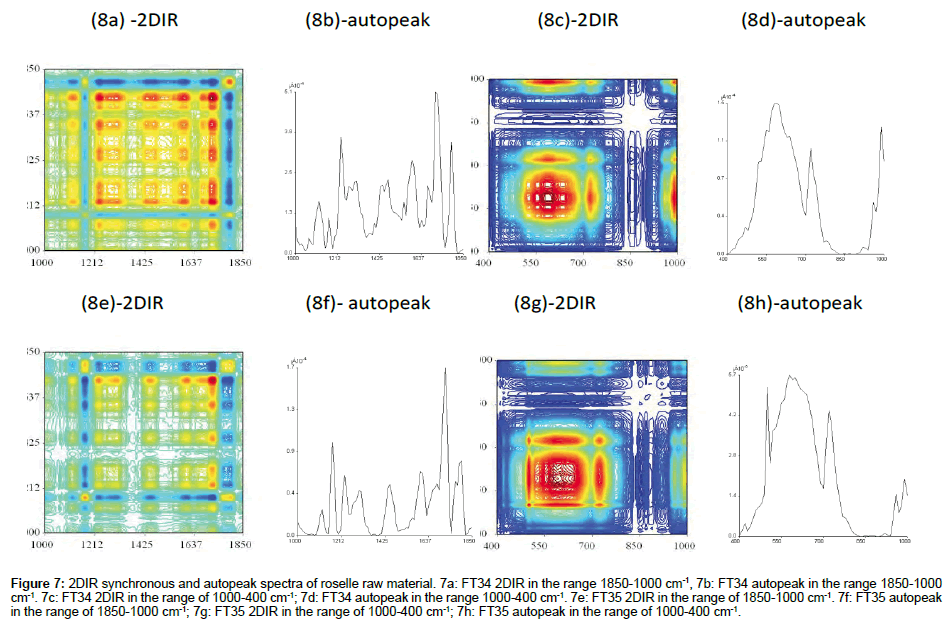
FT34 (In the range of 1800-1000 cm-1 and 1000-400 cm-1): Raw material represented the actual substance of the sample before the extraction. In this case, FT34 has clean clear-cut edge square created between autopeak 1425 cm-1 and 1800 cm-1 (Figure 7a). The region was built up by 3 small squares. The centre was the peak with highest intensity from the whole range of this spectrum which showed 2 layers of viewing from top. The background was scattered with small negative blue squares. The important portion was concentrated at the upper right square, as mentioned above. The highest peak of this spectrum was similar to the spectrum of FT34 without TFA (data not shown), i.e., the FT34 ethanol without TFA was not able to extract the assignment compound with the peak 1630 cm-1. The positive crosspeaks related in this square also recorded higher intensity. Plenty of compounds were located in the region centered with autopeak 680 cm-1 (Figure 7c). The area of square was included with a board range of various colours. The autopeak spectrum could be combination of components of peaks or some smaller hidden ones forming the huge peak. The raw material found in this region was even more complicated than the spectrum which has gone through the extraction process.
Figure 7: 2DIR synchronous and autopeak spectra of roselle raw material. 7a: FT34 2DIR in the range 1850-1000 cm-1, 7b: FT34 autopeak in the range 1850-1000 cm-1. 7c: FT34 2DIR in the range of 1000-400 cm-1; 7d: FT34 autopeak in the range 1000-400 cm-1. 7e: FT35 2DIR in the range of 1850-1000 cm-1. 7f: FT35 autopeak in the range of 1850-1000 cm-1; 7g: FT35 2DIR in the range of 1000-400 cm-1; 7h: FT35 autopeak in the range of 1000-400 cm-1.
FT 35 (In the range of 1800-1000 cm-1 and 1000-400 cm-1): The transmission of FT35 raw material spectrum (Figure 7e) was 40.46%, which was much lower than % transmission of FT34 raw material. However, the spectrum showed higher intensity of more autopeaks in this range, especially the range from 1425-1000 cm-1 compared with FT34 raw material. The structure of colours scattered evenly along the diagonal line. The correlation square created by autopeak at 1700 cm-1 with 1600 cm-1 correlated with positive crosspeak at (1700, 1600) and (1600,1700). Another correlation square created by autopeak 1600 cm-1 and 1425 cm-1 but correlated negatively with crosspeak at (1600, 1425) and (1425, 1600). The bigger correlation squares created by all the positive peaks included autopeak 1425 cm-1 to 1212 cm-1 and (1425, 1212) and (1212, 1425). Therefore there was no compression of correlation square in FT35 raw material, with about 2/3 of the spectrum as positive peaks. The broad square fulfilled almost 2/3 of the spectrum (Figure 7g). The highest autopeak at 810 cm-1 was similar to FT34, whereby the intensity of highest autopeak was five times higher than FT34. A combination of many component peaks formed the huge twin sharp peaks on top.
Comparison of 2DIR synchronous of FT34 and FT35 ethanol extract with TFA
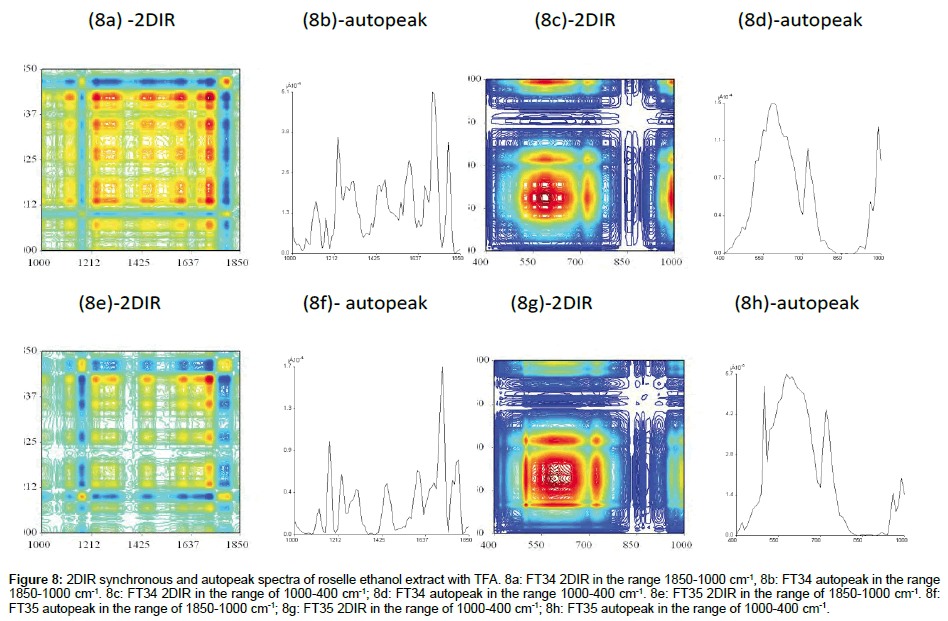
FT34 (In the range of 1800-1000 cm-1 and 1000-400 cm-1): At least 6 autopeaks were formed with very regular correlation squares along the range 1850-1200 cm-1 (Figure 8a). The positive cross peaks were scattered with the 50 cm-1 interval with another and there were more peaks in this range compared with FT35. A total of 2/3 of the clusters was presented in red, showing that the positive crosspeaks were more than negative crosspeaks. Ethanol and TFA exhibited the strong coefficient of extraction in the range of amide I and amide II bond, including flavonoids in this range. Very clear illustration was found in 2/3 of the cluster in this area and another 3 small clusters divided by almost blank partition (Figure 8c). The centre of the major cluster was located in the highest autopeak at 600 cm-1, surrounded by 2 correlation squares with positive crosspeaks, indicating that the centralised peak at 600 cm-1 was important and correlated with many compounds crossing with it. The huge peak could be combination or overlapping with other smaller peaks. The intensity of this range was lower than FT35.
Figure 8: 2DIR synchronous and autopeak spectra of roselle ethanol extract with TFA. 8a: FT34 2DIR in the range 1850-1000 cm-1, 8b: FT34 autopeak in the range 1850-1000 cm-1. 8c: FT34 2DIR in the range of 1000-400 cm-1; 8d: FT34 autopeak in the range 1000-400 cm-1. 8e: FT35 2DIR in the range of 1850-1000 cm-1. 8f: FT35 autopeak in the range of 1850-1000 cm-1; 8g: FT35 2DIR in the range of 1000-400 cm-1; 8h: FT35 autopeak in the range of 1000-400 cm-1.
FT35 (In the range of 1800-1000 cm-1 and 1000-400 cm-1): The ethanol extract with TFA of FT35 lacked peaks in the range of 1800- 1000 cm-1 (Figure 8e-81). The red area of peaks spotted in two straight axes along wavenumber 1700 cm-1 perpendicular to each other. The autopeak spectrum showed few sharps autopeaks but not as intense as FT34 with TFA. The square created by the negative crosspeaks indicated the presence of certain substances. Figure 8g showed the 2DIR spectrum of FT35 etanol extract with TFA in the range of 1000-400 cm- 1. The higher point of this range was 3.8 times more than FT34. FT35 also showed another sharp autopeak at 480 cm-1. The polar compound especially the saccharides are notably more intense than FT34 within this range of wavenumber, showing that ethanol favourably extracted the polar saccharide compounds in FT35 compared to FT34 in this range.
Comparison of 2DIR synchronous of FT34 and FT35 water extract with TFA
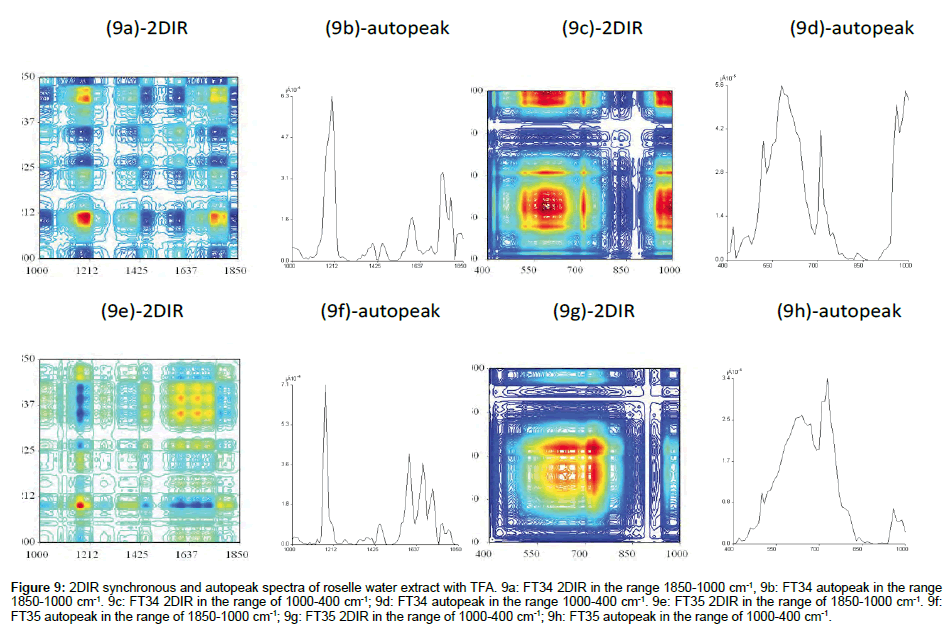
FT34 (In the range of 1800-1000 cm-1 and 1000-400 cm-1): 2DIR water extract of FT34 presented very different spectra compared to ethanol extract (Figure 9a), indicating that the content of the roselle water extract was dissimilar with ethanol extract in certain aspects. Four obvious points at four corners made up of correlation squares by autopeak 1700, (1700, 1212), 1212, (1212, 1700) were the only focus points in this region. However the autopeak around 1212 cm-1 was the highest points compared with others. Most of the peaks were evenly scattered and consisted of mixed positive and negative crosspeaks. Four shape peaks had been found along the diagonal line (Figure 9c). All were separated at least 100 cm-1 from each other. The red board peak from 550-650 cm-1 was centered at 600 cm-1, and the cross view showed the peaks of this 2DIR spectrum had sharper area. When compared with FT34 ethanol extract with TFA, this range of spectrum contained shaper peaks because water is the most polar solvent which is able to extract the polar compounds left after ethanol extraction with TFA.
Figure 9: 2DIR synchronous and autopeak spectra of roselle water extract with TFA. 9a: FT34 2DIR in the range 1850-1000 cm-1, 9b: FT34 autopeak in the range 1850-1000 cm-1. 9c: FT34 2DIR in the range of 1000-400 cm-1; 9d: FT34 autopeak in the range 1000-400 cm-1. 9e: FT35 2DIR in the range of 1850-1000 cm-1. 9f: FT35 autopeak in the range of 1850-1000 cm-1; 9g: FT35 2DIR in the range of 1000-400 cm-1; 9h: FT35 autopeak in the range of 1000-400 cm-1.
FT35 (in the range of 1800-1000 cm-1 and 1000-400 cm-1): The autopeak 1212 cm-1 was 7 times more intense than FT35 ethanol extract with TFA (Figure 9e). While the autopeak 1212 cm-1 was the major autopeak in this spectrum, it is also a major peak in FT34 water extract with TFA, both showed that the differences from ethanol extract e in the range of 1212-1100 cm-1 has higher intensity than the range of 1850-1500 cm-1. The upper right corner showed 9 points correlation squares in the small region, which was a specific marker for FT35 water extract. It could be explained that the groups of band intensity changes due to the same component within the 9 assigned peaks. This 2DIR spectrum has fewer positive crosspeaks and negative crosspeaks. When compared with FT34 water extract with TFA, this spectrum has regular peaks assigned in the range of 1850-1500 cm-1. Figure 9g showed the spectrum has lower intensity compared with FT34 water extract. The broad red mixed up with orange and yellow at the range 850-550 cm-1 indicated there are overlapping of many component of the substances. The autopeak at 830 cm-1 was one time higher than broad autopeak with the area 700-500 cm-1 which was opposite in FT34.
Conclusion
The differences of spectrum for both samples with different sample processing method obviously indicated that the composition of the end product relies on the appropriate processing method. The decoilation of seed was initially needed before the washing process since some of the residue or debris need to be totally cleaned. The temparature was considered one of the main factors affecting the end product. FT 35 was air-dried until 80% dry before further drying in the oven at 45°C for 3-4 days. FT35 exhibited more intense anthocyanin content especially in 2DIR spectra compared with FT34. Basically the IR analysis accurately differentiate the contents of both samples from raw material. The second derivative spectrum is another step to enhance the analysis by deriving the original spectrum peak to the diagnostic peak.
Acknowledgements
The authors thank the Director General of Health for the permission to publish and the Director of Institute for Medical Research (IMR), Kuala Lumpur for the support. This work was financially supported by the NKEA AGRICULTURE (EPP#1), NKEA Research Grant Scheme (NRGS) (Grant No: NH1014D060). The authors also thank Dr. Fairulnizal (IMR), Dr. Maizatul Hashim (IMR) and Dr. Lee Han Lim (IMR) for critically reviewing this paper and technical support from Perkin Elmer Sdn Bhd. (Malaysia). The previous support of Islam Development Bank (IDB) for training in FTIR and 2DIR under the Merit Fellowship is gratefully acknowledged.
References
- Norhaizan M, Fong SH, Amin I, Chew LY (2010) Antioxidant activity in different parts of roselle (Hibiscus sabdariffa L.) extracts and potential exploitation on the seeds. Food chemistry 122: 1055-1060.
- Mohamed Salem ZM, Olivares-Perez J, Salem AZM (2014) Studies on biological activities and phytochemicals composition of Hibiscus species- A review. Life Sci J 11:1-8.
- Ali BH, WabelNA, BlundenG (2005) Pharmacological and toxicological aspects of Hibiscus sabdariffa L. Phytotheraphy Research 19: 369-375.
- Herrera-ArellanoA, Flores-RomeroS, Chavez-soto S, Tortoriello MAJ (2004)Effectiveness and tolerability of a standardized extract from Hibiscus sabdariffa: a controlled and patients with mild to moderate hypertension: a controlled and randomized a clinical trial. Phytomedicine 11: 375-382.
- Lin TL, Lin HH, Chen CC, Lin MC, Chen MC, et al. (2007) Hibiscus sabdariffa extract reduces serum cholesterol in men and women. Nutrition Research 27: 140-145.
- Alarcon-Aguilar FJ, ZamilpaPerez-Garcia A, Almanza-Perez MD, RomeroNurez JCE, Campos-sepulvedaEA, et al. (2007) Effect of Hibiscus-sabdariffa on obesity in MSG mice. Journal of Ethnopharmacology 114: 66-71.
- Noda I, Ozaki Y (2004) Two-Dimentional Correlation Spectroscopy Application in Vibrational Optical Spectroscopy.John-Wiley and Sons Ltd., Chichaster, West Sussex, UK.
- Sun SQ, Zhou Q (2003) Atlas of Two-dimensional correlational Infrared Spectroscopy for traditional Chinese Medicine Identification. Chemical Industry Press, Beijing, China.
- Nakanishi K, Solomon PH (1977) Infrared Absorption Spectroscopy.2nd edn. Holden-day, San Franciso, USA.
Relevant Topics
Recommended Journals
Article Tools
Article Usage
- Total views: 12409
- [From(publication date):
October-2016 - Jul 03, 2025] - Breakdown by view type
- HTML page views : 11417
- PDF downloads : 992

