Research Article Open Access
Determination of Cyanogenic Compounds Content in Transgenic Acyanogenic Kenyan Cassava (Manihot esculenta Crantz) Genotypes: Linking Molecular Analysis to Biochemical Analysis
Ngugi M Piero1*, Murugi N Joan2, Oduor O Richard1, Mgutu A Jalemba1, Ombori R Omwoyo3 and Cheruiyot R Chelule3
1Department of Biochemistry and Biotechnology, Kenyatta University, Nairobi, Kenya
2Department of Environmental and Population Health, Kenyatta University, Nairobi, Kenya
3Department of Plant Sciences, Kenyatta University, Nairobi, Kenya
- *Corresponding Author:
- Mathew Piero Ngugi
School of Pure and Applied Sciences
Department of Biochemistry and Biotechnology
Kenyatta University, P.O Box 43844-00100
Nairobi, Kenya
Tel: +254 710 349 485/+254 732 264 557
E-mail: piero.mathew@ku.ac.ke/matpiero@gmail.com
Received date: July 17, 2015; Accepted date: August 05, 2015; Published date: August 12, 2015
Citation: Piero NM, Joan MN, Richard OO, Jalemba MA, Omwoyo OR, et al. (2015) Determination of Cyanogenic Compounds Content in Transgenic Acyanogenic Kenyan Cassava (Manihot esculenta Crantz) Genotypes: Linking Molecular Analysis to Biochemical Analysis. J Anal Bioanal Tech 6:264. doi:10.4172/2155-9872.1000264
Copyright: © 2015 Piero NM, et al. This is an open-access article distributed under the terms of the Creative Commons Attribution License, which permits unrestricted use, distribution, and reproduction in any medium, provided the original author and source are credited.
Visit for more related articles at Journal of Analytical & Bioanalytical Techniques
Abstract
Being the fourth most important crop in the developing countries surpassed only by maize, rice and sugarcane as a source of calories, cassava (Manihot esculenta Crantz) is doubtlessly a famine reserve crop due to its drought tolerance, ability to grow on infertile soils and its ability to recover from disease and pest attacks. However, this important tuber crop has a fair share of demerits, among which is the fact that all parts of the plant contain toxic levels of cyanogenic glycosides, which have to be removed by laborious processing before cassava can be safely consumed. Conventional methods for removal of cyanogenic glycosides in cassava have seldom been successful for decades. Genetic engineering holds the key to overcoming majority of these limitations in order to produce cassava plants in which desirable traits are optimized and undesirable traits downregulated. The objective of this study was to determine the levels of cyanogenic compounds in three Kenyan cassava genotypes along with an exotic model cultivar in which cyanogenic glycosides had been downregulated via RNA interference approach in an earlier study by the authors. Cassava roots from transgenic and wild type genotypes were harvested, peeled, cut to pieces and washed three times with cold water, following cyanogenic compounds were extraction by homogenization in acid extraction medium. The supernatant obtained after centrifugation of the homogenate was analyzed for cyanogenic compounds content by spectrophotometric procedures. From this study, transgenic cassava lines with cyanide content three folds less than the cyanide content in the wild type relatives were produced. This confirmed RNAimediated downregulation of expression of cytochrome P450 genes responsible for biosynthesis of cyano-glycosides previously undertaken by the authors in an earlier study.
Keywords
Manihot esculenta; Linamarin; Cyanohydrin; RNA interference
Introduction
Cyanide occurs in cassava in the form of two cyanogenic glycosides; linamarin and lotaustralin. Hydrolytic enzymes which are capable of breaking down these cyanogenic glycosides to free cyanide (hydrocyanic acid, HCN) are also present in the plant [1]. However, under normal conditions, they are separated from the substrate. Any process that ruptures the cell walls will bring the enzymes into contact with the glycosides and will thus release free cyanide and reduce the glycosides' content of the final product [1].
Cassava toxicity in humans is a well-documented problem. Cassava tubers vary widely in their cyanogen content, although most varieties contain 15 to 400 mg HCN per kg fresh weight [2]. Cyanide doses of 50 to 100 mg are reportedly lethal to adults [3]. Several diseases are associated with the consumption of inadequately processed cassava roots, such as tropical ataxic neuropathy, endemic goiter and spastic paraparesis (Konzo) [1,4,5]. Konzo is mainly a disease of women and children. It is an acute disease, rapidly and permanently crippling the victim by damaging nerve tracts in the spinal cord that transmit signals for movement, causing a spastic paralysis of both legs [6].
The different techniques of processing cassava roots aim to reduce the levels of cyanogenic compounds in order to obtain a safe food. The traditional methods usually include chipping, soaking, fermentation, cooking, steaming, drying and roasting. They all permit the enzyme linamarase to interact with the cyanogenic compounds to release HCN. The HCN then either dissolves in water or escapes into the air. However, it is often impossible to remove all the cyanogenic compounds through conventional processing [1]. Genetic engineering approach offers an alternative method to reduce cyanogenic compounds in cassava.
Different methods are available for the quantitative determination of cyanogenic compounds (linamarin, cyanohydrin and free cyanide). The majority require three steps. The first step, extraction of cyanogens, is normally carried out in dilute acid [7] to stop the degradation of cyanogenic compounds. The second step involves degradation of linamarin to cyanohydrin and glucose and, subsequently, to HCN. This can be achieved either by autolysis, which relies on the endogeneous linamarase [8], by enzymatic hydrolysis by adding exogenous linamarase [9] or by alkalinic hydrolysis by addition of NaOH.
For the third step, determination of HCN, various methods have been developed, such as titration with AgNO3 [10], reaction with alkaline picrate [11], and, most widely used, the photometric method based on the König reaction [12-14].
Several other methods are available and have been reviewed by ref. [7]. The method based on the König reaction is suitable for a laboratory with limited equipment and for field analysis, and hence it was chosen for this study.
This study was designed to determine levels of cyanogenic compounds in three transgenic Kenyan cassava lines used in this study along with an exotic model cultivar, TMS 60444. Molecular analysis results of transgenic lines of these genotypes obtained by ref. [15] confirmed stable RNAi-mediated downregulation of cyanoglycosides. It was, therefore, imperative corroborate the obtained molecular data with biochemical assays for the cyanogenic compounds.
Materials and Methods
Determination of cyanogenic compounds
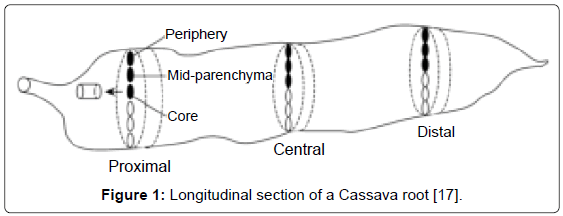
Sample preparation: Kanamycin-resistant transgenic cassava lines and the wild type cassava were analyzed for cyanogenic compounds content. Cassava roots were harvested, peeled, cut to pieces and washed three times with cold water. Since cyanide content varies both longitudinally and radially [16,17], a homogeneous sample was obtained by removing both the stem end and the distal end of the tuber and cutting the root into cubes. They were dried at room temperature (25°C) and were then ground to powder. Leaves were also harvested from both transgenic and wild type Cassava washed once with cold water and dried at room temperature after which they were ground to powder. For determination of distribution of total cyanide content in roots, powder from different root parts was prepared separately for separate analysis. The different parts of the root prepared were central disc, distal root tip, apical root tip, outer radial part and root cortex (Figure 1).
Extraction of cyanogenic compounds
Samples of 10 g were homogenized in 30 ml of acid extraction medium (Polytron). The amount of sample varied, but the ratio of sample to extraction medium was always approximately 1:3. The homogenized samples were left to stand for 10 min and then centrifuged at 10,000 g for 10 min (Beckman, J-25i, and Fullerton, USA). The supernatant was stored at 4°C until assayed for cyanogenic compounds.
Enzymatic procedure
The reagent solutions used in enzymatic assays were prepared as follows; Phosphate buffer pH 7.0, 6.0 and 4.0 were prepared from 0.1M H3PO4 and 0.1M Na3P04. Linamarase from BDH was dissolved in phosphate buffer pH 6.0 to give an activity of 5 enzyme units (EU)/ ml (hydrolysis of 5 μmol of linamarin per min at 30°C in phosphate buffer, pH 6.0). Chloramin T reagent was prepared by dissolving 0.5 g of chloramin T in 100 ml water. The isonicotinic acid/barbituric acid reagent was prepared by dissolving 3.5 g barbituric acid and 2.85 g isonicotinic acid in 0.5M NaOH solution. The pH of this reagent was adjusted between 7 and 8 with 2M HCl or NaOH, respectively. Acetone cyanohydrin, used to calibrate the samples, was prepared as follows: A stock solution of 628 mg cyanohydrin per litre in 0.1M phosphoric acid (corresponding to 200 mg HCN/L) was diluted in 0.1M phosphoric acid so that the standard solutions contained 3.1, 9.4, 15.7, 25.1, 31.4, 47.1 and 62.8 mg/l cyanohydrin (corresponding to 1, 3, 5, 8, 10, 15 and 20 mg HCN/L).
The assay procedures were done as follows:
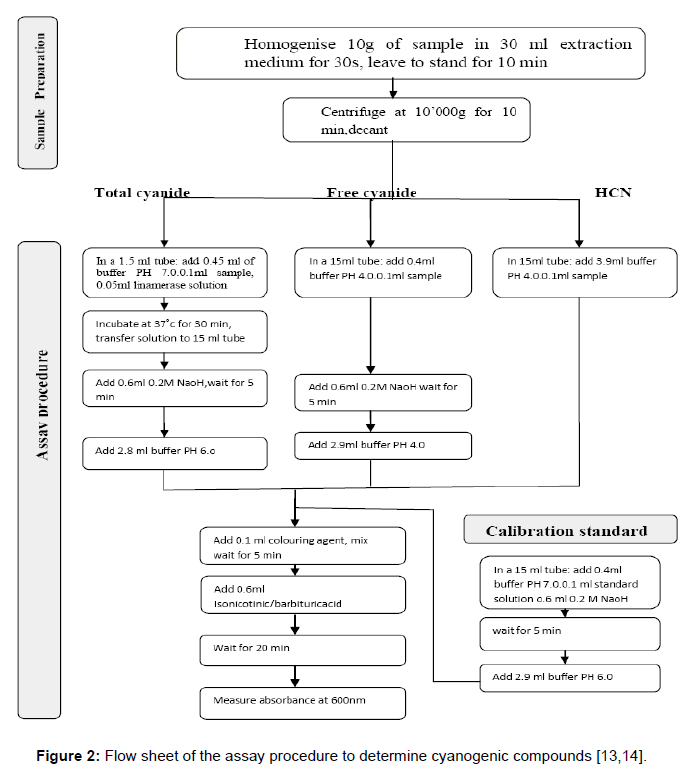
Total cyanide (cyanogenic glycosides+cyanohydrin+HCN): In a stoppered 1.5 ml tube 0.1 ml extract and 0.05 ml linamarase were added to 0.45 ml phosphate buffer pH 7.0. After incubation at 37°C for 30 min, the mixture was transferred to a 15 ml tube containing 0.6 ml 0.2M NaOH. After 5 min, the sample was diluted with additional 2.8 ml phosphate buffer (pH 6.0) and analyzed in the spectrophotometric procedure (Figure 2).
Free cyanide (cyanohydrin+HCN): An amount of 0.1 ml extract was mixed with 0.4 ml phosphate buffer pH 4.0 in a 15 ml tube, and 0.6 ml 0.2M NaOH was added. After 5 min, 2.9 ml phosphate buffer (pH 4.0) was added and the mixture was analyzed spectrophotometrically (Figure 2).
HCN: In a 15 ml tube, 0.1 ml extract and 3.9 ml phosphate buffer (pH 4.0) were mixed and analyzed spectrophotometrically (Figure 2).
Calibration standards
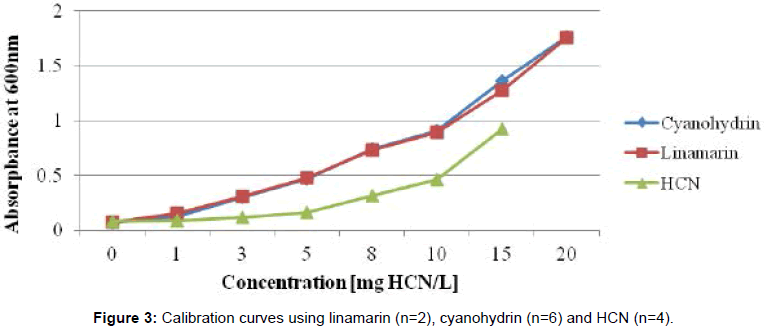
Standard solutions were assayed as described in IITA [14]. The calibration curve was established at least once every day. To the samples, 0.1 ml chloramin T reagent was added and mixed on a shaker. After 5 min, 0.6 ml colour reagent (isonicotinic acid/barbituric acid reagent) was added and mixed well. The absorbance was measured spectrophotometrically after 20 min at 600 nm. Duplicate analyses for samples and standard solutions were performed (Figure 3).
Calculation of the cyanide content
Total cyanide, free cyanide and HCN contents of the samples were calculated as mg HCN equivalent/kg dwt using the formulae below [14].
Extraction factor =
Cyanide contentsample solution (mg/l) =
Cyanide content (mg/kg fwt) =dilution factorsample × extraction factor×cyanide contentsample solution
Cyanide content (mg/kg dwt) =
Cyanogenic glycosides were calculated as (total cyanide minus free cyanide) and cyanohydrin as (free cyanide minus HCN).
Data analysis
Data on cyanogenic glycoside levels was determined, calculated and recorded in mg/kg fresh weight. The computed levels of cyanogenic glycosides in the leaves, stems and different parts of the roots of both wild type and transgenic cassava were analysed by unpaired student’s t-test at a confidence level of 95% (P<0.05). Minitab statistical software (version 2012) was used for data analysis.
Results
Determination of cyanogenic compounds content in cassava roots and leaves
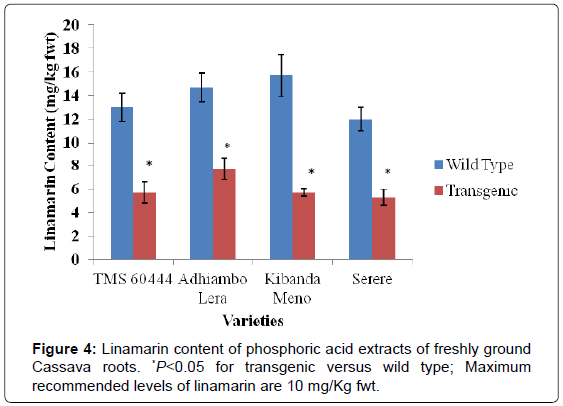
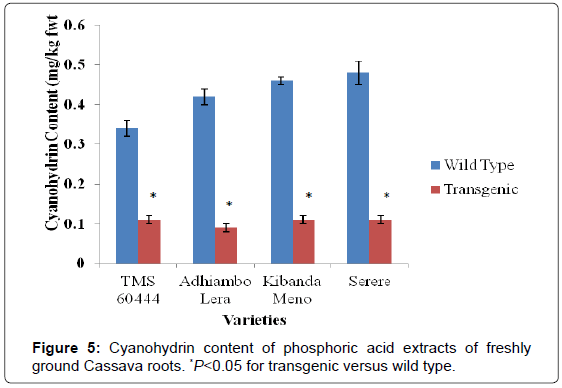
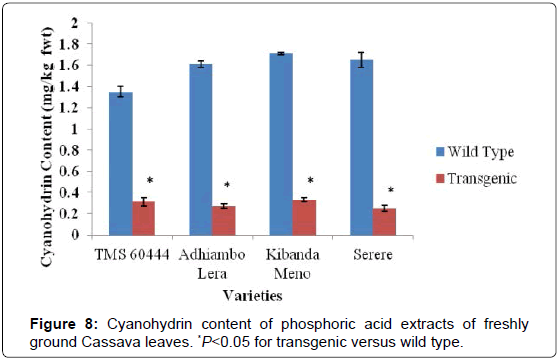
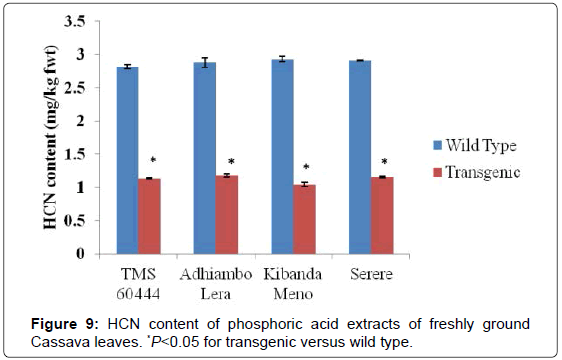
Both wild type and transgenic Kenyan cassava lines were analyzed for content of the cyanogenic compounds linamarin, cyanohydrin and hydrocyanic acid (HCN). In all the transgenic lines, there was remarkable reduction in the levels of cyanogenic compounds compared to their wild type counterparts. The wild type of Kibanda meno had the highest level of linamarin and hydrocyanic acid, while the wild type of Serere had the highest levels of cyanohydrins. The wild type of the model cultivar TMS 60444 had the lowest levels of all the cyanogenic compounds determined in this study (Figures 4-6).
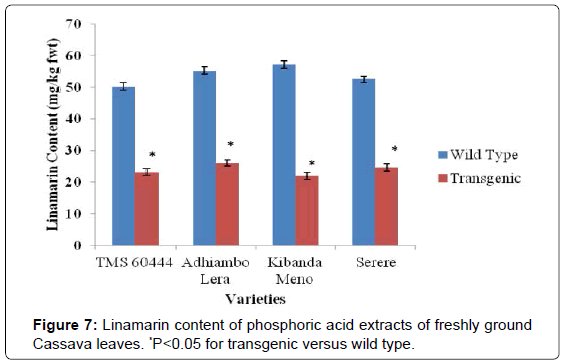
In all the cassava genotypes used in this study, the levels of cyanogenic compounds in the transgenic lines were significantly different from the levels in their wild type counterparts (P<0.05). Since cyanohydrin and hydrocyanic acid are both derived from enzymatic cleavage of linamarin, reduction of their levels in transgenic lines was consistent with reduction of linamarin levels. Linamarin levels in wild type genotypes were higher than 10 mg/kg fwt, which is the maximum recommended level of linamarin by FAO. In all the transgenic genotypes, the linamarin levels were reduced to levels below the maximum FAO recommended of linamarin (Figures 4 and 7).
The levels of cyanogenic compounds in leaves of the wild type cassava were higher in leaves than in roots by between three and four folds. The genotype Kibanda meno had the highest levels of cyanogenic compounds compared to the wild types of the other genotypes used in this study. Conversely, the wild type of the model cultivar TMS 60444 had the lowest levels of the cyanogenic compounds (Figures 7-9). In all the genotypes used in this study, the levels of cyanogenic compounds in transgenic lines were significantly lower than the levels in their wild type relatives (P<0.05) (Figures 7-9).
Determination of distribution of total cyanide content in Cassava roots
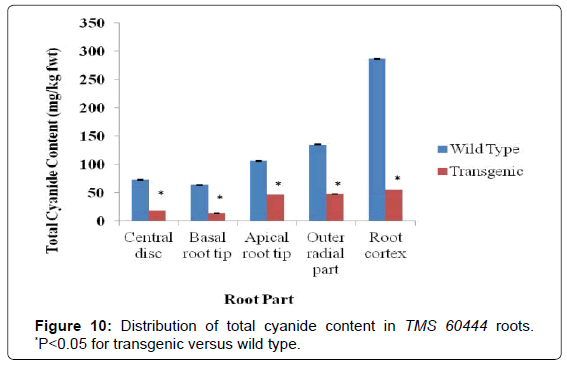
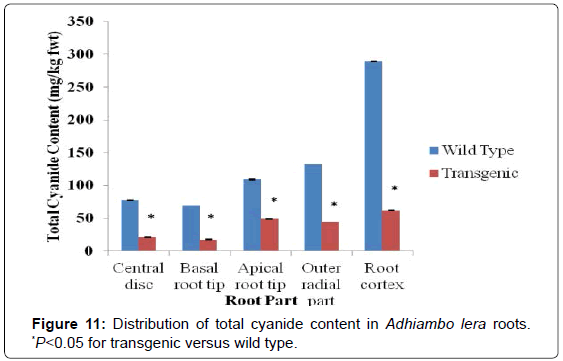
Generally, parts closer to the root cortex and closer to the basal root tip contained more cyanides than parts near the centre of the root. For the wild type of the model cultivar TMS 60444, the total cyanide content ranged from 73 mg/kg fwt for the central disc part of the root to 286 mg/kg fwt for the root cortex. On the other hand for the transgenic line of TMS 60444, the total cyanide content ranged from 14 mg/kg fwt for the basal root tip to 55 mg/kg fwt for the cortical region of the root (Figure 10). The roots of the wild type of Adhiambo lera had the total cyanide levels ranging from 69 mg/kg fwt for the central disc of the root to 289 mg/kg fwt for the root cortex. The total cyanide levels in the roots of its transgenic relative ranged from 17 mg/kg fwt for the basal root tip to 62 mg/kg fwt for the root cortex (Figure 11). There was clear significant difference in total cyanide levels between the transgenic and wild type line (P<0.05).
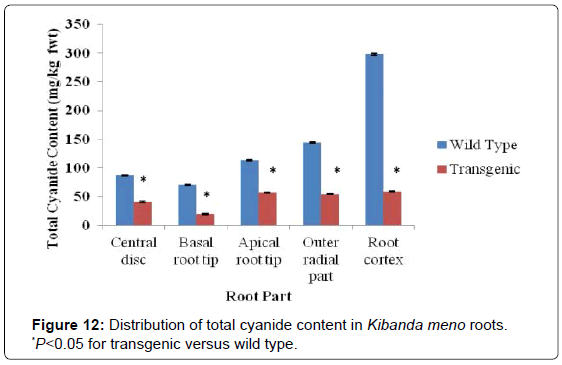
There was a similar trend of reduction in total cyanide levels in Kibanda meno and Serere. In Kibanda meno, roots of the wild type line had total cyanide content ranging from 70 mg/kg fwt for the basal root tip to 298 mg/kg fwt for the cortical part of the roots. In the roots of transgenic line, the total cyanide content was in the range of between 19 mg/kg fwt for the basal root tip and 59 mg/kg fwt for the root cortex (Figure 12). As seen earlier, Kibanda meno had the highest levels of cyanogenic compounds in both wild type and transgenic cassava roots and leaves. This trend was also observed in the total cyanide levels. The reduction in cyanide content in this genotype was significant (P<0.05).
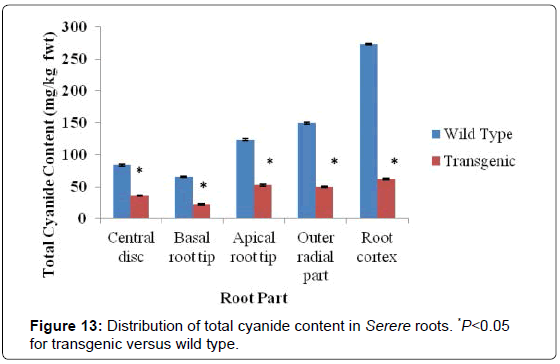
For the Serere genotype, there was also a remarkable significant reduction of total cyanide in different parts of the transgenic cassava roots (P<0.05). The cortical root region of the transgenic Serere lines had total cyanide content of 62 mg/kg fwt in comparison to the wild type line, which total cyanide content of 73 mg/kg fwt in the root cortex (Figure 13). In the roots of both the wild type and transgenic Serere lines, the basal root tip part had the lowest total cyanide content ranging from 66 mg/kg fwt to 12 mg/kg fwt respectively. The degree of reduction of total cyanide content in transgenic Serere lines in all root parts was significant compared to total cyanide levels in the wild type relatives (P<0.05) (Figure 13).
Discussion
The wild type lines showed higher levels of cyanide content than the accepted levels by WHO [18,19]. Results of this study corroborate with previous findings that cyano-glycosides levels in cassava root vary widely between cassava cultivars of same variety, different tissues of the same plant, roots of the same plant and even within the root parenchyma [20-22].
In this study, cassava leaves had more cyano-glycoside levels than roots. This agrees with study results by ref. [23], who observed that cyanogenic potential in cassava leaves was three fold higher than in roots. In their study, [24] observed that cassava leaves had cyanogenic potential 2-27 times higher than the cyanogenic potential in roots. This can be expected because biosynthesis of cyano-glycosides occurs in cassava levels before their translocation into the roots [25].
Cyano-glycoside levels in cassava also vary according to location, age, method of analysis and environmental conditions [22,26]. These parameters had no bearing in the results of this study because the cassava genotypes used in this study were sourced from the same locations, they were equally aged, they were subjected to the same analytical methods and they were grown in the same environmental conditions.
Previous research by ref. [27] indicate that cassava cultivars with <100 mgHCN/kg fwt are considered sweet while those >100 mgHCN/ kg fwt are considered bitter. By this indication, the cassava cultivars used in this study can well be considered sweet. The transgenic cassava lines developed in this study had cyanide levels below 100 mgHCN/ kg fwt. In this study, wild type and transgenic cassava plants used for cyanide content determination were three months-old.
The cyanogenic levels of known cassava cultivars range from less than 10 mg/kg fwt to more than 500 mg/kg fwt [28]. The total cyanide content in the roots of the wild type transgenic cassava lines used in this study did not surpass this ceiling. World Health Organization recommends 10 mg/kg body weight as the maximum safe cyanide level [18] for fresh cassava intake [16,29].
Linamarin levels were higher than the other cyanogenic compounds in all the wild type and transgenic cassava lines studied. This is perhaps attributable to the fact that linamarin is the predominant cyano-glycoside in cassava and that it is the metabolic precursor of cyanohydrin and hydrogen cyanide (HCN) [30]. Further, findings from other studies indicate that linamarin is more stable than other cyanogenic compounds even at varying storage temperatures. Cyanohydrin and HCN levels were very low in all the wild type and transgenic cassava genotypes used in this study. Nevertheless, that there were detectable cyanohydrin and HCN levels in the cassava genotypes evaluated is an indication that linamarase enzyme activity on linamarin was pronounced and that cyanohydrin was cleaved to HCN either spontaneously or via endogenous enzymatic cleavage by hydroxynitrile lyase
In all the cassava lines evaluated, the cyanide content of the apical root tip was higher than in the distal root tip. This is in agreement with previous results, which indicated that the apical root end contains higher cyanide content than the distal end [16]. The radial gradient in cyanide content was considerably high, total cyanide increased from the centre of the root to the peripheral part of the root parenchyma. These results are in tandem with those obtained by ref. [12] who reported a sharp decrease in the radial cyanide gradient towards the centre of the root. However, the variation of cyanide contents both longitudinally and radially may show misleading results of the mean cyanide content of a cassava root [1]. Probably this can be accounted for by previous findings intimating that cyanide content of the roots varies along the length of the tuber [30].
Variations in concentrations of cyanogenic compounds in the different cassava genotypes evaluated can be explained by the study results by ref. [5], who observed that cyanide content in cassava is genotype dependent. Some cassava genotypes are considered as highly cyanogenic while others are less cyanogenic. Further, the variation in the content of cyanogenic compounds in the different parts of cassava roots can be explained by differential translocation of cyanogenic glycosides and their metabolizing enzymes in the different cellular compartments.
The total cyanide distribution in Cassava roots evaluated in this study was different among the studied genotypes. This can be explained by the fact that expression levels of CYP79D1/D2 genes varies among cassava genotypes. This implies that some cassava genotypes are more cyanogenic than others.
The RNAi technique has rapidly gained favor as a “reverse genetics” tool to knock down the expression of targeted genes in plants, as in other species, due to certain advantages that RNAi technology holds over gene disruptions caused by transposon or T-DNA insertion. The ability to target multiple gene family members with a single RNAiinducing transgene is one such advantage. Another is that gene knockdowns due to RNAi are dominant, whereas insertional or other loss-of-function mutations are recessive. The dominant aspect of RNAi allows the knock down of genes in polyploid genomes that contain four or more orthologs and are thus refractive to traditional mutagenesis [31,32].
Likewise, orthologs can be knocked down in F1 hybrids in which the RNAi-inducing transgene is introduced through only one of the parents. Finally, the dominance of RNAi allows one to save time by eliminating the additional generations needed to identify individuals that are homozygous for recessive loss-of-function alleles [31].
Against this background, it can be inferred from this study that it is possible that cyanide content was not reduced to zero value because RNAi is not a knock out strategy but rather, a knock down strategy. That gene knockdowns due to RNAi are dominant, is a welcome phenomenon because it implies that down regulation is expected to dominate even in subsequent generations of the transgenic cassava lines produced in this study. The targeted gene for knock down in this study, CYP79D1 gene, encodes cytochromes P450 oxidative enzymes that catalyze the committed step in biosynthesis of cyano-glycosides. Knock down of this gene sporadically reduces expression levels of this enzyme and therefore reduction of cyanide levels downstream.
Conclusion
In this study, analysis of cyanide content in roots and leaves of both wild type and transgenic lines showed that cyanide content was largely reduced by three folds in the transgenic lines. This was a confirmation of down regulation of expression of cytochrome P450 genes responsible for biosynthesis of cyano-glycosides undertaken by the authors in an earlier study [15]. This is a significant finding linking molecular data to phenotypic data.
References
- Heuberger C (2005) Cyanide Content of Cassava and Fermented Products with Focus on Attiéké and Attiéké Garba. Swiss Federal Institute of Technology, Zurich, Switzerland.
- Padmaja G (1995) Cyanide detoxification in cassava for food and feed uses. Crit Rev Food Sci Nutr 35: 299-339.
- Halstrom F, Moller KO (1945) The content of cyanide in human organs from cases of poisoning with cyanide taken by mouth; with a contribution to the toxicology of cyanides. Acta Pharmacol Toxicol (Copenh) 1: 18-28.
- Adewusi SR, Akindahunsi AA (1994) Cassava processing, consumption, and cyanide toxicity. J Toxicol Environ Health 43: 13-23.
- Siritunga SD (2002) Generation of acyanogenic cassava (Manihot esculenta Crantz): transgenic approaches. The Ohio State University, USA.
- Howlett WP, Brubaker GR, Mlingi N, Rosling H (1990) Konzo, an epidemic upper motor neuron disease studied in Tanzania. Brain 113: 223-235.
- Bradbury JH, Bradbury MG, Egan SV (1994) Comparison of methods of analysis of cyanogens in cassava. Acta Horticulturae 375: 87-96.
- Cooke RD, De la Cruz EM (1982) An evaluation of enzymic and autolytic assays for cyanide in cassava. J Sci Food Agric 1001-1009.
- Rao PO, Hahn SK (1984) An automated enzymatic assay for determining the cyanide content of cassava (Manihot esculenta Crantz) and cassava products. J Sci Food Agric 35: 426-436.
- Approved Organic Analytical Calculations (1990) Hydrocyanic acid in beans. Official Methods of Analysis AOAC Inc. Arlington, VA, USA.
- Egan SV, Yeoh HH, Bradbury JH (1998) Simple picrate paper kit for determination of the cyanogenic potential of cassava flour. J Sci Food Agric 76: 39-48.
- Cooke RD, Howland AK, Hahn SK (1978) Screening cassava for low cyanide using an enzymatic assay. Experimental Agriculture 14: 367-372.
- O'Brien GM, Taylor AJ, Poulter NH (1991) Improved enzymic assay for cyanogens in fresh and processed cassava. J Sci Food Agric 56: 277-289.
- Essers SAJA, Bosveld M, Van der GRM, Alfons GJV (1993) Studies on the quantification of specific cyanogens in cassava products and introduction of a new chromogen. J Sci Food Agric 63: 287-296.
- Piero NM, Murugi NJ, Okoth OR, Ombori OR, Jalemba MA, et al. (2014) RNAi-Mediated Downregulation of Cyano-Glycoside Biosynthesis in Kenyan Cassava (Manihot esculenta Crantz) Genotypes. J Plant Biochem Physiol 3: 148.
- Bradbury JH, Egan SV, Lynch MJ (1991) Analysis of cyanide in cassava using acid hydrolysis of cyanogenic glucosides. J Sci Food Agric 55: 277-290.
- Chávez AL, Sánchez T, Jaramillo G , Bedoya JM, Echeverry J, et al. (2005) Variation of quality traits in cassava roots evaluated in landraces and improved clones. Euphytica 143: 125-133.
- Food and Agriculture Organization/World Health Organization Food standards programme (1991) Codex Alimentarius Commission X11. Supplement 4. FAO/UN, Rome, Italy.
- Cumbana A, Mirione E, Cliff J, Bradbury JH (2007) Reduction of cyanide content of cassava flour in Mozambique by the wetting Method. Food Chem 101: 894-897.
- De Brujin GH (1971) Etude du Caractere Cynogenetique du Manioc (Manihot esculenta, Crantz), Moded Land Hogesch. Wageningen, The Netherlands 71.
- Cardoso AP, Mirione E, Ernesto M, Massaza F, Cliff J, et al. (2005) Processing of cassava roots to remove cyanogens. J Food Compost Anal 18: 451-460.
- Mburu FW, Swaleh S, Njue W (2012) Potential toxic levels of cyanide in cassava (Manihot esculenta Crantz) grown in Kenya. African Journal of Food Science 6: 416-420.
- Hidayat A, Zuraida N, Hararida I (2002) The Cyanogenic Potential of Roots and Leaves of ninety nine cassava cultivars. Indonesian Journal of Agricultural Science 3: 25-32.
- Fukuba H, Igarashi O, Briones CM, Mendoza EMT (1984) Cyanogenic clucxosides in cassava product: Determination and detoxification. Tropical Root Crops. Postharvest physiology and processing. International Development Research Centre, Ottawa 225-234.
- Degró JDM (2009) Converting toxic cyanide into valuable aminoacids: Isolation of Beta-cyanoalanine synthase in cassava (Manihot esculenta Crantz) and evaluation of its physiological role. University of Puerto Rico, Mayaguez, Puerto Rico.
- Githunguri C, Ekanayake I, Chweya J, Imungi J (1998) The effect of different ecological zones and plants age on cyanogenic potential of six selected cassava clones. Post-harvest technology and commodity marketing. Proceedings of Post-Harvest Conference 71-76.
- Wheatly CC, Orrego AJI, Sanchez T, Granados FE (1993) Quality evaluation of cassava core collection at CIAT. In: Roca AM, Thro AM (Eds) Proceedings of the First International Scientific Meeting of Cassava Biotechnology Network; CIAT, Cali, Columbia 379-383.
- O’Brien GM, Wheatley CC, Iglesias C, Poulter NH (1994) Evaluation, modification and comparison of two rapid assays for cyanogens in cassava. J Sci Food Agric, 65: 391-399.
- Food and Agriculture Organization (2007) Cassava production statistics, Rome, Italy.
- Bokanga M, Otoo E (1994) Cassava based foods: how safe are they? In: Ofori H, Hahn SK (Eds) Proceedings of the 9th symposium of the international society for tropical root crops 225-232.
- Preuss S, Pikaard CS (2003) Targeted gene silencing in plants using RNA interference. DNA Press, Saint Louis, USA.
- Lawrence RJ, Pikaard CS (2003) Transgene-induced RNA interference: a strategy for overcoming gene redundancy in polyploids to generate loss-of-function mutations. Plant J 36: 114-121.
Relevant Topics
Recommended Journals
Article Tools
Article Usage
- Total views: 17620
- [From(publication date):
October-2015 - Jul 03, 2025] - Breakdown by view type
- HTML page views : 12796
- PDF downloads : 4824

