Research Article Open Access
Determination by UPLC/MS-MS of Coenzyme Q10 (CoQ10) in Plasma of Healthy Volunteers before and after Oral Intake of Food Supplements Containing CoQ10
Giacomo Luca Visconti1, Lara Mazzoleni1, Chiara Rusconi2, Vittorio Grazioli2, Gabriella Roda1*, Giorgio Manini3 and Veniero Gambaro11Dipartimento di Scienze Farmaceutiche, Sezione di Chimica Farmaceutica "Pietro Pratesi", Università degli Studi di Milano, Via L. Mangiagalli 25, 20133, Milano, Italy
2Centro Diagnostico Italiano, Via Saint Bon, 20, 20147 Milano, Italy
3Scharper S.p.A., Viale Ortles, 12, 20139 - Milano, Italy
- *Corresponding Author:
- Gabriella Roda
Dipartimento di Scienze Farmaceutiche
Sezione di Chimica Farmaceutica "Pietro Pratesi"
Università degli Studi di Milano, Via L. Mangiagalli 25
20133, Milano, Italy,
Tel: 390250319065;
E-mail: gabriella.roda@unimi.it
Received date: November 24, 2015 Accepted date: December 09, 2015 Published date: December 14, 2015
Citation: Visconti GL, Mazzoleni L, Rusconi C, Grazioli V, Roda G, et al. (2015) Determination by UPLC/MS-MS of Coenzyme Q10 (CoQ10) in Plasma of Healthy Volunteers before and after Oral Intake of Food Supplements Containing CoQ10. J Anal Bioanal Tech S13:011. doi:10.4172/2155-9872.S13-011
Copyright: © 2015 Visconti GL, et al. This is an open-access article distributed under the terms of the Creative Commons Attribution License, which permits unrestricted use, distribution, and reproduction in any medium, provided the original author and source are credited.
Visit for more related articles at Journal of Analytical & Bioanalytical Techniques
Abstract
To evaluate CoQ10 concentration a UPLC/MS-MS method for its analysis in plasma samples was developed. Before validation, the choice of the anticoagulant, of the Internal Standard (CoQ9; IS) and the stability of CoQ10 in plasma were evaluated. These determinations were necessary to assess the effect of the oral intake of CoQ10 in nine healthy volunteers after 10 days of treatment with a food supplement containing it. The basal levels of CoQ10 were determined and the analyses were repeated after four days to take into account the variability of endogenous substances. After oral intake, the increase in plasma concentration of CoQ10 resulted statistically significant (P<0.05), indicating that the assumption of food supplements containing this ubiquinone could be of help to increase its concentration, thus exploiting the its beneficial properties.
Keywords
Coenzyme Q10; CoQ9; Plasma; Oral intake; UPLC/MSMS
Introduction
Coenzyme Q10 (CoQ10; 2,3-dimethoxy-5-methyl-6-polipropenyl- 1,4-benzoquinone), also known as ubiquinone 10, is a lipophilic naturally occurring compound located in all membranes of eukaryotic organisms [1]. It is a benzoquinone with 10 isoprene units in the aliphatic chain [2] and it is essential for electron transfer in the mitochondrial respiratory chain, playing a key role in energy metabolism as an integral part of the electron transport system [3,4]. CoQ10 is the predominant ubiquinone species in humans and it originates from endogenous biosynthesis as well as from dietary intake. It is widely distributed in human tissues, especially in inner membranes of mitochondria where it affects their fluidity and permeability [3,5]. It plays a key role in maintaining the cellular redox state and acts as an antioxidant, inhibiting free radicals and showing synergism with other antioxidants [6].
CoQ10, found in most dairy products, vegetables, fruit and cereals has been studied as an antioxidant agent that protects circulating lipoproteins against oxidative damage [7] and it is recognized as a powerful systemic antioxidant that protects DNA, lipids and proteins against oxidative damage. In fact CoQ10 has been recognized to be useful in prophylaxis and therapy of various disorders related to oxidative stress, such as cardiovascular diseases [8,9], neurodegenerative diseases [10-12] and mitochondrial disease [13].
CoQ10 is a key factor in the aging process and the maintenance of this nutrient is a good strategy to preserve health during aging [14,15]. CoQ10 deficiency syndromes are potentially treatable disorders [16-18]. Immediate diagnosis leads to better prevention and correction of the clinical symptoms. CoQ10 deficiency can also be associated to a high risk of development of chronic diseases [19,20], such as heart failure, hypertension [21-23], neurodegenerative disorders, and diabetes [24]. CoQ10 can be supplied by diet, and its content is higher in animal products than in plant products [25,26]. Meat, fish, and vegetable oils are good sources of CoQ10, while vegetables, fruits, and cereals are a very poor source. It has been demonstrated that the oral intake of CoQ10 may also improve functional capacity and endothelial function in chronic heart failure [8] without any side effects. For these reasons in the last few years, the number of CoQ10 dietary supplements has increased rapidly. Several analytical methods have been developed for the determination of CoQ10 content, based on spectrophotometric, colorimetric [27], electrochemical [28,29] and electrophoretic techniques [30], but the method of choice is reversed phase high performance liquid chromatography (LC) with ultraviolet detection [31,32], electrochemical detection [33-35] or tandem mass spectrometry detection (MS/MS) [36,37]. The more recent reports deals with the development of miniaturized LC/UV systems [38] and the demonstration of the effect of CoQ10 in the reduction of the oxidative stress and of the inflammatory markers [39,40]. Moreover a study on the in vivo oxidation of CoQ10 was carried out [41]. The extensive scientific production in this field demonstrates that there is a great interest in CoQ10 due to its important physiological activities.
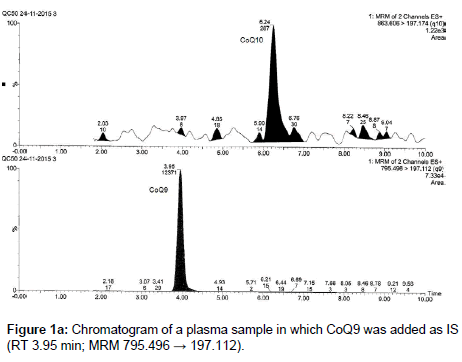
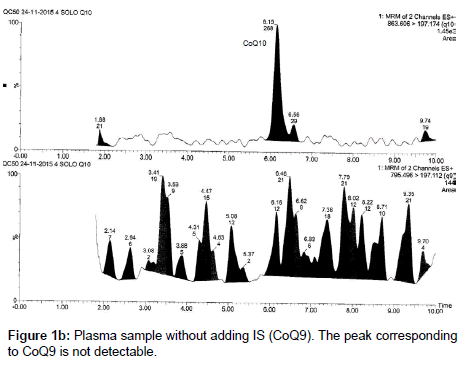
In this paper we developed and validated a UPLC/MS-MS method, based on a liquid-liquid extraction procedure, for the determination of CoQ10 in human plasma, which differentiates from the other methods because of the rapidity of extraction and the fast analytical times requested. The method was optimized using another endogenous substance, CoQ9, as Internal Standard (IS). CoQ9 is present in human plasma at not significant concentrations or at least its low amount does not influence its use as IS at the concentrations required for the analyses (Figure 1).
The method was applied to the analysis of CoQ10 in the plasma of nine healthy volunteers, assuming for 10 days food supplements containing it, in order to evaluate the increase of ubiquinone concentration in plasma after oral intake. The basal levels were assessed considering two withdrawals carried out four days away from one another to take into account the variability of endogenous analytes. Moreover the best anticoagulant and the best storage conditions were evaluated.
Materials and Methods
Chemicals, reagents and standards
Coenzyme Q10, coenzyme Q9 (IS), methanol, acetonitrile and hexane were obtained from Sigma Aldrich (Germany); ethanol was supplied from Fluka (Germany). All reagents were of analytical grade and were stored as required by the manufacturer. Water (18.2 mΩ/ cm) was prepared by a Milli-Q System (Millipore, France). Quality control (QC) samples were prepared in physiological solution at a concentration of 100 ngtot to test the performance of the analytical method.
Plasma samples
For the stability test of CoQ10, five plasma samples supplied by the Centro Diagnostico Italiano (CDI) from five healthy volunteers were taken into account. For the evaluation of the increment of CoQ10 concentration before and after the oral intake of food supplements containing CoQ10, 9 healthy volunteers were treated with a food supplement containing CoQ10 (16 mg) with high solubility (Eufortyn 10 FL 15 ML, 130 mg) for 7 consecutive days. Plasma was taken before the treatment and at the end of the treatment. Analyses were carried out in triplicate, considering the median value among the three determinations.
Liquid-liquid (L-L) extraction method
Plasma (250 μL) was added with IS (100 μL, 1 μg/mL), methanol (400 μL) and extracted with hexane (1 mL). The mixture was put on a rotary shaker (15 min, 15 rpm) and then centrifuged (5 min, 5000 rpm). The supernatant was withdrawn and the solvent evaporated. The residue was stored in the refrigerator (4°C) in vials wrapped in aluminium foil to prevent degradation caused by light and dissolved in acetonitrile (200 μL) before LC analysis.
LC/MS-MS analysis
The analyses were performed on ACQUITY H (Quaternary Solvent Manager) LC/MS-MS system, equipped with a ACQUITY (Sample Manager-FTN) tray cooled auto-sampler and a ACQUITY (TQ Detector) triple quadrupole mass spectrometer.
Chromatographic separation was performed at 40°C on a C18 ACQUITY UPLC BEH C18 1.7 μm 2.1 × 50 mm (Waters) column. The mobile phase consisted of a 90/10/0.1 mixture of acetonitrile/2- propanol/formic acid in isocratic elution mode. Flow rate: 0.4 mL/min. Injection volume: 10 μL.
Ionization was achieved using electrospray in the positive mode (ESI+); needle voltage: +3100 V; shield voltage: +30 V; source temperature: 150°C; drying gas (N2) flow rate: 600 L/h; drying gas (N2) temperature: 450°C. Multiple Reaction Monitoring (MRM) modes were chosen for the detection, using Argon at a flow rate of 20 L/h as CID gas.
The MRM transitions selected for CoQ10 and the internal standard (IS, CoQ9) are shown in Table 1.
| Analyte | Precursor ion (m/z) | Product ion (m/z) | Dwell ms | Cone (V) | Collision (eV) |
|---|---|---|---|---|---|
| CoQ10 | 863.60 | 197.17 | 0.025 | 42 | 38 |
| CoQ10 | 863.60 | 81.12 | 0.025 | 42 | 66 |
| CoQ10 | 863.60 | 95.16 | 0.025 | 42 | 70 |
| CoQ9 | 795.49 | 197.11 | 0.025 | 34 | 32 |
Table 1: MRM transitions for CoQ10 and CoQ9 (IS).
The transitions from 863.60 to 197.17 and from 795.49 to 197.11 were chosen for the quantification of CoQ10 and CoQ9 respectively.
Statistical analysis
Statistical differences of data were examined by using the Student's t test, calculated by Microsoft Excel software.
Optimization of the Analytical Method
Choice of the Internal Standard (IS)
CoQ9 is an endogenous ubiquinone structurally related to CoQ10; it was chosen as an internal standard because it is not detectable in the small amount of plasma used for the analysis (250 μL), due to its low concentration in human plasma or at least its low amount does not influence its use as IS at the concentrations required for the analyses; therefore it does not interfere in the quantification of the analytes. Moreover it is well separated from CoQ10 (Figures 1a and 1b).
Choice of the anticoagulant
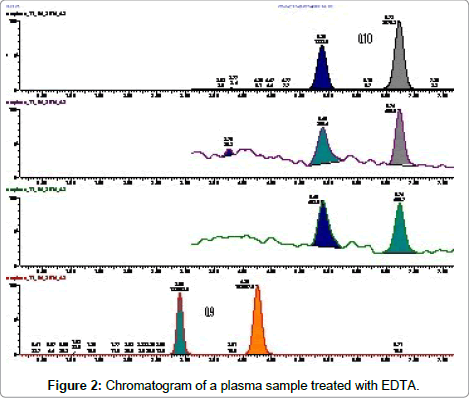
To be stored and analysed plasma samples have to be treated with an anticoagulant. We evaluated three different anticoagulants (EDTA, heparin and sodium citrate), to assure the best specificity and chromatographic response. Treating plasma samples with EDTA another chromatographic peak was detected in the chromatogram either of CoQ10 or of CoQ9 (Figure 2).
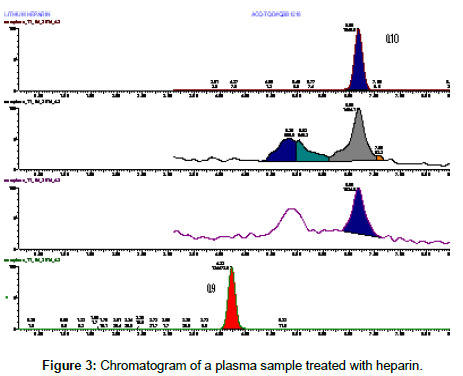
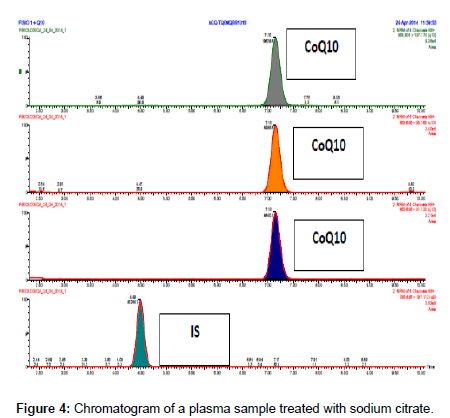
In the case of heparin a cleaner chromatographic profile was obtained (Figure 3), but the highest sensitivity was obtained treating plasma samples with sodium citrate (Figure 4).
Method validation
Reference standard samples and QC samples were prepared in physiological solution because being CoQ10 an endogenous substance, it is impossible to have blank matrices to be spiked. Specificity of the LC/MS-MS was evaluated by repeatedly extracting and analyzing 250 μL of plasma spiked with IS (100 μL, 1 μg/mL), checking the presence of interfering peaks for each MRM at the retention time of the investigated compounds.
For the study of linearity, calibration curves were performed by spiking 250 μL of physiological solution with six increasing concentration levels (10, 25, 50, 100, 200, 300 ngtot) of CoQ10. Analyses were carried out in triplicate. The linearity equation was y=3.49 × 10⁻² x+7.62 × 10⁻³ (R2;=0.9927) indicating a good linearity of the method. The intercept was not significant as toss<ttab (toss=1.874; ttab=2.07; P<0.05).
LOQ was considered as the lowest concentration in which linearity was still satisfied, having a signal to noise ratio of at least 10. LOQ was 10 ngtot of CoQ10. LOD, defined as the lowest concentration of analyte that can be clearly detected, is estimated as three times the signal to noise ratio. The LOD was determined by progressively diluting the solution prepared for the determination of the LOQ and resulted to be 5 ngtot.
Accuracy and repeatability were assessed determining the Response Ratio (RR) as follows. Working standards samples (WSS) were prepared and analyzed to determine RAstd defined as:
RAstd=Astd/AIS
Where Astd is the area of the peak of the quantifier MRM transition of the WSS; AIS is the area of the peak of the quantifier MRM transition of the IS.
Then for each solution the response ratio RR was calculated as:
RR=RAstd / Cstd
Where Cstd is the concentration of the WSS (ng/mL)
Accuracy was evaluated as % recovery according to the following formula:
%REC=(analytical concentration/ real concentration) × 100
Where the analytical concentration of CoQ10 calculated on the basis of the RRmean was then determined as the mean of the six RR obtained for the calibration curves. The real concentration is the effective concentration of CoQ10 present in each sample.
Three different solutions were analyzed in triplicate (50, 100, 200 ngtot of CoQ10 in 250μL of physiological solution). % REC ranged from 91.5 to 99.7% (%CV 4.3%), showing a good degree of accuracy of the method.
Intra-day precision was evaluated analyzing on the same day three different standard solutions at a concentration of 25 ngtot and 100 ngtot and calculating the %CV, which ranged from 3.0 to 4.0. Inter-day precision was assessed analyzing on six different days three different standard solutions at a concentration of 25 ngtot and 100 ngtot and calculating the %CV, which ranged from 15.9 to 4.8.
The calculation of the concentration of the analytes was obtained from the contemporary analysis of three QC (100 ngtot) always applying the following formula:
Cx=RAsample/RRmean
where RRmean is the mean of the response ratio obtained for the three QC.
Stability of CoQ10 in plasma samples
Stability of CoQ10 in plasma samples was deeply investigated. First of all six QC samples (100 ngtot were analyzed to evaluate repeatability and %CV was 6.93%.
Then CoQ10 stability in plasma samples stored at -20°C and 4°C was determined. A pool of frozen plasma samples were mixed and divided in six aliquots. Every aliquot was further divided in two parts: one stored at -20°C and the other heated at 4°C. In the case of samples stored at -20°C a mean concentration of 364.41 ng/mL was obtained (standard deviation: 18.54; %CV 5.09), while in the case of samples stored at 4°C a mean concentration of 402.37 ng/mL was obtained (standard deviation: 41.99; %CV 10.44).
As it is possible to note the variability in CoQ10 concentration is higher in the case of the samples heated at 4°C (% CV 10.44% and 5.09 respectively), but the CoQ10 concentration resulted higher in these samples (mean concentration 402.37 ng/mL), respect to that of the samples stored at -20°C (mean concentration 364.41 ng/mL). So to confirm the stability at 4°C we decided to analyze one plasma sample belonging to one volunteer, divided into five aliquots (Table 2), which were not frozen and in this case we obtained a lower %CV demonstrating that the conservation at 4°C is suitable for CoQ10 analysis. The higher variability of the CoQ10 concentration at 4°C respect to the lower variability at -20°C reported before was therefore probably due to the fact that the plasma samples were initially frozen and then cooled to 4°C.
| CoQ10 Concentration (ng/mL) | Mean | STD | %CV |
|---|---|---|---|
| 497.56 | 497.56 | 26.13 | 5.25 |
| 492.43 | |||
| 518.62 | |||
| 538.20 | |||
| 469.73 |
Table 2: Concentration of CoQ10 in plasma sample stored at 4°C.
To evaluate long term stability five plasma samples were taken into account. After being analyzed, they were stored at 4°C and analyzed after 8 months. The t-test was performed (Table 3), showing that the two series of data are not statistically different (P<0.05), so we concluded that storing the samples at 4°C is a suitable way to preserve CoQ10 even for a long period of time.
| Volunteer | Initial concentration (ng/mL) | After 8 months (ng/mL) |
|---|---|---|
| 1 | 379.6 | 419.9 |
| 2 | 610.0 | 658.1 |
| 3 | 474.2 | 485.7 |
| 4 | 373.7 | 413.3 |
| 5 | 179.5 | 208.9 |
Table 3: Stability of CoQ10 in fresh plasma samples of five volunteers stored at 4°C.
In this way we demonstrated that it is not necessary to store plasma sample at -20 or -80°C as stated in the literature [1,4,8] for the analysis of CoQ10, thus simplifying the analytical procedure. In fact the analysis of frozen samples is more difficult and longer.
Analysis of plasma samples of healthy volunteers
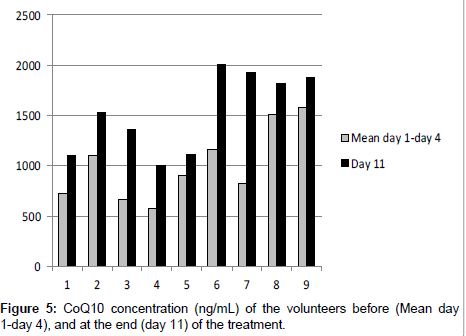
Nine healthy volunteers were monitored for 11 days. Their plasma was analyzed before the treatment (day 1, day 4) and the mean value of CoQ10 concentration was calculated. Then they were supplied with a food supplement containing CoQ10 for 7 days and at the end of the treatment their plasma (day 11) was analyzed. Results are reported in Table 4 and Figure 5.
| Volunteer | Day 1 | Day 4 | Mean day 1- Day 4 | Day 11 | % Increment |
|---|---|---|---|---|---|
| 1 (F) | 669.8 | 791.9 | 730.8 | 1110.4 | 51.9 |
| 2 (F) | 998.5 | 1218.0 | 1108.2 | 1537.1 | 38.7 |
| 3 (M) | 667.1 | 665.7 | 666.4 | 1368.7 | 105.4 |
| 4 (F) | 561.3 | 582.0 | 571.6 | 1005.3 | 75.9 |
| 5 (F) | 872.9 | 949.2 | 911.0 | 1115.6 | 22.4 |
| 6 (F) | 1089.8 | 1248.1 | 1168.9 | 2012.6 | 72.2 |
| 7 (F) | 806.7 | 852.0 | 829.3 | 1926.0 | 132.2 |
| 8 (M) | 1387.8 | 1644.6 | 1516.2 | 1827.6 | 20.5 |
| 9 (M) | 1291.9 | 1877.0 | 1584.4 | 1874.6 | 18.3 |
Table 4: Plasma concentration (ng/mL) and increment of CoQ10 before (day 1, day 4) and after (11 days) the supplementation of nine healthy volunteers (F=Female; M=Male).
The volume of plasma used for the extraction was 250 μL; in the cases in which the CoQ10 concentration exceeded the linearity range a second determination was carried out starting from 100 μL. In this way the CoQ10 concentration fell inside that of the calibration curve.
The series of data were statistically different (P<0.05) at the end of the supplementation of CoQ10. The increment of the plasma concentration of CoQ10 was calculated and in all volunteers there was a significant increment. This demonstrates that the assumption of a food supplement containing CoQ10 could be of help in increasing its plasma concentration in a significant way, affording all the beneficial properties of this ubiquinone.
Conclusion
The validated UPLC/MS-MS method for the determination of CoQ10 in human plasma was applied to the analysis of plasma samples belonging to nine people assuming food supplements containing CoQ10, in order to evaluate the increase of ubiquinone concentration in plasma after oral intake. The concentration of CoQ10 after the supplementation resulted significantly higher in all volunteers, indicating that assuming food supplements containing CoQ10 could be of help for increasing its concentration in plasma to exploit all the beneficial properties of this ubiquinone.
References
- Yuan B, Liu C, Xu P, Lin L,Pan C, et al. (2011) Validated HPLC method for the quantitativedetermination of CoQ10 in dog plasma and its application to apharmacokinetic study. Biomed Chromatogr25:1038-1044.
- ManziP, Durazzo A (2015) Rapid determination of coenzyme Q10 in cheese usinghigh-performance liquid chromatography. Dairy SciTechnol 95: 533-539.
- Ernster L, Dallner G (1995)Biochemical, physiological and medical aspects of ubiquinone function.BiochimBiophysActa 1271: 195-204.
- Arias A,García-Villoria J,Rojo A, Buján N, Briones P, et al. (2012) Analysis of coenzyme Q(10) inlymphocytes by HPLC-MS/MS.J Chromatogr B AnalytTechnol Biomed Life Sci908: 23-26.
- Turunen M, Olsson J, DallnerG (2004) Metabolism and function of coenzyme Q.BiochimBiophysActa 1660:171-199.
- Bentinger M,Brismar K,Dallner G (2007) The antioxidant role of coenzyme Q.Mitochondrion 7 Suppl:S41-50.
- Gleize B,Steib M, André M,Reboul E (2012) Simple and fast HPLC method for simultaneous determinationof retinol, tocopherols, coenzyme Q(10) and carotenoids in complexsamples.Food Chem 134: 2560-2564.
- Belardinelli R,Muçaj A,Lacalaprice F, Solenghi M, Seddaiu G, et al. (2006) Coenzyme Q10 andexercise training in chronic heart failure.Eur Heart J 27: 2675-2681.
- Kumar A,Kaur H, Devi P,Mohan V (2009) Role of coenzyme Q10 (CoQ10) in cardiac disease,hypertension and Meniere-like syndrome.PharmacolTher 124: 259-268.
- Beal MF (2002) Coenzyme Q10as a possible treatment for neurodegenerative diseases. Free Radic Res36:455-460.
- Shults CW (2003) CoenzymeQ10 in neurodegenerative diseases.Curr Med Chem 10: 1917-1921.
- Spindler M, Beal MF,Henchcliffe C (2009) Coenzyme Q10 effects in neurodegenerativedisease.Neuropsychiatr Dis Treat 5: 597-610.
- DiMauro S, Hirano M, SchonEA (2006) Approaches to the treatment of mitochondrial diseases. MuscleNerve 34:265-283.
- Rácz A, Vass A, Héberger K,Fodor M (2015) Quantitative determination of coenzyme Q10 from dietarysupplements by FT-NIR spectroscopy and statistical analysis. AnalBioanalChem 407:2887-2898.
- López-Lluch G,Rodríguez-Aguilera JC, Santos-Ocaña C, Navas P (2010) Is coenzyme Q a keyfactor in aging?Mech Ageing Dev 131: 225-235.
- Montero R, Sánchez-AlcálzarJA, Briones P, Rodríguez Hernández A, Cordero MD, et al. (2008) Analysisof coenzyme Q10 in muscle and fibroblasts for the diagnosis of CoQ10deficiency syndromes. ClinBiochem 41: 697-700.
- Potgieter M, Pretorius E,Pepper MS (2013) Primary and secondary coenzyme Q10 deficiency: the roleof therapeutic supplementation. Nutr Rev 71:180-188.
- Wang Y,Hekimi S (2013)Molecular genetics of ubiquinone biosynthesis in animals.Crit RevBiochemMolBiol 48: 69-88.
- Quinzii CM, Hirano M,DiMauro S (2007) CoQ10 deficiency diseases in adults.Mitochondrion 7Suppl: S122-126.
- Ahmadvand H, Ghasemi-DehnooM (2014)Antiatherogenic, hepatoprotective, and hypolipidemic effects ofCoQ10 inalloxan-induced type 1 diabetic rats. ARYA Atheroscler 10:192-198.
- Pepe S, Marasco SF, Haas SJ,Sheeran FL, Krum H, Rosenfeldt F (2007) Coenzyme Q10 in cardiovasculardisease. Mitochondrion 7:S154-S167.
- Rosenfeldt FL, Haas SJ, KrumH, Hadj A, Ng K, et al. (2007) Coenzyme Q10 in the treatment ofhypertension: a meta-analysis of the clinical trials.J Hum Hypertens 21:297-306.
- Bentinger M,Tekle M, DallnerG (2010) Coenzyme Q--biosynthesis and functions.BiochemBiophys Res Commun396: 74-79.
- Ates O, Bilen H, Keles S,Alp HH, KelesMS, et al. (2013) Plasma CoQ10 levels in type 2 diabeticpatients with retinopathy. Int J Ophthalmol 6:675-679.
- MattilaP, Kumpullainen J (2001) Coenzymes Q9 and Q10: contents in foods anddietary intake. J Food Compos Anal 14:409-417.
- Pravst I,Zmitek K, Zmitek J(2010) Coenzyme Q10 contents in foods and fortification strategies.CritRev Food SciNutr 50: 269-280.
- Tang PH, Miles MV, Steele P,DeGrauw A, Chuck G, et al. (2002) Anticoagulant effects on plasma coenzymeQ(10) estimated by HPLC with coulometric detection.ClinChimActa 318:127-131.
- Galinier A,Carrière A,Fernandez Y, Bessac AM, Caspar-Bauguil S, et al. (2004) Biologicalvalidation of coenzyme Q redox state by HPLC-EC measurement: relationshipbetween coenzyme Q redox state and coenzyme Q content in rat tissues.FEBSLett 578: 53-57.
- Niklowitz P, Menke T, GiffeiJ, Andler W (2005) Coenzyme Q10 in maternal plasma and milk throughoutearly lactation. BioFactors 25:67-72.
- Lucangioli S, Flor S, ContinM, Tripodi V (2009) A capillary electrophoretic system based on a novelmicroemulsion for the analysis of coenzyme Q10 in human plasma byelectrokinetic chromatography Electrophoresis 30:1899-1905.
- Rousseau G,Varin F (1998)Determination of ubiquinone-9 and 10 levels in rat tissues and blood byhigh-performance liquid chromatography with ultraviolet detection.JChromatogrSci 36: 247-252.
- Duncan AJ, Heales SJR, MillsK, Eaton S, Land JM, et al. (2005) Determination of coenzyme Q(10) statusin blood mononuclear cells, skeletal muscle, and plasma by HPLC withDi-propoxy-coenzyme Q(10) as an internal standard. ClinChem 51:2380-2382.
- Wang K, Ohnuma S (1999)Chain-length determination mechanism of isoprenyldiphosphate synthases andimplications for molecular evolution. Trends BiochemSci 24:445-451.
- Mosca F,Fattorini D,Bompadre S, Littarru GP (2002) Assay of coenzyme Q(10) in plasma by asingle dilution step.Anal Biochem 305: 49-54.
- Montero R, Artuch R, BrionesP, Nascimiento A, Vilaseca MA, et al. (2005) Muscle coenzyme Q10concentrations in patients with probable and definite diagnosis ofrespiratory chain disorders. Biofactors 25:109-115.
- Teshima K, Kondo T (2005)Analytical method for ubiquinone-9 and ubiquinone-10 in rat tissues byliquid chromatography/turbo ion spray tandem mass spectrometry with1-alkylamine as an additive to the mobile phase.Anal Biochem 338: 12-19.
- Hahn SH, Kerfoot S, Vasta V(2012) Assay to Measure Oxidized and Reduced Forms of CoQ by LC–MS/MS.MethodsMolBiol837: 169-179.
- ContinM, Lucangioli S, Martinefski M, Flor S, Tripodi V (2011) MiniaturizedHPLC-UV method for analysis of coenzyme Q10 in human plasma. J LiquidChromatogrRel Tech 34:2485-2494.
- Lee BJ, Huang YC, Chen SJ,Lin PT (2012) Coenzyme Q10 supplementation reduces oxidative stress andincreases antioxidant enzyme activity in patients with coronary arterydisease. Nutrition 28:250-255.
- Lee BJ, Huang YC, Chen SJ,Lin PT (2012) Effects of coenzyme Q10 supplementation on inflammatorymarkers (high-sensitivity C-reactive protein, interleukin-6, andhomocysteine) in patients with coronary artery disease. Nutrition 28:767-772.
- Franke AA, Morrison CM,Bakke JL, Custer LJ, Li X, et al. (2010) Coenzyme Q10 in human blood:native levels and determinants of oxidation during processing and storage.Free Rad Biol Med 48:1610-1617.
Relevant Topics
Recommended Journals
Article Tools
Article Usage
- Total views: 13569
- [From(publication date):
specialissue-2015 - Apr 06, 2025] - Breakdown by view type
- HTML page views : 12454
- PDF downloads : 1115

