Research Article Open Access
Designing a Simple Electronic Tongue for Fermentation Monitoring
Matthias Gerstl1*, Martin Joksch2 and Guenter Fafilek1,31Austrian Centre of Industrial Biotechnology (ACIB), Austria
3Vienna University of Technology (VUT), Austria
- *Corresponding Author:
- Dr. Matthias Gerstl
Vienna University of Technology, Institute of Chemical Technology and Analytics
Getreidemarkt 9/164-EC, 1060 Vienna, Austria
Tel: +43-1-58801-15854
Fax: +43-1-58801-15899
E-mail: matthias.gerstl@tuwien.ac.at
Received date: November 27, 2013; Accepted date: December 27, 2013; Published date: December 31, 2013
Citation: Gerstl M, Joksch M, Fafilek G (2013) Designing a Simple Electronic Tongue for Fermentation Monitoring. J Anal Bioanal Tech S12: 002. doi: 10.4172/2155-9872.S12-002
Copyright: © 2013 Gerstl M, et al. This is an open-access article distributed under the terms of the Creative Commons Attribution License, which permits unrestricted use, distribution, and reproduction in any medium, provided the original author and source are credited.
Visit for more related articles at Journal of Analytical & Bioanalytical Techniques
Abstract
A method for monitoring a biotechnological fermentation using cyclic voltammetry in combination with chemometrics, commonly termed electronic tongue, is proposed. A simple palladized palladium electrode showed excellent sensitivity to glucose concentrations ranging from 0 to 9 g/L in a yeast fermentation medium (pH 5.3, 0.07 M chloride). This electrode is also sensitive to ethanol, but not able to separate it from the glucose signal. To separately quantify mixtures of glucose and ethanol as the product of yeast fermentations at least one additional electrode with different sensitivities is needed. Platinized platinum shows the required features. Long term stability is still an obstacle for application.
Introduction
Analysis of biotechnological fermentations is a hot topic in such diverse industries as pharma [1], food [1,2], bio-fuel production [3] and wastewater treatment [4] to name a few. A common problem for both running established fermentations as well as testing new ones is monitoring of the process parameters, as even slight aberrations can lead to reduced yield or even a complete failure. Therefore it is highly desirable to have a powerful real-time online monitoring system available to allow for timely intervention when a process parameter starts to run off limits [5]. Depending on the fermentation in question, such a system would have to monitor a large range of parameters. Cheaply and easily monitored parameters would include temperature, pH and oxygen partial pressure, by implementing commercial off the shelve probes. However, for dissolved reactants, products and by-products such instrumentation is not generally available, as these species obviously differ from case to case [2]. There do exist analytical solutions, which rely on a variety of sensor types, often enzyme based bio-sensors, to quantify a range of parameters [6-8]. While it is certainly possible to combine several sensors to accommodate the present analytical requirements, such a system is bound to be expensive and maintenance intensive [9].
Therefore a simpler system relying only on one acquisition method would be cherished improvement. Cyclic voltammetry is a relatively low cost method, which records the electrochemical properties of a working electrode in a solution, such as oxidation or reduction of redox active analytes. This voltage resolved current information has also been dubbed electrochemical spectroscopy [10,11]. It seems feasible that by combining several electrodes, each tuned to be more specific to a certain substance, a number of analytes could be quantified in parallel. However, it is unlikely that full specificity for one substance is possible with simple metal electrodes; cross sensitivities are to be expected. Therefore multivariate data analysis is needed to extract the analytical information of these electrochemical spectra. The combination of several sensors, in this case electrodes and their evaluation with chemometric signal processing is usually referred to as an electronic tongue [12].
The present contribution intends to present a proof of concept of such an electronic tongue approach on model yeast fermentation. The analytes of interest are mainly glucose as the nutrient and secondarily ethanol as the product.
Non-enzymatic glucose detection is a highly active field in itself, mainly because of the expected increasing number of diabetes patients and the corresponding need to replace the current enzymatic detection with a cheaper alternative. A large number of electrodes have been proposed, usually catalyzed using nano-patterned metals, combined with amperometric detection [9,13,14]. Despite this large number of publications and the intense research interest, no compelling breakthroughs have been reached yet. Furthermore, with some notable exceptions [15], the sensors have only been tested in model solutions of weak to strong basic pH levels and barring any interfering species. The fermentation medium used in the present contribution is acidic and contains redox active compounds as well as chloride anions, which are known inhibitors [16,17].
Materials and Methods
Noble metal wires of varying diameters, platinum chloride and tetra-ammine-palladium-chloride were purchased from Oegussa (Vienna, Austria) with a purity of 99.99%. Pd-Paste was obtained from Gwent Electronic Materials (Pontypool, United Kingdom). Ash-free medium retention filters were bought from Machery-Nagel (Dueren, Germany).
Cyclic voltammogramms were recorded on an Autolab PGSTAT 128N using the Nova 1.9 software (both Metrohm Autolab, Utrecht, The Netherlands). A saturated Mercury sulfate electrode was used as a reference electrode.
Data handling and Partial Least Squares (PLS) regression was done using the Scikit-learn package for the Python programming language [18].
Electrodes were prepared by leading a noble metal wire (diameters ranging from 100 to 250 μm) through a thin glass tube with subsequent melting of one end by melting the glass in a Bunsen burner to create a watertight seal. The wire was then grinded to 4000 grit to create a defined surface area of the electrode.
Electrochemical surface modifications of the electrode were done by dipping the micro-electrode in a solution of the corresponding metal ions and applying an AC voltage of 2Vtrms with 300 Ohm resistor in series for a few seconds.
The composition of medium 1, the inorganic components of Dulbecco´s modified Eagle medium [19], is given in Table 1. All components were purchased from Merck, Germany.
| Component | Concentration [mg/L] |
|---|---|
| CaCl | 200 |
| FeNO3.(H2O)9 | 0.1 |
| KCl | 400 |
| MgSO4 | 100 |
| NaCl | 6400 |
| NaH2PO4.H2O | 125 |
Table 1: Composition of medium 1, a variation of Dulbecco´s modified Eagle medium.
The composition of the yeast fermentation medium (medium 2) is given in Table 2, all components were purchased from Alfa Aesar, United States. The acidity of pH 5.3 was adjusted by hydrochloric acid and sodium hydroxide, both Merck, Germany.
| Component | Concentration [g/L] |
|---|---|
| (NH4)2SO4 | 8.0 |
| MgSO4.(H2O)7 | 1.15 |
| NH4H2PO4 | 1.25 |
| KCl | 5.0 |
| CaCl2. (H2O)2 | 0.42 |
| Baker's yeast | 1.0 |
| Trace elements | Concentration [mg/L] |
| FeCl3.(H2O)6 | 15 |
| ZnSO4.(H2O)7 | 9.0 |
| CuSO4.(H2O)5 | 2.5 |
| MnSO4.H2O | 10 |
| Myo-inositol | 105 |
| Ca-D-pantothenat | 10 |
| Biotin | 1.0 |
Table 2: Composition of the yeast fermentation medium.
Results and Discussion
Electrode selection
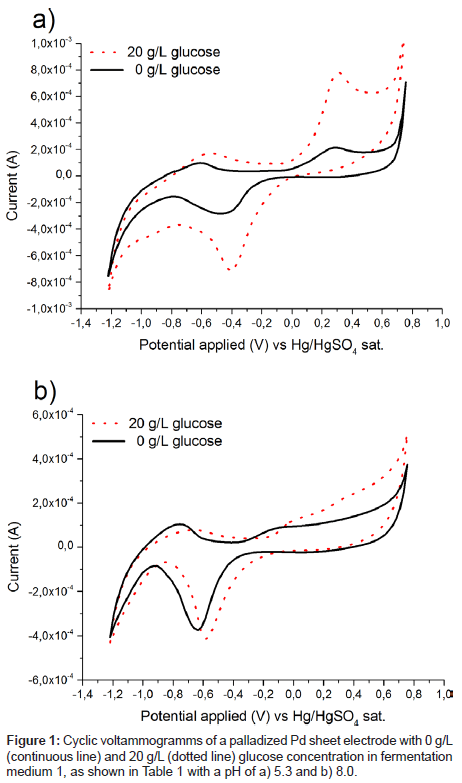
Several electrodes consisting of polished or activated metals as well as combinations of several metals or alloys were tested for their catalytic activity towards glucose and ethanol in fermentation medium 1, as shown in Table 1, at pH 5. Surprisingly a palladized palladium sheet electrode gave a very pronounced peak for glucose oxidation, as shown in Figure 1a. While palladium nanoparticles have been used as a catalyst for glucose detection in neutral to basic pH regimes [20-23], to the best of our knowledge, no such reports exist for acidic media containing chloride anions. To the contrary, a considerably worse catalytic performance was observed, when the medium was alkalized to pH 8, as shown in Figure 1b.
Catalytic activity on platinum has been shown to drop dramatically when chloride ions were added to the system [17] and palladium was expected to behave similarly. No in depth explanation for this result can be given at the moment, but it will certainly lead to follow on research. However, the onset of glucose oxidation coincides with the start of palladium oxide formation (Figure 1). This indicates that bound oxygen on the surface is needed for the oxidation, which is in agreement with the theory of glucose oxidation on platinum [16,17,24].
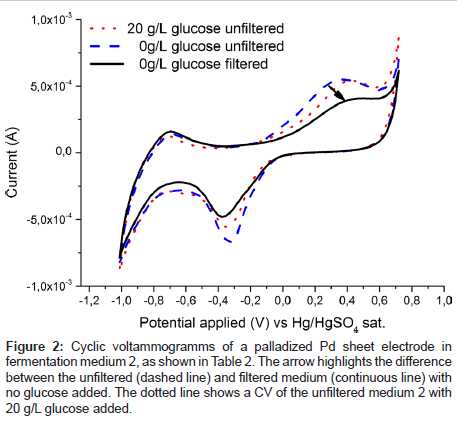
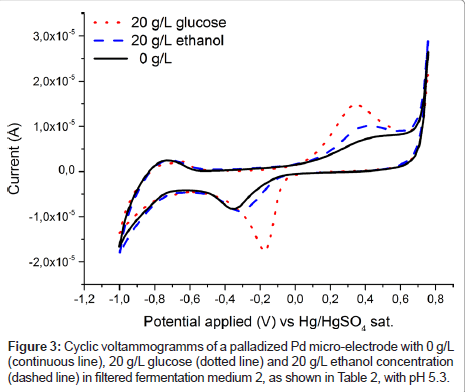
To estimate the applicability of the palladium electrode for glucose detection in a real fermentation, spectra were recorded in fermentation medium 2 (Table 2) and are plotted in Figure 2. It is immediately obvious that in contrast to Figure 1 no clear glucose specific oxidation peak is visible. Rather even the glucose free medium exhibits a broad oxidation response to one or more redox active substances in present in fermentation medium 2 (Table 2). However, after passing the liquid through a filter the unspecific oxidation signal vanishes, (Figure 2) and the familiar specific glucose oxidation peak is once again recorded (Figure 3). Which substance exactly caused the blockage of the electrode is not yet known and was out of scope for this contribution. From an application based standpoint the filtration step does not add much complexity, as the electrode can be placed inside of a ceramic filter.
Figure 2: Cyclic voltammogramms of a palladized Pd sheet electrode in fermentation medium 2, as shown in Table 2. The arrow highlights the difference between the unfiltered (dashed line) and filtered medium (continuous line) with no glucose added. The dotted line shows a CV of the unfiltered medium 2 with 20 g/L glucose added.
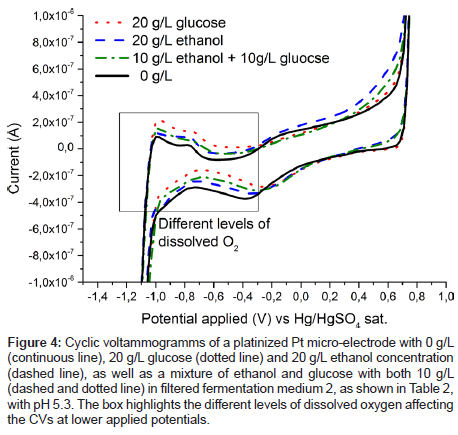
Figure 3 also shows the cyclic voltammogram of the Pd electrode in filtered medium 2 containing ethanol, the anticipated product in yeast fermentation. While the current response to glucose is higher, both substances are oxidised in the same voltage region. This again suggests that chemisorbed oxygen is needed on palladium for oxidation of the organic substances, as has been shown to be the case for platinum [16,17,24]. However, this overlap of oxidation peaks is making it impossible to separate ethanol and glucose signals, and in the following their respective concentrations, with the use of a palladium electrode alone. Therefore, at least one additional electrode, which is more sensitive to ethanol concentration, would be needed to quantify both substances. This criterion can be satisfied by an additional measurement on a platinized platinum electrode, as shown in Figure 4. The spectrum for the measurement in the solution containing solely glucose does not differ from the spectrum containing no analyte at all, at least in the anodic region from about -200 to 750 mV vs. SMSE. On the other hand, ethanol is oxidised in this region, albeit far not as demonstrative as the oxidation signal for glucose on palladium. The difference in the graphs for the lower applied voltages can be attributed to varying levels of dissolved oxygen. However, in fermentation processes oxygen is continuously supplied by bubbling air through the system, hence this effect cannot be used for reliably quantifying glucose.
Figure 4: Cyclic voltammogramms of a platinized Pt micro-electrode with 0 g/L (continuous line), 20 g/L glucose (dotted line) and 20 g/L ethanol concentration (dashed line), as well as a mixture of ethanol and glucose with both 10 g/L (dashed and dotted line) in filtered fermentation medium 2, as shown in Table 2, with pH 5.3. The box highlights the different levels of dissolved oxygen affecting the CVs at lower applied potentials.
Concentration dependence
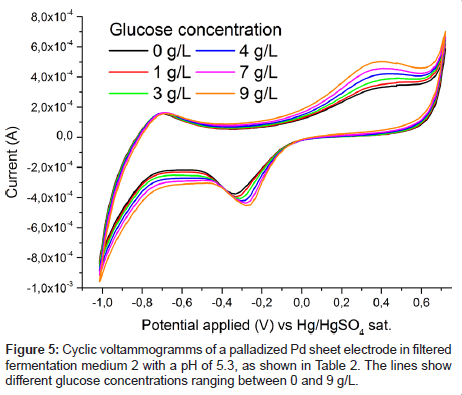
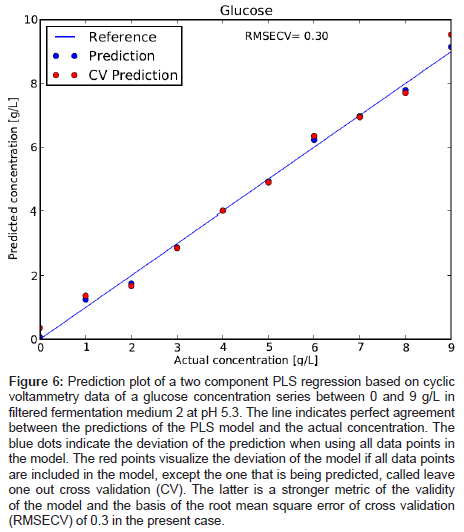
To verify the concentration dependence of the glucose signal, a series of glucose levels in medium 2 was measured and is plotted in Figure 5. A clear stepwise increase of the characteristic oxidation peak with glucose concentration is observed. No saturation of the electrode response is reached between 0 and 9 g/L glucose concentration. By applying a PLS regression to the data, the cross validated error for the prediction of the glucose concentration was about 0.3 g/L (Figure 6). This value is deemed remarkable for such a quick and cheap measurement technique in a system very close to application.
Figure 6: Prediction plot of a two component PLS regression based on cyclic voltammetry data of a glucose concentration series between 0 and 9 g/L in filtered fermentation medium 2 at pH 5.3. The line indicates perfect agreement between the predictions of the PLS model and the actual concentration. The blue dots indicate the deviation of the prediction when using all data points in the model. The red points visualize the deviation of the model if all data points are included in the model, except the one that is being predicted, called leave one out cross validation (CV). The latter is a stronger metric of the validity of the model and the basis of the root mean square error of cross validation (RMSECV) of 0.3 in the present case.
Longterm stability
The logical next step would be appear to gather sufficient data of glucose and ethanol concentrations and mixtures thereoy to build a statistically robust PLS model. However, for this strategy to work out, the electrodes have to produce a stable signal over a long term. While this is case for the platinum electrode, the palladium electrode loses sensitivity over extended time periods (Figure 7). The signal loss usually sets in after cycling the electrode between 10 and 50 times and then happens gradually from cycle to cycle, sometimes accelerated by larger steps, as shown in the inset in Figure 7. This can be interpreted as decreasing active sites by “sooting” of the active sites by reaction products, backed by the fact that the electrode can be reactivated by mechanically cleaning the electrode with a cloth. However, after applying this crude cleaning procedure a few times the sensitivity is not always restored to exactly the same level as before. This might very well be explained by mechanical break off of the active sites, i.e. nanoparticles or whiskers. We like to link the larger steps in the long term degradation process, also to mechanical loss of these reaction sites.
Figure 7: Degradation of the glucose signal (continuous line) in the cyclic voltammogramm of a palladized Pd sheet electrode in filtered fermentation medium 2, as shown in Table 2, with pH 5.3 and 20 g/L glucose. For comparison the CV of medium 2 without glucose is plotted as well (dashed line). The arrow indicates the decay of the signal. The inset highlights an especially large decay step.
Conclusion
In this short contribution it was shown that nano-rough palladium electrodes, manufactured by simple electrochemical deposition, can be used to detect and quantify glucose and, to a lesser degree, ethanol in an acidic fermentation medium containing 0.07 M chloride ions. To the best of our knowledge no such report existed to date. The analysis was done using cyclic voltammetry in combination with chemometric data evaluation. The glucose detection on palladium is surprisingly sensitive, as chloride is thought to inhibit oxidation for platinum type metals, especially in acidic media [16,17,24]. Mixtures of both analytes in the medium would require at least one additional electrode for separate quantification, as ethanol and glucose are oxidised at roughly the same voltage range. While not an ideal solution a simple platinized platinum electrode offered a complementary specificity to ethanol.
While these initial results proved to be very encouraging, the long term stability of the palladium electrode is not satisfying and certainly not yet applicable for integration in a real fermentation monitoring system. Moreover, no long term stability reports for other nonenzymatic glucose sensors are known, indicating a general problem [25]. However, the possible reward of having a cheap and fast method for fermentation monitoring certainly warrants further research.
Furthermore, a detailed study about the pH dependence of the mechanism of glucose oxidation in chloride containing media is called for, as the favourable results presented here are quite opposite of what could have been expected.
Acknowledgements
The authors gratefully acknowledge financial support of the ACIB project “New Sensor Technologies for Bioprocess Monitoring” and the SIEMENS Company.
References
- Baldwin EA, Bai J, Plotto A, Dea S (2011) Electronic noses and tongues: applications for the food and pharmaceutical industries. Sensors (Basel) 11: 4744-4766.
- Escuder-Gilabert L, M Peris (2010) Review: Highlights in recent applications of electronic tongues in food analysis. Anal Chim Acta 665: 15-25.
- Rudnitskaya A, Legin A (2008) Sensor systems, electronic tongues and electronic noses, for the monitoring of biotechnological processes. J Ind Microbiol Biotechnol 35: 443-451.
- Bourgeois W, Burgess JE, Stuetz RM (2001) On-line monitoring of wastewater quality: a review. J Chem Technol Biotechnol 76: 337-348.
- Maiti SK, Srivastava RK, Bhushan M, Wangikar PP (2009) Real time phase detection based online monitoring of batch fermentation processes. Process Biochemistry 44: 799-811.
- Backer M, Delle L, Poghossian A, Biselli M, Zang W, et al. (2011) Electrochemical sensor array for bioprocess monitoring. Electrochimica Acta 56: 9673-9678.
- Clark AM, Sousa KM, Jennings C, MacDougald OA, Kennedy RT (2009) Continuous-flow enzyme assay on a microfluidic chip for monitoring glycerol secretion from cultured adipocytes. Anal Chem 81: 2350-2356.
- Odman P, Johansen CL, Olsson L, Gernaey KV, Lantz AE (2009) On-line estimation of biomass, glucose and ethanol in Saccharomyces cerevisiae cultivations using in-situ multi-wavelength fluorescence and software sensors. J Biotechnol 144: 102-112.
- Chen X, Wu G, Cai Z, Oyama M, Chen X (2013) Advances in enzyme-free electrochemical sensors for hydrogen peroxide, glucose, and uric acid. Microchim Acta 1-17.
- Heinze J (1984) Cyclic Voltammetry-“Electrochemical Spectroscopy”. New Analytical Methods (25). Angew Chem Int Ed Engl 23: 831-847.
- Nicholson RS (1965) Theory and Application of Cyclic Voltammetry for Measurement of Electrode Reaction Kinetics. Anal Chem 37: 1351-1355.
- Vlasov Y, Legin A, Rudnitskaya A, Natale CD, D’Amico A (2005) Nonspecific sensor arrays ("electronic tongue") for chemical analysis of liquids (IUPAC Technical Report). Pure and Applied Chemistry 77: 1965-1983.
- Toghill KE, RG Compton (2010) Electrochemical Non-enzymatic Glucose Sensors: A Perspective and an Evaluation. Int J Electrochem Sci 5: 1246-1301.
- Wang G, He X, Wang L, Gu A, Huang Y, et al. (2013) Non-enzymatic electrochemical sensing of glucose. Microchim Acta 180: 161-186.
- Zhang Y, Liu Y, Su L, Zhang Z, Huo D, et al. (2014) CuO nanowires based sensitive and selective non-enzymatic glucose detection. Sensors and Actuators B: Chemical 191: 86-93.
- Vassilyev YB, Khazova OA, Nikolaeva NN (1985) Kinetics and Mechanism of Glucose Electrooxidation on Different Electrode-Catalysts: Part I. Adsorption and Oxidation on Platinum. Journal of Electroanalytical Chemistry and Interfacial Electrochemistry 196: 105-125.
- Vassilyev YB, Khazova OA, Nikolaeva NN (1985) Kinetics and Mechanism of Glucose Electrooxidation on Different Electrode-Catalysts: Part II. Effect of the Nature of the Electrode and the Electrooxidation Mechanism. Journal of Electroanalytical Chemistry and Interfacial Electrochemistry 196: 127-144.
- Pedregosa F, Varoquaux G, Gramfort A, Michel V, Thirion B, et al. (2011) Scikit-learn: Machine Learning in Python. J Mach Learn Res 12: 2825-2830.
- Dulbecco R, Freeman G (1959) Plaque production by the polyoma virus. Virology 8: 396-397.
- Doluda VY, Tsvetkova IB, Bykov AV, Matveeva VG, Sidorov AI, et al. (2013) D-glucose catalytic oxidation over palladium nanoparticles introduced in the hypercrosslinked polystyrene matrix. Green Processing and Synthesis 2: 25-34.
- Wang Q, Cui X, Chen J, Zheng X, Liu C, et al. (2012) Well-dispersed palladium nanoparticles on graphene oxide as a non-enzymatic glucose sensor. Rsc Advances 2: 6245-6249.
- Meng L, Jin J, Yang G, Lu T, Zhang H, et al. (2009) Nonenzymatic electrochemical detection of glucose based on palladium-single-walled carbon nanotube hybrid nanostructures. Anal Chem 81: 7271-7280.
- Hermans S, Deffernez A, Devillers M (2011) Au-Pd/C catalysts for glyoxal and glucose selective oxidations. Applied Catalysis A: General 395: 19-27.
- Burke LD (1994) Premonolayer Oxidation and Its Role in Electrocatalysis. Electrochim Acta 39: 1841-1848.
- Sun A, Zheng J, Sheng Q (2012) A highly sensitive non-enzymatic glucose sensor based on nickel and multi-walled carbon nanotubes nanohybrid films fabricated by one-step co-electrodeposition in ionic liquids. Electrochim Acta 65: 64-69.
Relevant Topics
Recommended Journals
Article Tools
Article Usage
- Total views: 15879
- [From(publication date):
specialissue-2014 - Jul 05, 2025] - Breakdown by view type
- HTML page views : 11172
- PDF downloads : 4707

