Research Article Open Access
Deriving Cost-Efficient Strategies for Observational Assessments of Postural Loads
Mahmoud Rezagholi*Department of Business and Economic Studies, Division of Economics, University of Gävle, SE-801 76 Gävle, Sweden
- *Corresponding Author:
- Mahmoud Rezagholi
Division of Economics
Department of Business and Economic Studies
University of Gävle, SE-801 76 Gävle, Sweden
Tel: +46(0)26648757
Fax: +46(0)26648686
E-mail: madrei@hig.se
Received date: June 03, 2014; Accepted date: August 25, 2014; Published date: August 28, 2014
Citation: Rezagholi M (2014) Deriving Cost-Efficient Strategies for Observational Assessments of Postural Loads. Occup Med Health Aff 2:174. doi: 10.4172/2329-6879.1000174
Copyright: © 2014 Rezagholi M. This is an open-access article distributed under the terms of the Creative Commons Attribution License, which permits unrestricted use, distribution, and reproduction in any medium, provided the original author and source are credited.
Visit for more related articles at Occupational Medicine & Health Affairs
Abstract
Studies aimed at optimizing resource allocation between different sampling stages are characterized by both simplicity and incompleteness in optimization and economic analysis. The aim of this study was therefore to completely resolve the allocation problem for a four-stage strategy devoted to observational assessment of workrelated postural loads with the precision of the mean estimate considered as ‘output’. The derived demand functions for inputs to the four stages were used to derive functions for the minimized cost and the maximized precision of the assessment strategy. The application of the theoretical results to a working posture assessment study led to increased cost efficiency of the assessment strategy investigated in the study. Under the additional constraint that the optimal values must be integers, optimization of this strategy would result in either a 12% reduction in cost or a 7% increase in precision.
Keywords
Assessment strategy; Demand function; Technical efficiency; Productive efficiency; Cost function
Introduction
When designing studies to assess occupational exposures, the decision-making process includes not only the choice of an appropriate measurement method, but also the determination of an efficient number of participants and an efficient number of repeated measurements for each participant. Several authors using ANOVA to examine performance sampling strategies in assessment of work-related physical loads [1-4] have argued that statistical power and precision can be improved if the sample size of inputs with greater variability is increased. For instance, if the between-subject variance is higher than the within-subject variance, these authors suggest that the power and precision will be improved by increasing the number of subjects instead of the number of recordings per subject. The optimal input demand in each sampling stage should, however, be determined not only on the basis of the random error in that stage but also taking into account the corresponding cost. Although usable methodologies for optimizing the cost and error of sampling strategies have been available in the sampling statistics literature for some decades [5,6], there is no empirical study on optimization of strategies used to assess work-related physical loads [7]. Moreover, there are important sources of random error that are not taken into consideration in the assessment strategies usually applied in these studies. Exposure assessment studies usually only consider between-subject and within-subject uncertainties, but betweeninvestigator and within-investigator uncertainties are also important, particularly when subjective assessment techniques are used. The latter two sources of error have not previously been considered in optimizing assessment strategies though the effects of the investigator’s (observer’s) education and experience on the precision of exposure mean estimates have been discussed [8-10]. However, a study by Rezagholi et al. [11] showed that the work intensity of a design (i.e. the numbers of observers and repeated assessments) strictly influenced not only the precision of the mean estimate but also the cost efficiency of that design. Input demands in all the important stages should therefore be optimized according to their cost-efficiency; that is, on the basis of their effects on the cost and precision of the assessment strategy. Observer-based sources of variable costs and errors should also be included in the costefficiency analysis, particularly when no direct technical measurement methods are employed. If these sources are excluded, the design that is identified as optimal may in fact not be the true optimal strategy.
A cost-efficient assessment strategy either maximizes the precision of the mean exposure estimate subject to a certain cost (predetermined budget), or minimizes the total cost of achieving a required precision. Only a few studies have aimed at optimizing resource allocation between different stages of exposure assessment, and none of them focused on physical loads [12-15]. There is also a theoretical optimization study hypothesizing a non-linear model for estimating the total cost of a three-stage sampling, while omitting observer-based sources of variable costs and errors in the supposed cost and statistical models [16]. The cost-efficiency studies, however, suffer from ambiguity or linearity in cost-output relationship, incompleteness in optimization procedure and economic analysis, and confusion and/or simplicity in the estimation and analysis of input costs [7]. No study derived a cost function showing the minimized cost as a function of all cost components and the output (i.e. the statistical efficiency in terms of precision or statistical power), despite the fact that the cost function is the basis for economic evaluation of a production technology [17]. Further, none of these studies made economic interpretations based on comparative static analysis of the derived functions (i.e. comparison analysis of different economic outcomes before and after a change in some underlying exogenous parameters as costs). The purpose of the present study was to provide cost-efficient strategies for observational assessments of work-related postural loads, by optimizing resource allocation between important stages of the posture assessment. In addition, as a necessary tool for economic analysis, salient econometric measures were estimated on the basis of the statistical cost and demand functions derived in this study. The optimization problem was resolved by using the models and principles developed in sampling methodology [5,18] and production economics [19,20]. An algorithm was also developed to address the problem of possible deviation from the optimal solution when the optimal values must be adjusted to integers, an issue which has not previously been addressed in the relevant literature. The ambition was to supply theoretical and methodological frameworks for optimally determining inputs to stages of exposure assessments under different conditions.
Methodology
Two known optimization approaches were formulated for providing cost-efficient strategies devoted to observational assessment of working postures. The optimal input demand functions for each stage of posture assessment were then derived, interpreted, and statically analysed. The functions of minimized cost and maximized precision were also derived. The two optimization approaches were then put into practice using empirical data and information from a study by Rezagholi et al. [11].
Assessment strategy
The assessment strategy chosen for optimization was a four-stage design consisting of a two-stage observation work design and a twostage data collection procedure; this is the same structure of assessment strategies used in the study from which the empirical data were drawn [11]. The two-stage observation work design referred to the number of observers and the number of repeated assessments per observer; and the two-stage data collection procedure consisted of the number of subjects and the number of recordings per subject over time. The four input demands to be optimized were thus the numbers of subjects (ns), observers (no), exposure recordings per subject (nr), and repeated assessments per observer (na). Accordingly, four sources of random error, which were assumed to be constant in this study, were considered: between-subject (  ), between-observer (
  ), withinsubject (
  ), and within-observer (
  ). The total cost of the fourstage strategy was made up of the costs of recruiting subjects, recruiting observers, making the recordings, and performing the assessments. The average unit costs in each stage of posture assessment, denoted as
  , and
, and  , respectively, were assumed to be constant during the optimization analysis.
Technical method
In optimizing the assessment strategy, the technical methods used for exposure assessments (and thus their effects on sources of cost and error) were considered in principle to be predetermined and constant. A certain video-based observational approach was chosen in combination with the four-stage assessment strategy.
Optimization approaches
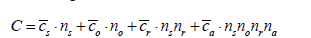
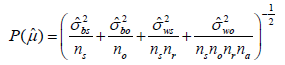
Two interchangeable objective and constraint functions were used in optimizing the four-stage assessment strategy: one for the total cost, C, and one for the expected precision of the mean exposure estimate,  ; both are based on the functions that used by Rezagholi et al. [11] for estimating the variable costs and errors:
 (1)
(1)
 (2)
(2)
where 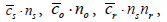 and
and  are the total costs of recruiting subjects, recruiting observers, making the recordings, and performing the assessments, respectively, and
  is defined as the inverse of the standard error of the mean estimate. The two problems in optimal resource allocation are to minimize the total cost of achieving a desired level of precision (the precision-required problem), and to maximize the precision of the group mean estimate for a limited cost (the budget-constrained problem). Both problems are solved by determining the optimal values of inputs ns ,no, nr, and na . The precision-required cost minimization problem and the budgetconstrained precision maximization problem were defined as
1) Min 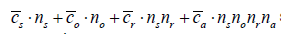 subject to
 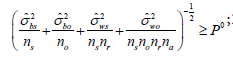 ; 2) Max
 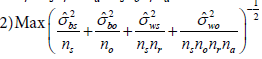 subject to
  ; both with respect to the inputs ns ,no, nr, and na ; P0 and B0 denote the predetermined precision and budget, respectively. All constant parameters such as costs and random errors were assumed to be positive, and all input demands were included as strictly positive integers.
The Lagrange multiplier method was used to resolve the constrained optimization problems.
Productive efficiency, technical efficiency, cost elasticity of output, and returns to scale as four important aspects of economic performance [21-24] are developed for the assessment strategy:
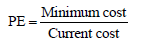
The productive efficiency, PE, was measured as the minimized cost of the optimal strategy divided by the cost of the current strategy as follows:
 (3)
(3)
The cost saved through elimination of productive inefficiency was then obtained as 1− PE .
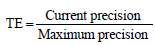
The technical efficiency, TE, of the current non-optimal assessment strategy was measured as the precision yielded by this strategy divided by the precision maximized by the optimal strategy:
 (4)
(4)
The gain in precision through the elimination of technical inefficiency was then obtained as 1-TE.
The cost elasticity of precision, EPc, defined as the percentage change in the minimized cost per unit percentage change in the level of precision, was obtained by differentiating the derived cost function with respect to precision in logarithms as follows
 (5)
(5)
EPc gives information about economies of scale, referring to the cost advantages that a researcher obtains due to expansion, while its inverse gives information about the returns to scale associated with the exposure assessment study.
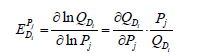
Based on the derived demand functions for the four inputs, the decision-maker will be able to predict the number of percentage points by which the optimal demands should change as a result of a one percent change in corresponding costs. This econometric concept is called the own-price elasticity of demands, EDP , [24] and is measured as follows:
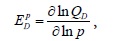 (6)
(6)
where QD is the quantity of demand. The own-price elasticity of demand shows the sensitivity of the quantity demanded of an input to the changes in its cost. For  , the demands are inelastic (not sensitive to changes in cost), while for
 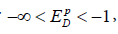 , the demands are elastic (sensitive to changes in cost).
Theoretical Results
Maximizing precision subject to a budget constraint gives the same condition that was necessary for minimizing the cost of achieving a required precision. According to economic principles, the conditions for realizing an optimal choice hold where the ratio of marginal products (marginal product of an input is the change in output resulting from an additional unit of the input) of two inputs is equal to their corresponding cost ratio; that is, where  Based on the function (2), this condition is derived as follows:
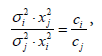 (7)
(7)
where i and j refer to inputs and x stands for the total numbers of subjects, observers, recordings, and assessments
Demand functions
Cost-minimized demand functions for the four inputs are derived by using the first-order conditions for the solution of the cost minimization problem:
 (8)
(8)
where 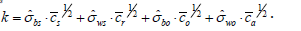
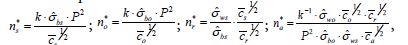
The precision-maximized demand functions for the four inputs are also derived by using the first-order conditions for the solution of the precision maximization problem:
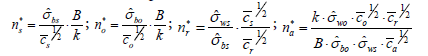 (9)
(9)
In both optimization approaches, the same demand function for the number of recordings per subject is derived. The optimal number of recordings per subject is independent of any requirement in the precision of the mean estimate or constraint in research budget; it is a function solely of within-subject to between-subject variance ratio and subject-to-recording cost ratio. However, the optimal demands of the independent variables (the numbers of subjects and observers) exhibit a function of constraints in the optimization problems in addition to all cost and variance components. For a higher precision requirement in the cost-minimization approach and a greater budget in the precisionmaximization approach, the demand for subjects and observers would increase. However, the demand function for the number of assessments per observer in each approach is negatively related to the constraint (desired level of precision or fixed budget).
Cost function
The cost-minimized optimal values of inputs are substituted into the objective function (1) in order to derive the following statistical cost function:
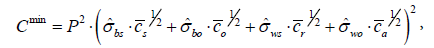 (10)
(10)
which can be rewritten more simply as  . The average cost (AC) and marginal cost (MC) of improving the precision by one unit are obtained as follows:
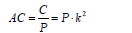 (11)
(11)
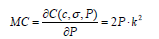 (12)
(12)
The derived cost function (10) shows the minimum amount of cost necessary to achieve a desired level of precision, and has the following properties:
Shephard’s lemma [22] holds:  where xi* denotes the optimal values of ns ,no, nsnr, and nsnonrna.
The optimal value of the Lagrange multiplier, λ* , is equal to the rate at which the cost increases as the required precision is increased; that is, the marginal cost: 
The cost function is increasing in P; that is, an increase in the required precision would lead to an increase in the total (minimized) cost: 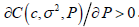 . It is also non-decreasing in c:
 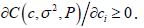 .
.
The cost function is linear homogeneous in c: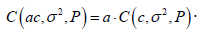
The cost function is continuous and concave in 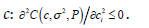 .
.
Proof that the above properties hold is given in the Appendix.
The logarithmic form of the cost function is:
 (13)
(13)
The cost elasticity of precision, EPc = 2 , reveals that the marginal cost of improving precision by one unit is twice the average cost of producing it. It is worth noting that this result is due to the decreasing returns to scale that characterize the statistical model structure, since  .
.
Substituting the precision-maximized demand functions for inputs into the precision formula (2), or simply using the duality property of optimality and solving the cost function (10) for P, the maximized precision of the mean estimate as a function of the research budget would be:
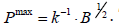 (14)
(14)
which can be rewritten more simply as 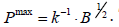 . The value function shows the highest precision in exposure assessment that could be achieved at a given research budget.
The own-price elasticities of the (cost-minimized) demands are:
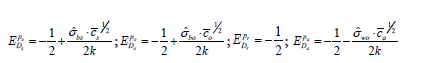 (15)
(15)
and the own-price elasticities of the (precision-maximized) demands are:
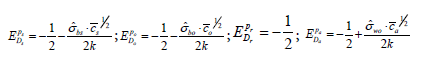 (16)
(16)
Application
An empirical example
data for the empirical example are drawn from a study by Rezagholi et al. [11], in which a non-optimized but relatively costefficient assessment strategy, specified as ns = 4, no = 4 , nr = 1, and na = 2 (“many assessments few samples”, or MAFS) was used to assess upper arm postures of hairdressers in Umeå, Sweden. The calculations below describe the process of optimizing MAFS when used for assessing the mean angle at which the hairdressers held their upper arms while working.
The estimated average costs based on data and information from the study and also the variance components given by the study are presented in Table 1.
 |
 |
 |
 |
 |
 |
 |
 |
 |
 |
 |
| 18.7 | 4.9 | 34.6 | 86.9 | 97 | 465 | 360 | 22 | 17.22 | 0.241 | 4392 |
Table 1: Variance and cost components, current precision of group mean estimate, and total cost (TC) in SEK associated with MAFS.
Using the cost-saving observational technique called WS120 in the above mentioned study, the current non-optimal assessment strategy would yield a precision of around 0.241 and require a total cost of 4392 SEK. These values are considered the ‘required precision’ and the ‘predetermined budget’ for exposure assessment when optimizing the current strategy.
Precision-requiring cost minimization
To provide a cost-minimized assessment strategy while ensuring that the precision of the mean estimate does not drop below the current precision (i.e.  ≥ 0.241), according to equation set (8) the optimal demands for inputs would be ns* = 6.25 , no* = 1.46 , nr* = 0.71 and na* = 4.39. Because non-integer values cannot be used in practice, they should be rounded to the nearest integers, giving ns* = 6.25 , no* = 1 , nr* = 1 and na* = 4 . However, these adjustments produce a drop in precision which, though negligible, takes the precision below the required level. Although the adjusted strategy is more cost-saving than the one currently used, it is not yet optimal due to the deviation from the required precision. To avoid any deviation from the requirement, while minimizing cost, an appropriate algorithm should be used. That is, all possible strategies that yield a precision not absolutely less than 0.241 should first be found based on the derived strategy; and then the cheapest, which will be closer to the minimized cost obtained by (10), should be selected. In this context, the alternative strategies can be generated by separately increasing each of the four inputs by one unit in order to eliminate the deviation caused by the adjustments. As shown in Table 2, the precision-constrained cost-minimized assessment strategy among four possible alternatives is given by the set of ns* = 6 , no* = 1 , nr* = 1 and na* = 5. The practically usable cost-minimized strategy costs 3867 SEK with a precision (= 0.245) exceeding 0.241.
| Assessment strategy |  |
TC |
| ns = 7 ; no = 1 ; nr = 1; na = 4 | 0.253 | 4280 |
| ns = 6 ; no = 2 ; nr = 1; na = 4 | 0.276 | 4728 |
| ns = 6 ; no = 1 ; nr = 2 ; na = 4 | 0.280 | 6423 |
| ns = 6 ; no = 1 ; nr = 1 ; na = 5 | 0.245 | 3867 |
Table 2: Possible choices for precision-constrained cost-minimized assessment strategies.
The precision provided by the cost-minimized assessment strategy is estimated at 0.245, which exceeds the desired level of precision. According to equation (3), the productive efficiency of the current strategy (MAFS) is 0.88, and so the cost saving made possible by using the cost-minimized strategy (i.e. through elimination of the productive inefficiency of MAFS) is thus 0.12. Researchers in the study by Rezagholi et al. [11] could thus save 12% of the resources (525 SEK) by using the cost-minimized assessment strategy, while the precision of the mean posture assessment would also be slightly increased.
The own-price elasticities of the cost-minimized demands are presented in Table 3.
| EPsDs | EPoDo | EPrDr | EPaDa |
| -0.41 | -0.40 | -0.50 | -0.59 |
Table 3: Own-price elasticities of the cost-minimized input demands.
All the values in the table above are between zero and minus one, meaning that the optimized demand functions are not sensitive to changes in costs. If, for instance, the average unit cost of recruiting a subject increases by 10%, the demand for subjects should be decreased by 4.1%. However, after adjustment to the nearest integer, the new number of subjects (5.75) does not affect the optimized demand ( = 6 ).
Budget-limited precision maximization
To maximize the precision of the mean estimate under the condition that the total cost does not exceed the current cost (4392 SEK), equation set (9) gives the optimal values ns* = 7.85 , no* = 1.84 , nr* = 0.71 and na* = 3.49. After adjustment, the precision-maximized assessment strategy is thus ns* = 8 , no* = 2 , nr* = 1 and na* = 3 . However, these adjustments are not affordable because the cost of providing the adjusted strategy (=5642 SEK) would dramatically exceed the predetermined budget. To prevent the cost from exceeding its constraint, the closed alternative strategies that absolutely would not cost over 4392 SEK should be found, and then the most precise of them should be selected. To reduce the total variable cost of strategy by at least 1250 SEK, the numbers of subjects, observers, and assessments per observer should be gradually reduced until the suggested cost decreases below the predetermined budget. According to the algorithm, there are five alternatives for compensating the excess cost. The optimal strategy is found when the adjusted numbers of subjects and assessments per observer are reduced to 6 and 2, respectively. Thus, as shown in Table 4, the budget-constrained precision-maximized assessment strategy is specified as ns* = 6 , no* = 2 , nr* = 1 and na* = 2.
| Assessment strategy | |
TC |
| ns = 5; no = 2 ; nr = 1; na = 3 | 0.250 | 3875 |
| ns = 7 ; no = 1 ; nr = 1; na = 3 | 0.245 | 4126 |
| ns = 6 ; no = 2 ; nr = 1; na = 2 | 0.259 | 4200 |
| ns = 7 ; no = 1 ; nr = 1; na = 2 | 0.231 | 3972 |
| ns = 8 ; no = 1 ; nr = 1; na = 1 | 0.211 | 4297 |
Table 4: Possible choices for budget-constrained precision-maximized assessment strategies.
The derived strategy will cost 4200 SEK, which is less than the predetermined research budget, while the precision is significantly increased. Equation (4) gives the technical efficiency of the non-optimal strategy (MAFS) as 0.93; the gain in precision through elimination of the strategy’s technical inefficiency is thus 0.07. Use of the precision- maximized strategy in the study by Rezagholi et al. [11] would lead to a 7% improvement in the technical efficiency of the assessment strategy, while the total variable cost would be reduced by 192 SEK.
The own-price elasticities of the precision-maximized demands are presented in Table 5.
| EPsDs | EPoDo | EPrDr | EPaDa |
| -0.59 | -0.60 | -0.50 | -0.41 |
Table 5: Own-price elasticities of the precision-maximized input demands.
Again, in this approach the optimized demand functions are not sensitive to changes in costs. If, for instance, the cost of recruiting observers increases by 10%, the demand for observers should be decreased by 6%. However, the new number of observers (1.88) does not change the optimized demand.
Discussion
Two approaches were used in this paper in order to completely optimize the four-stage strategy applied by Rezagholi et al. [11] for assessing upper arm postures, and the cost, variance, and demand functions of the strategy were derived on the basis of the cost and variance equations used in the study. The derived functions were also put into practice using data from the aforementioned study.
As expected, the demand for each input had a positive relation with its uncertainty but a negative relation with its cost. However, the associations did not hold cross-wise: an increase in the cost of each input would principally decrease its demand, but at the same time, could increase the demand for another input due to the substitution effects in the posture assessment study. The fact that the demand functions for repeated assessments per observer were decreasing in P and B was unexpected, but can be explained as follows. An increase in the research budget when maximizing the precision of the mean estimate would decrease the demand for the input, because the increased budget would optimally result in allocating more resources to the inputs with higher productivity (ability to improve precision). However, according to (2), the number of assessments per observer was the least productive input. Similarly, an increase in the required precision when minimizing cost would decrease the demand for this input because the higher required precision would be achieved by using more of the cost-saving inputs, and this input was the least cost-saving input according to the isocost line equation (1).
In both optimization approaches, the own-price elasticity of demand for each input was inelastic (between 0 and -1), meaning that a major change in cost would be required to adjust the corresponding optimal demand.
The non-linear input-precision relationship indicated by the precision formula (2) also leads to a non-linear cost-precision relationship, verified by the cost function (10). The character of the statistical model structure (decreasing returns to scale, DRS) means that the marginal cost of precision exceeds its average cost. A rational decision-maker would not improve precision in this case. However, since the marginal cost cannot be compared with the marginal benefit of precision, care must be taken to verify any diseconomies of scale associated with the statistical production (i.e. the posture assessment study).
In the numerical example, the decision-maker could choose to implement either the cost-minimized strategy to save 12% of the cost, or the precision-maximized strategy to improve the precision by 7%. It is worth noting that the size of the cost savings and precision improvement offered by the optimizations are only related to the posture assessment study, and could be more substantial if the currently-used strategy had higher productive and technical inefficiencies. The inefficiencies associated with the four-stage strategy applied by Rezagholi et al. [11], however, were low (i.e. the strategy was yet relatively cost-efficient).
Output specifications and ‘simplicity’
The optimized solutions were derived by applying the traditional model structure of sampling cost and variance developed in sampling methodology, as described by equations (1) and (2). There are two main reasons to employ this model in optimizing the strategy devoted to posture assessments. Firstly, there is a practical need for closed solutions to optimize the initially employed assessment strategy, and thus to explore the possibility of increasing its cost-efficiency. Secondly, as the precision of posture assessments evaluated by an additive random effects model was considered as the output in the study by Rezagholi et al. [11], it should also be considered as the output of posture assessment study in the present study, and the cost model should be constructed accordingly.
In the sampling optimization studies, the precision of the mean estimate is defined as the inverse of its variance [13,15,16]. As the variance is estimated with an additive random effects model, the precision is linear homogeneous in the inputs; that is, the exposure assessment study is subject to constant returns to scale. This property also means that the cost is linear homogeneous in precision, when the marginal cost is always equal to the average cost. The simplicity cannot be remedied by hypothesizing non-linear isocost lines. Allowing the costs to vary non-linearly with the sampling units at each stage, as Mathiassen and Bolin [16] allowed in their model, was not relevant in the long-run optimization problems. Usually, sampling strategies are optimized for an exposure assessment study over a longer period; and the labour productivity and learning curves at each stage of the exposure assessment are sharply increasing in initial attempts, but even out gradually over time. Thus, the labour cost curves, which are sharply decreasing at the beginning of the assessment study, will also smooth out over time. However, by defining the precision of the mean estimate as the inverse of the standard error in the present paper, the linearity in the input-precision and thus the cost-precision relationship vanished according to equations (2), (10), and (13).
Inputs to the posture assessment could be optimized using structures adapted from the complex cost functions which have been developed in production economics [19]. However, the estimation of advanced cost functions would have required time series, cross-sectional data, or a pooled empirical dataset, none of which were available. Furthermore, in order to apply standard cost functions, the usefulness and the quality of information produced on the working posture would have to be valued in monetary terms [23] as is usual for the benefits in costbenefit analysis, even in health economics [25]. By using standard cost functions, economic decisions regarding the size of the exposure assessment study might be made on the basis of information about the marginal and average costs of producing information on the exposure.
Deviations from constraints
The adjusted optimal values of the inputs, regardless of the objective of optimization, deviated from the constraints (required precision and predetermined research budget, respectively). The optimal assessment strategy could not employ, for instance, 0.71 recordings per subject; and so the derived values had to be adjusted to strictly positive integer values. However, these adjustments caused the precision and the cost to deviate from the required precision and the predetermined budget, respectively. The practical solution to this problem was to first increase/decrease the inputs to the point where the deviations from the unadjusted constraints were acceptable, and then to identify the optimal assessment strategy among all possible alternatives (cf. Tables 2 and 4).
Regardless of the complexity of the models, the problem of deviations from constraints should always be taken into consideration in future studies as long as the inputs to the exposure assessment cannot be continuous; and the Lagrangian function containing the discrete variables will be differentiated in any case during the optimization procedure.
Measurement bias and optimization approach
The four-stage strategy used to assess the upper arm postures was optimized in two approaches. However, for these budget-constrained and precision-constrained optimizations, the posture assessment study should not be subject to any significant systematic error that varies depending on the inputs. Otherwise, optimizing the input demands at each stage could also lead to an increase in some systematic error associated with the posture assessment study [26]. Thus, when there is a significant source of bias associated with a given input, its effect on the statistical efficiency of exposure mean assessments should be considered in the error equation.
Econometric issues
The own-price elasticity of demand and the cost elasticity of precision are not the only econometric measures that could be used as tools for decision-making on input demands. For example, the demand for an input may change as a result of a change in the price of another input. This occurrence is called cross-price elasticity of demand, EDiPj which measures the percentage change in demand for an input as the price of another input changes by one percent [24]:
 (17)
(17)
The sign of EDiPj depends on substitution/complementation between the two inputs in the exposure assessment study. If the two inputs are complements in the study, the sign is negative; if they are substitutes, the sign is positive.
Elasticity of substitution between any two inputs, σij , measures the percentage change in the ratio of inputs resulting from a one percent change in the corresponding price ratio [Ibid]. It is usually introduced as a measure of the relationship between the technical rate of substitution and the input ratio as follows:
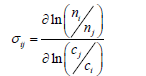 (18)
(18)
The greater the elasticity of substitution, the greater will be the input substitution effects of changes in input prices.
Finally, the elasticity of cost with respect to one input cost, Eci C , is used to predict the minimized total cost following partial change in an input price. The measure is equal to the cost share of that input using Shephard’s lemma [22]:
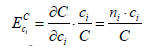 (19)
(19)
Conclusion
Strategies devoted to assessing occupational exposures should be optimized in either their technical or productive efficiency as soon as data on average costs and variance components are available; the relatively cost-efficient strategies can be improved by optimization. The optimized assessment strategies can be applied over the long term, since the optimized demand functions for inputs are not sensitive to changes in costs. For additional improvement of precision, the marginal benefit of precision should also be assessed in order to allow an economic evaluation of the exposure assessment study.
Acknowledgements
Division of Occupational and Public Health Sciences, University of Gävle, is acknowledged for its supports in writing this article. The study was supported by grants from the Swedish Council for Working Life and Social Research (FAS DNr. 2005-0183 and 2009-1761).
References
- Burdorf A (1995) Reducing random measurement error in assessing postural load on the back in epidemiologic surveys.Scand J Work Environ Health 21: 15-23.
- Mathiassen SE, Burdorf A, van der Beek AJ (2002) Statistical power and measurement allocation in ergonomic intervention studies assessing upper trapezius EMG amplitude. A case study of assembly work.J ElectromyogrKinesiol 12: 45-57.
- Nordander C, Balogh I, Mathiassen SE, Ohlsson K, Unge J, et al. (2004) Precision of measurements of physical workload during standardised manual handling. Part I: surface electromyography of m. trapezius, m. infraspinatus and the forearm extensors.J ElectromyogrKinesiol 14: 443-454.
- Mathiassen SE, Paquet V (2010) The ability of limited exposure sampling to detect effects of interventions that reduce the occurrence of pronounced trunk inclination.ApplErgon 41: 295-304.
- Cochran WG (1977). Sampling techniques (3rd edn.,) Wiley; ISBN 0-471-16240-7.
- Sukhatme PV, Sukhatme BV, Sukhatme S, Asok C (1984) Sampling theory of surveys with applications. Iowa State University Press, Ames ISBN-13: 978-0210225196.
- Rezagholi M, Mathiassen SE (2010) Cost-efficient design of occupational exposure assessment strategies--a review.Ann OccupHyg 54: 858-868.
- Ebersole ML, Armstrong TJ (2006) Analysis of an observational rating scale for repetition, posture, and force in selected manufacturing settings.Hum Factors 48: 487-498.
- Kazmierczak K, Mathiassen SE, Neumann P (2006). Observer reliability of industrial activity analysis based on video recordings. Int J IndustErgon 36: 275-282.
- Andrews DM, Arnold TA, Weir PL (2008) Errors associated with bin boundaries in observation-based posture assessment methods and their effect on peak and cumulative low back loads. Occupational Ergonomics 8: 11-25.
- Rezagholi M, Mathiassen SE, Liv P (2012) Cost efficiency comparison of four video-based techniques for assessing upper arm postures.Ergonomics 55: 350-360.
- Spiegelman D (1994) Cost- efficient study designs for relative risk modeling with covariate measurement error. J Stat Plan Inference 42: 187-208.
- Stram DO, Longnecker MP, Shames L, Kolonel LN, Wilkens LR, et al. (1995) Cost-efficient design of a diet validation study.Am J Epidemiol 142: 353-362.
- Duan N, Mage DT (1997) Combination of direct and indirect approaches for exposure assessment.J Expo Anal Environ Epidemiol 7: 439-470.
- Whitmore RW, Pellizzari ED, Zelon HS, Michael LC, Quackenboss JJ (2005) Cost/variance optimization for human exposure assessment studies.J Expo Anal Environ Epidemiol 15: 464-472.
- Mathiassen SE, Bolin K (2011) Optimizing cost-efficiency in mean exposure assessment--cost functions reconsidered.BMC Med Res Methodol 11: 76.
- Catherine J, Morrison P (1999) Cost structure and the measurement of economic performance. Kluwer Academic PublishersISBN 0-7923-8403-2.
- Groves RM (2004) Survey errors and survey costs. Wiley 2004 ISBN 978-0-471-67851-9.
- Chambers RG (1994) Applied production analysis: a dual approach. Cambridge University Press ISBN 0-521-31427-5.
- Berndt ER (1996) The practice of econometrics: Classic and contemporary. Hardcover ISBN 0-201-49900-2
- Kopp RJ (1981) The measurement of productive efficiency: a reconsideration. Quart J Econ 96: 477-503.
- Shephard RW (1970) Theory of cost and production functions. Princeton University Press ISBN 0691041989.
- Rezagholi M, Bantekas A (2014) Optimizing the Fraction of Expensive Direct Measurements in an Exposure Assessment Study. International Journal of Statistics in Medical Research 3: 44-45.
- Bantekas A (1992) Three essays on discrimination and factor demand. Uppsala Univisity.
- McIntosh E, Clarke P, Frew EJ, Louviere JJ (2010) Applied methods of cost-benefit analysis in health care. Oxford University Press 2010; ISBN 978-0-19-923712-8.
- Biemer PP, Lyberg LE (2003) Introduction to Survey Quality. John Wiley & Sons ISBN 0-471-19375-5: pp. 35-43.
Relevant Topics
- Child Health Education
- Construction Safety
- Dental Health Education
- Holistic Health Education
- Industrial Hygiene
- Nursing Health Education
- Occupational and Environmental Medicine
- Occupational Dermatitis
- Occupational Disorders
- Occupational Exposures
- Occupational Medicine
- Occupational Physical Therapy
- Occupational Rehabilitation
- Occupational Standards
- Occupational Therapist Practice
- Occupational Therapy
- Occupational Therapy Devices & Market Analysis
- Occupational Toxicology
- Oral Health Education
- Paediatric Occupational Therapy
- Perinatal Mental Health
- Pleural Mesothelioma
- Recreation Therapy
- Sensory Integration Therapy
- Workplace Safety & Stress
- Workplace Safety Culture
Recommended Journals
Article Tools
Article Usage
- Total views: 14575
- [From(publication date):
October-2014 - Jul 06, 2025] - Breakdown by view type
- HTML page views : 9955
- PDF downloads : 4620