Decoding Factors Contributing to Socio-Economic Inequalities in Malnutrition among Children in India
Received: 27-Apr-2018 / Accepted Date: 12-Jan-2019 / Published Date: 26-Jan-2019 DOI: 10.4172/2161-1165.1000366
Abstract
Sluggish progress in the nutritional status of children in India is a matter of concern for the government, as well as civil society. The present study examines the changes in the likelihood of childhood malnutrition and also analyses the factors contributing to socio-economic inequality in malnutrition between 2005 and 2016, using data from the third (2005-06) and fourth (2015-16) rounds of the National Family Health Survey. Over the last decade, there has been a decline of 10 percentage points in the level of stunting and seven percentage points in underweight. However, the pace of the decline is more pronounced in the non-Empowered Action Group (non-EAG) states than the Empowered Action Group (EAG) states. The adjusted effect of various predictors of childhood malnutrition indicates that the most significant predictors of stunting and underweight are mother's education, being from scheduled caste households and belonging to the lowest wealth quintile. These findings are also confirmed by the predicted probability of stunting and underweight, which shows that the probability of stunting has declined by 8 and 13 percent among the poorer and richer wealth quintiles, respectively, from 2005-2016. There was also a substantial decrease in the predicted probability of stunting by the mothers’ educational attainment, even among those with no education. Decomposition analysis indicates that the largest contributions to inequality in childhood stunting come from household wealth (46%), followed by parental education (11%). Similarly, those characteristics are responsible for 47 and 23 percent, respectively, of the likelihood of children being underweight. Existing inequalities in malnutrition among children highlight the importance of focusing on maternal nutrition as a strategy to minimise malnutrition among their children, promoting improvements in child feeding practices, and enhancing the effectiveness of child health programmes. Programmes should focus on promoting exclusive breastfeeding, timely supplementary feeding, and growth monitoring, as well as adopting different approaches to interventions in EAG states and other states.
Keywords: Malnutrition; Stunting; Underweight; Wasting; Inequality; Decomposition; India
Background
Nutrition has been recognised as a cornerstone of social and economic development in every nation. Child malnutrition is often considered to be a factor that reduces the rate of human development and economic growth, leading to intergenerational poverty and inequality. Social investment in health along with socio-economic conditions of the households play a pivotal role in determining individual health achievements, especially in a society characterised by pervasive poverty and a deficiency in the provision of basic needs. Social and ethnic disparities along with the lack of basic health care services contribute to child malnutrition [1].
In the current scenario, food insecurity may not be a major determinant of malnourishment in India since many children are malnourished even in households with no food insecurity. Poor nutrition of young children may be due to inappropriate infant and young child feeding and child care practices, poor access to health services, lack of baby friendly hospitals, lack of an adequate continuum of care, lack of immunisation coverage, and recurrent infections. In many countries where malnutrition is widespread, food production is not the limiting factor [2]. Socio-economic inequality has been found to significantly affect stunting in developing countries. Researchers suggest that the reduction of poverty and strengthening of health infrastructure will help improve child health and nutrition. Child malnourishment is an important cause of mortality and morbidity. It interferes with educational attainment and productivity, resulting in the transmission of intergenerational poverty and socio-economic inequality. In the Indian context, child malnourishment is disproportionately a burden on the poor and among children living in economically weaker states in India, indicating that it is a leading result of poverty [3].
Childhood malnutrition plays an important role in the deaths of children under the age of five years in India. Even children that survive despite being malnourished may become impaired across major parts of their life course and may have limited capacity to resist disease and to carry out physical work. Later in the life course, malnutrition and obesity are important causes of many non-communicable diseases (NCDs) like hypertension, diabetes, cancer, stroke, and ischemic heart disease. Using the LiST (Lives Saved Tool) model, BMGF has estimated that about 621,000 deaths to children under age five in India (46% of total deaths under age five) can be attributed to malnutrition or malnutrition aggravated deaths. India, which has 17 percent of the global population, bears 28 percent of the global burden of stunting [4,5]. Eleven percent of the global burden of stunting is concentrated in only two states, namely Bihar and Uttar Pradesh which comprise of only 4 percent of the global population. Despite a decline in the prevalence of stunting among children under age five, from 51 percent in NFHS-2 (1998-99) to 48 percent in NFHS-3 (2005-06) and further to 38 percent in NFHS-4 (2015-16), the improvement over 17 years of time is substantial, but not uniform across states. The major research questions emerging from the existing evolution in malnutrition are what have been the nature of changes in socio-economic inequalities in malnutrition among children in India over the last decade and what are the major factors that contribute to socio-economic inequalities in malnutrition among children under the age of five years. Answers to these questions would be helpful in understanding the nature and pattern of socio-economic inequalities in childhood malnutrition in India, and identifying potential areas for socio-economic and health interventions. Therefore, the present study aims to analyse key contributors to socio-economic inequalities in malnutrition among children in India over the last decade.
Data and Methods
The basic data used in this paper have been taken from two rounds of National Family Health Surveys, namely NFHS-3 (2005-06) and NFHS-4 (2015-16). NFHS-3 was conducted in 2005-06, shortly after the National Rural Health Mission (NRHM) was launched. The primary objective of the 2015-16 NFHS was to provide essential data on health and family welfare, as well as data on emerging issues including the nutritional status of women age 15-49, men age 15-54, and children under age five. In all, NFHS-4 covered 601,509 households, 699,686 women, and 103,525 men from 28,583 Primary Sampling Unites (PSUs) comprising villages in rural areas and Census Enumeration Blocks (CEBs) in urban areas spread across 640 districts in India [6,7]. The findings of this study are based on a total of 246,482 children under the age of five years in NFHS-4. The biomarkers covered measurements of height, weight, and hemoglobin levels for children and height, weight, hemoglobin levels, blood pressure, and random blood glucose levels for women age 15-49 years and men age 15-54 years. For the anthropometric data, height and weight were measured for children age 0-59 months, women age 15-49 years, and (in a subsample of households) men age 15-54 years. The Seca 874 digital scale was used to measure the weight of children. The height of children age 24-59 months was measured with the Seca 213 stadiometer, while the Seca 417 stadiometer was used to measure the recumbent length of children under two years or less than 85 cm. Details about the NFHS-4 design, tools and protocols are presented in the NFHS-4 national report (IIPS and ICF, 2017) and all relevant information are available in public domain at http://rchiips.org/NFHS/index.shtml.
Statistical methods
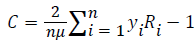
At the first step, bivariate analysis was applied to analyse the trend in malnutrition among children below age five years in India. Further, multivariate logistic regression analysis was carried out to observe the adjusted effects of various independent variables on malnutrition. The study further used the concentration index to quantify the magnitude of socio-economic disparities in childhood malnutrition. The concentration index (C) was computed as twice the (weighted) covariance of the health variables (‘stunting and underweight’ in the present study) and an individual’s relative rank in terms of economic status, divided by the variable mean, according to equation (1) below:
 (1)
(1)
Where n is the sample size, μ is the mean of yi (stunted/underweight in our case) and Ri is the fractional rank of the ith individual in terms of the index of household economic status.
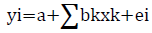
Turning to the decomposition analysis, it is natural to expect that inequalities in the prevalence of stunting and underweight would reflect inequalities in the determinants of stunting and underweight. Let us suppose that the variation in y (prevalence of stunting/ underweight) can be explained by a linear regression model
 (2)
(2)
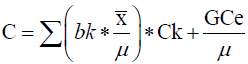
Where a and bk are parameters to be estimated, xk is the determinants and ei is an error term. It can then be shown that given the relationship between and in equation (2), the concentration index for, can be written as:
 (3)
(3)
Where x̅ is the mean of xk, and Ck is the concentration index for xk (defined analogously to C). The last term, which is computed as a residual, is a generalised concentration index for ei and is defined as:
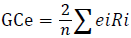
Equation (3) is made up of two components: the deterministic component bk*(x̅k/μ)*Ck and a residual component GCe/μ. In the deterministic component, is the estimated elasticity of (prevalence of stunting/underweight) with respect to xk. The contribution of each xk (explanatory variable) to explain inequality (inequality in the prevalence of stunting and underweight) is then derived by multiplying the elasticity component by the corresponding concentration index Ck. The residual component reflects the inequality that cannot be explained by systematic variation across districts’ economic development levels in the determinants of y, the xk variables.
Results
Levels and trends in malnutrition among children in any community are driven by a large number of factors related to infant and young child care and nutrition; adequacy and effectiveness of health interventions; promotion of newborn care and the continuum of child care services; community nutrition to ensure a healthy, hygienic, caring, and nutritionally secure environment; and intensification of counselling to reach the critical age groups, including pregnant and lactating mothers. As these factors may differ across caste, class, and socio-economic groups, they are expected to lead to malnutrition differentials by context and environments in which children are growing up. Table 1 shows the trend in malnutrition among children below five years of age in India by some selected background characteristics [8]. The trend in the prevalence of malnutrition has been analysed in terms of stunting, wasting, and underweight as the nutritional indicators for children under five years of age. Over the last decade, there has been a substantial decline in the proportion of stunted children (from 48% to 38%) and of underweight children (from 43% to 36%) in India. The study found that the decrease in both stunting and underweight between NFHS-3 and NFHS-4 was larger among female children than male children. Children age 12 months and above have higher prevalence of stunting, as well as underweight, than children age less than 11 months [9].
| Background variables | Stunting | Wasting | Underweight | |||
|---|---|---|---|---|---|---|
| NFHS-3 | NFHS-4 | NFHS-3 | NFHS-4 | NFHS-3 | NFHS-4 | |
| Sex of child | ||||||
| Male | 42.1 | 37.6 | 19.9 | 22.4 | 36.3 | 34.2 |
| Female | 40 | 34.4 | 18.9 | 20.9 | 36.3 | 32.2 |
| Age of child | ||||||
| 0-5 m | 18.2 | 20.3 | 28.2 | 29.6 | 25.8 | 25.8 |
| 6-11 m | 25.1 | 23.7 | 25.4 | 25.9 | 29.2 | 27.9 |
| 12-23 m | 48 | 42.3 | 20.1 | 21.1 | 37.9 | 33.9 |
| 24-35 m | 50.6 | 42.2 | 16 | 19.3 | 40.5 | 36.4 |
| 36 and above | 44.1 | 41.9 | 15.3 | 17.3 | 39.1 | 37.3 |
| Birth size of baby | ||||||
| Average and above | 39.2 | 35 | 17.8 | 21.1 | 33.5 | 31.7 |
| Below average | 49.1 | 44.4 | 26 | 26.6 | 47.6 | 45.1 |
| Mother's education | ||||||
| No education | 52.1 | 47.1 | 24.1 | 25.5 | 48.4 | 46 |
| Primary education | 45.3 | 41.1 | 20 | 23.2 | 39.1 | 37.8 |
| Secondary education | 34.2 | 31.6 | 16.2 | 20.2 | 28.4 | 28.7 |
| Higher education | 18.3 | 19.9 | 13.1 | 17.2 | 14.9 | 17 |
| Father's education | ||||||
| No education | 53.6 | 48 | 24.9 | 25.5 | 49.6 | 46.3 |
| Primary education | 48.1 | 42.7 | 21 | 24.8 | 43.6 | 40.7 |
| Secondary education | 38.6 | 33.8 | 18.2 | 20.6 | 33 | 30.8 |
| Higher education | 23.2 | 22.9 | 13.7 | 18.8 | 19.6 | 21.2 |
| BMI of mother | ||||||
| Underweight | 49.1 | 43.5 | 26.3 | 29.3 | 48.4 | 46.5 |
| Normal | 39.3 | 35.7 | 17.4 | 20.7 | 32.9 | 32.1 |
| Overweight/Obese | 27 | 24.6 | 9.6 | 14.8 | 18 | 18.6 |
| Initiation of breast feeding | ||||||
| Within 1 hour | 42.5 | 35.3 | 20.3 | 21.3 | 38.3 | 33.8 |
| After 1 hour | 38.2 | 35.9 | 17.6 | 21.9 | 32.1 | 33 |
| Birth order | ||||||
| 1-2 | 31.2 | 33.6 | 18 | 21.1 | 31.2 | 31.3 |
| 3-4 | 39.7 | 41.2 | 19.8 | 22.3 | 39.7 | 37.9 |
| 5 or more | 35.5 | 47.1 | 23.9 | 23.8 | 49.1 | 44.6 |
| Mother's age at birth of child | ||||||
| 11-19 | 50.1 | 42 | 18.3 | 20.5 | 42.5 | 38.1 |
| 20-24 | 42.9 | 38.3 | 18 | 20.9 | 36.2 | 34.9 |
| 25-29 | 40.4 | 36.8 | 17.8 | 20.1 | 35 | 32.9 |
| ≥ 30 | 44.1 | 38.6 | 18.9 | 19.5 | 37.4 | 33.4 |
| C-Section delivery | ||||||
| No | 45.8 | 40.2 | 18.6 | 21 | 39 | 36.3 |
| Yes | 26 | 27 | 14.1 | 16.7 | 21.7 | 23.2 |
| Place of residence | ||||||
| Rural | 45.2 | 38.3 | 21.1 | 22.3 | 41 | 35.4 |
| Urban | 34.8 | 29.9 | 16.9 | 19.9 | 29 | 27.1 |
| Religion | ||||||
| Hindu | 44 | 39 | 19 | 21.8 | 39 | 36.7 |
| Muslim | 45.9 | 39.6 | 17.5 | 18.3 | 37.8 | 33.4 |
| Christian | 39.5 | 33.3 | 13.8 | 13.2 | 25.9 | 20.5 |
| Other | 36.4 | 27.4 | 13.7 | 16.8 | 26.1 | 22.7 |
| Caste | ||||||
| Scheduled caste | 50.6 | 43.3 | 19.7 | 21.6 | 44.2 | 39.5 |
| Scheduled tribes | 47.1 | 39.7 | 20.6 | 21.6 | 39.4 | 34.7 |
| Other backward caste | 45.9 | 39.4 | 19 | 20.8 | 40.1 | 36.3 |
| Other | 36.1 | 30.4 | 15.7 | 17.9 | 29.7 | 26.8 |
| Wealth quintiles | ||||||
| Poorest | 56.1 | 49.2 | 28.3 | 28 | 55.5 | 49.1 |
| Poor | 50.7 | 41.5 | 22.1 | 22.8 | 46.2 | 37.7 |
| Middle | 44.9 | 34.4 | 19.7 | 19.8 | 38 | 30.1 |
| Richer | 37.2 | 27.5 | 16.8 | 18.5 | 30.7 | 24.4 |
| Richest | 23.9 | 21.8 | 13.5 | 17.3 | 19.1 | 18.7 |
| Total | 48 | 38.4 | 19.8 | 21 | 42.5 | 35.7 |
Table 1: Malnutrition among children below the age of 5 years in India by background characteristic, 2005-2016.
The nutritional status of children below age five in rural areas has improved in the last decade; there has been a seven-percentage point decline in stunting and a six-percentage point decline among underweight children, but the decrease is still smaller than in urban areas. The children whose size was below average at the time of birth were more likely to be malnourished in terms of each of the indicators of malnutrition in NFHS-4. The prevalence of stunting (27%), wasting (17%) and underweight (23%) is lower if the delivery was done by Csection. The study found a positive relation between birth order and malnutrition [10,11]. As birth order increases, the prevalence of stunting, wasting and underweight also increases. In the last decade, there was a decline in the prevalence of stunting, as well as underweight, among children below five years of age in every caste group, but children from the scheduled caste and schedule tribe groups were still more likely to suffer from stunting and underweight. Children of parents with no educational attainment are more likely to be stunted, wasted, and underweight. Although there has been a decline in the prevalence of stunted and underweight children below five years of age over the last decade in every wealth quintile group, those from the poorest wealth quintiles are more likely to suffer from stunting and underweight. In NFHS-3, children from the richest households were 58 percent less likely to be stunted and 61 percent less likely to be underweight than those coming from the poorest households. However, NFHS-4 shows some narrowing of the rich-poor gap [12].
Further, it is evident from Figure 1a-1c that all the states have experienced a decline in undernourished children (stunting and underweight) from 2005 to 2016. In some states like Kerala, Goa, Tamil Nadu, Jammu & Kashmir, Manipur, Sikkim, and Andhra Pradesh, the decline in the percentage of stunted children is relatively small, although it should be noted that the percentage of stunted children was relatively low in these states in both NFHS-3 and NFHS-4 [13]. Karnataka, Rajasthan, Jharkhand and Madhya Pradesh are the states which have a large proportion of stunted children but the pace of reduction is relatively small in these states. Moreover, states like Arunachal Pradesh, West Bengal, Gujarat, Chhattisgarh, and Meghalaya have shown a moderate to large reduction in stunted children, and the share of stunted children was highest in these states. Similar to stunting, the percentage of underweight children has also declined from 2005 to 2016 in all states except Andhra Pradesh, which increased by 2 percentage points. A very sharp reduction in underweight children can be seen in Meghalaya (20 percentage points) Madhya Pradesh (17 percentage points) and Tripura (16 percentage points); however, the proportion of underweight children was higher in these states. On the contrary, states like Sikkim, Kerala, Punjab, Goa, and Tamil Nadu had a relatively low proportion of underweight children in NFHS-3 and NFHS-4 and the reduction in underweight children is also low in these states. Furthermore, the states with a high proportion of underweight children (Assam, Maharashtra, Karnataka, Rajasthan, Odisha, and Uttar Pradesh), had a lower reduction in the proportion of underweight children between 2005 and 2016 [14]. The observed patterns of decline in the proportion of stunted and underweight children do not show a similar pattern to the changes in the gross domestic products (GDP) in different states of India from 1999-2000 to 2014-15 (Figure 2). The lack of congruence in improvement in GDP of different states and the decline in stunting and underweight seems to be driven by two factors—levels of stunting and underweight in the base period of 2005-06 and skewness in the distribution of economic development benefitting only a certain section of society [15].

Figure 1: (a) Childhood stunting among children below the age of 5 years from NFHS-3 to NFHS-4. (b) Childhood wasting among children below the age of 5 years from NFHS-3 to NFHS-4. (c) Childhood Underweight among children below the age of 5 years from NFHS-3 to NFHS-4.

Figure 2: (a) Growth in GDP of India during 1980-2016. (b) Variation in GDP across different states (Source: indiastat.com).
Table 2 presents the results of logistic regression odds ratios, which determine the adjusted effects of different factors affecting stunting and underweight among children below the age of five years in India. Female children are significantly less likely to be stunted [OR=0.93, p<0.05] than male children. The study found that parental education, especially the education of the mother, has a significant negative association with the prevalence of stunting and underweight among children under the age of five years. In 2005-06, children of mothers with an educational attainment of higher secondary school and above were 44 and 37 percent less likely to be stunted and underweight in comparison with those whose mothers had no education. In the most recent cross-sectional survey in the country (the 2015-16 NFHS-4), the proportion of such children further increased to 47 percent in both stunting and underweight [16]. Thus, a significant negative association exists between mothers’ educational attainment and the prevalence of stunting and underweight among children below five years of age. Analysing the prevalence of malnutrition among children under five by urban-rural residence shows that rural children were more likely to be stunted and underweight in both the periods, but after adjusting for all the socio-economic and demographic factors, the likelihood of underweight among children under the age of five years was significantly higher in urban areas [OR=1.10, p<0.05], similar to the finding in 2005-06 [OR=1.09, p<0.05]. However, the likelihood of stunting, which was significantly higher among urban children in 2005-06 [OR=1.10, p<0.05] was insignificant in 2015-16. The prevalence of malnutrition is significantly lower among younger children, increasing with the age of the child up to three years. Children whose size at the time of birth was below average were more likely to be malnourished in terms of each of the indicators of malnutrition. The prevalence of malnutrition is significantly lower when the delivery was conducted by C-section. The adjusted prevalence of stunting and underweight [OR=0.49, p<0.05 in each case] is significantly lower among children from the richest wealth quintiles compared with children from the poorest wealth quintiles, a similar pattern to that in NFHS-3.
| Variables | Stunting | Underweight | ||||||
|---|---|---|---|---|---|---|---|---|
| NFHS-3 | NFHS-4 | NFHS-3 | NFHS-4 | |||||
| Sex of child | ||||||||
| Male | ||||||||
| Female | 0.99 | [0.94,1.05] | 0.93* | [0.87,0.99] | 1.03 | [0.97,1.09] | 0.95 | [0.89,1.01] |
| Age of child | ||||||||
| 0-5 m | ||||||||
| 6-11 m | 1.74* | [1.50,2.03] | 1.1 | [0.93,1.30] | 1.35* | [1.18,1.55] | 1.05 | [0.90,1.23] |
| 12-23 m | 5.15* | [4.51,5.87] | 3.03* | [2.62,3.51] | 1.93* | [1.71,2.18] | 1.54* | [1.35,1.77] |
| 24-35 m | 5.92* | [5.19,6.75] | 3.07* | [2.65,3.56] | 2.12* | [1.88,2.39] | 1.71* | [1.49,1.96] |
| 36 and above | 5.05* | [4.46,5.72] | 2.81* | [2.45,3.23] | 2.15* | [1.92,2.41] | 1.76* | [1.55,2.01] |
| C-Section delivery | ||||||||
| No | ||||||||
| Yes | 0.70* | [0.63,0.79] | 0.91 | [0.83,1.01] | 0.79* | [0.71,0.89] | 0.83* | [0.74,0.92] |
| Birth size of baby | ||||||||
| Average and above | ||||||||
| Below average | 1.31* | [1.23,1.41] | 1.36* | [1.24,1.49] | 1.59* | [1.49,1.71] | 1.56* | [1.43,1.71] |
| Mother's education | ||||||||
| No | ||||||||
| Primary | 0.85* | [0.78,0.93] | 0.86* | [0.78,0.95] | 0.86* | [0.79,0.94] | 0.86* | [0.78,0.96] |
| Secondary | 0.76* | [0.70,0.83] | 0.73* | [0.67,0.79] | 0.81* | [0.74,0.87] | 0.74* | [0.68,0.81] |
| Higher | 0.56* | [0.47,0.67] | 0.53* | [0.45,0.62] | 0.63* | [0.52,0.76] | 0.53* | [0.45,0.63] |
| Father's education | ||||||||
| No | ||||||||
| Primary | 0.98 | [0.90,1.08] | 0.90* | [0.80,1.00] | 1.05 | [0.96,1.15] | 0.97 | [0.87,1.08] |
| Secondary | 0.93 | [0.86,1.00] | 0.87* | [0.79,0.95] | 0.96 | [0.89,1.04] | 0.91* | [0.83,1.00] |
| Higher | 0.71* | [0.62,0.81] | 0.84* | [0.73,0.97] | 0.75* | [0.65,0.86] | 0.92 | [0.79,1.06] |
| Birth order | ||||||||
| 01-Feb | ||||||||
| 03-Apr | 1.14* | [1.06,1.23] | 1.18* | [1.09,1.27] | 1.15* | [1.06,1.24] | 1.14* | [1.05,1.23] |
| 5 or more | 1.35* | [1.21,1.51] | 1.26* | [1.12,1.42] | 1.28* | [1.15,1.43] | 1.23* | [1.09,1.39] |
| BMI of mother | ||||||||
| Underweight | ||||||||
| Normal | 0.88* | [0.83,0.93] | 0.86* | [0.80,0.93] | 0.67* | [0.63,0.71] | 0.61* | [0.57,0.66] |
| Overweight/Obese | 0.74* | [0.66,0.84] | 0.68* | [0.61,0.77] | 0.43* | [0.38,0.50] | 0.41* | [0.36,0.46] |
| Breast feeding | ||||||||
| Within 1 hour | ||||||||
| After 1 hour | 0.92* | [0.86,0.98] | 1.01 | [0.95,1.08] | 0.87* | [0.81,0.92] | 1 | [0.93,1.07] |
| Mother's age at birth of child | ||||||||
| Nov-19 | ||||||||
| 20-14 | 0.86* | [0.80,0.94] | 0.89* | [0.80,0.99] | 0.91* | [0.84,0.99] | 0.86* | [0.77,0.96] |
| 25-29 | 0.78* | [0.71,0.86] | 0.84* | [0.74,0.94] | 0.90* | [0.82,0.99] | 0.86* | [0.76,0.98] |
| 30-39 | 0.74* | [0.66,0.84] | 0.74* | [0.64,0.86] | 0.93 | [0.82,1.05] | 0.78* | [0.67,0.91] |
| Place of residence | ||||||||
| Rural | ||||||||
| Urban | 1.10* | [1.02,1.18] | 0.95 | [0.87,1.04] | 1.09* | [1.02,1.17] | 1.14* | [1.04,1.24] |
| Religion | ||||||||
| Hindu | ||||||||
| Muslim | 1.07 | [0.98,1.17] | 1.11* | [1.00,1.22] | 0.98 | [0.90,1.07] | 0.98 | [0.89,1.08] |
| Christian | 0.95 | [0.80,1.13] | 0.77* | [0.62,0.96] | 0.74* | [0.62,0.89] | 0.79 | [0.62,1.01] |
| Others | 0.91 | [0.77,1.08] | 0.98 | [0.78,1.22] | 0.73* | [0.61,0.87] | 0.93 | [0.72,1.20] |
| Caste-group | ||||||||
| Scheduled caste | ||||||||
| Scheduled tribe | 0.84* | [0.75,0.93] | 0.91 | [0.82,1.01] | 1.11* | [1.00,1.23] | 1.09 | [0.98,1.21] |
| Other backward caste | 0.87* | [0.81,0.94] | 0.85* | [0.79,0.92] | 0.90* | [0.84,0.98] | 0.96 | [0.89,1.04] |
| Others | 0.77* | [0.71,0.84] | 0.74* | [0.66,0.82] | 0.78* | [0.72,0.86] | 0.77* | [0.69,0.86] |
| Wealth Quintiles | ||||||||
| Poorest | ||||||||
| Poor | 0.86* | [0.79,0.93] | 0.89* | [0.81,0.97] | 0.83* | [0.76,0.90] | 0.85* | [0.78,0.92] |
| Middle | 0.75* | [0.69,0.82] | 0.69* | [0.62,0.76] | 0.69* | [0.63,0.75] | 0.66* | [0.60,0.73] |
| Richer | 0.63* | [0.57,0.70] | 0.57* | [0.51,0.65] | 0.59* | [0.53,0.65] | 0.60* | [0.53,0.68] |
| Richest | 0.42* | [0.37,0.48] | 0.49* | [0.42,0.57] | 0.39* | [0.35,0.45] | 0.49* | [0.42,0.57] |
Table 2: Factors affecting stunting and underweight among children below the age of 5 years in India, 2005-16.
In order to examine the magnitude of change in childhood stunting and underweight among those belonging to the five wealth quintiles, four categories of education of mothers, and two categories of place of residence over the period of 2005-06 to 2015-16, after adjusting the results for important socioeconomic and demographic characteristics, a binary logistic regression model was run after pooling datasets from the two rounds of NFHS [17]. The predicted probabilities presented in Table 3 suggest that, for children belonging to the poorest quintile, the probability of being stunted declined from 0.485 in 2005-06 to 0.464 in 2015-16, a decline of four percentage points. Over the same period, the probability of the stunted children among the richest quintile declined from 0.262 in 2005-06 to 0.241 in 2015-16. The decline in the prevalence of stunted children among the poorest and richest quintiles between 2005 and 2016 was 9 percentage points and 3 percentage points, respectively. Similarly, the predicted probabilities of being underweight among the poorest quintile declined slightly (from 0.454 to 0.445) from 2005-06 to 2015-2016, whereas among the richest quintile the probability of children being underweight remained almost the same (increasing from 0.220 to 0.225. The decline in predicted probabilities of children being underweight among the poorest and richest quintiles during the last decade was 3 percent [18].
| Wealth with time | Stunting | Underweight | ||
|---|---|---|---|---|
| predicted probability | C.I. | predicted probability | C.I. | |
| 2005-06 | ||||
| Poorest | 0.485 | (0.031,0.873) | 0.454 | (0.044,0.863) |
| Poor | 0.524 | (0.071,0.870) | 0.468 | (0.086,0.841) |
| Middle | 0.458 | (0.044,0.826) | 0.396 | (0.066,0.791) |
| Richer | 0.39 | (0.032,0.768) | 0.331 | (0.045,0.760) |
| Richest | 0.262 | (0.028,0.724) | 0.22 | (0.036,0.697) |
| 2015-2016 | ||||
| Poorest | 0.464 | (0.047,0.814) | 0.445 | (0.052,0.850) |
| Poor | 0.482 | (0.074,0.821) | 0.456 | (0.078,0.827) |
| Middle | 0.41 | (0.057,0.754) | 0.384 | (0.075,0.781) |
| Richer | 0.339 | (0.046,0.744) | 0.321 | (0.051,0.767) |
| Richest | 0.241 | (0.036,0.659) | 0.225 | (0.044,0.673) |
| Change 2005-16 | ||||
| Poorest | -0.022 | -0.009 | ||
| Poor | -0.042 | -0.012 | ||
| Middle | -0.048 | -0.012 | ||
| Richer | -0.051 | -0.01 | ||
| Richest | -0.021 | 0.006 | ||
| Education with time | ||||
| 2005-06 | ||||
| No education | 0.554 | (0.074,0.896) | 0.495 | (0.079,0.877) |
| Primary | 0.471 | (0.053,0.859) | 0.401 | (0.068,0.806) |
| Secondary | 0.372 | (0.033,0.837) | 0.307 | (0.042,0.771) |
| Higher secondary and above | 0.194 | (0.022,0.643) | 0.157 | (0.027,0.598) |
| 2015-2016 | ||||
| No education | 0.504 | (0.113,0.821) | 0.48 | (0.113,0.850) |
| Primary | 0.418 | (0.085,0.749) | 0.396 | (0.098,0.769) |
| Secondary | 0.317 | (0.053,0.750) | 0.298 | (0.060,0.755) |
| Higher secondary and above | 0.181 | (0.036,0.518) | 0.168 | (0.044,0.550) |
| Change 2005-16 | ||||
| No education | -0.05 | 0.015 | ||
| Primary | -0.053 | -0.006 | ||
| Secondary | -0.055 | -0.009 | ||
| Higher secondary and above | -0.013 | 0.011 | ||
| Residence with time | ||||
| 2005-06 | ||||
| Rural | 0.465 | (0.022,0.896) | 0.408 | (0.027,0.877) |
| Urban | 0.368 | (0.024,0.859) | 0.3 | (0.032,0.808) |
| 2015-2016 | ||||
| Rural | 0.423 | (0.040,0.821) | 0.393 | (0.044,0.850) |
| Urban | 0.305 | (0.036,0.777) | 0.303 | (0.046,0.790) |
| Change 2005-16 | ||||
| Rural | -0.022 | -0.015 | ||
| Urban | -.0.063 | 0.003 | ||
Table 3: Predicted probability of being stunted and underweight from logistic regression analysis for different categories of wealth, mother's education and place of residence in India, 2005-16.
There has been a significant decline in the estimated probability of being stunted among children of mothers with no education, from 0.554 in 2005-06 to 0.504 in 2015-16, whereas the decline among children with more highly educated mothers is 7 percent [19]. The decline in predicted probability of being stunted children among children of mothers with a primary and secondary education over the last decade is 11 and 15 percent respectively. Similarly, the predicted probability of being underweight among children of mothers with no education has declined from 0.495 to 0.480, two percentage points from 2005-06 to 2015-16 whereas the probability has increased from 0.157 to 0.168 among children of mothers with higher education.
Urban-rural place of residence provides differential opportunities for health-related quality of life. In the case of variation in the proportion of stunted and underweight children, the predicted probability of being stunted declined by 9 percent in rural areas over the last decade. Over the same period, the predicted probability of being stunted in urban areas declined from 0.368 in 2005-06 to 0.305 in 2015-16, a decline of 17 percent. Correspondingly, the decline in the predicted probability of being underweight in rural areas declined by 4 percent from 2005 to 2016 whereas there was no significant decline in the estimated probability of being underweight in urban areas.
Table 4 shows that the largest contributions to inequality in childhood stunting come from household wealth followed by parental education, particularly maternal education in both the rounds. For example, in NFHS-3, household wealth contributed to 48 percent inequality in stunting, which has been reduced to 46 percent in NFHS-4 [20]. Further, in NFHS-3 (2005-06) mother's education contributed to 11 percent of inequality in stunting among children below the age of five years, which has substantially increased (21%) in NFHS-4. Further, it is evident from Table 5 that household wealth contributes even more in NFHS-3 (50%) than NFHS-4 (47%) in the inequality in underweight. Maternal education contributes eight per cent and 23 per cent inequality in NFHS-3 and NFHS-4 respectively in underweight. Overall, the socio-economic determinants included in our model explain about 86 to 95 percent inequality in stunting and 91 to 97 per cent inequality in underweight in both rounds [21]. By inference, this means that the residuals, or inequality in stunting explained by other factors, ranges from five to 14 percent. However, inequality in underweight explained by other factors ranges from three to nine percent. Analyzing the factors contributing to the increasing socio-economic inequality in underweight among children under the age of five years showed that mothers’ education, their BMI, non- SC/ST and non OBC caste groups emerged as the most important contributors [22]. These findings clearly affirm that the rich poor gap in malnutrition among children under the age of five years, which was widening during 1992-2006 has ultimately started narrowing. This may primarily be due to increasing women's education and their nutritional awareness.
| Variables | NFHS-3 | NFHS-4 | ||||||
|---|---|---|---|---|---|---|---|---|
| Elasticity | C.I. | contribution | % contribution | Elasticity | C.I. | contribution | % contribution | |
| Birth size of the baby (below average) | 0.031 | -0.077 | -0.002 | 1.779 | 0.025 | -0.102 | -0.003 | -1.467 |
| Delivery by C-section | -0.132 | 0.108 | -0.107 | -5.106 | -0.139 | -0.033 | -0.103 | -8.44 |
| Mother’s education | ||||||||
| Primary education | -0.004 | -0.039 | 0 | -0.129 | -0.013 | -0.189 | 0.003 | -1.58 |
| Secondary education | -0.024 | 0.347 | -0.008 | 6.143 | -0.086 | 0.144 | -0.013 | 6.832 |
| Higher education | -0.009 | 0.768 | -0.007 | 5.263 | -0.04 | 0.6 | -0.024 | 14.666 |
| Father’s education | ||||||||
| Primary education | 0 | -0.193 | 0 | 0.068 | -0.006 | -0.277 | 0.002 | -0.979 |
| Secondary education | -0.024 | 0.156 | -0.004 | 2.756 | -0.05 | 0.072 | -0.004 | 2.164 |
| Higher education | -0.019 | 0.594 | -0.011 | 8.217 | -0.019 | 0.516 | -0.01 | 6.044 |
| BMI of mother | ||||||||
| Normal | -0.044 | 0.028 | -0.001 | 0.906 | -0.058 | -0.021 | 0.001 | -0.74 |
| Overweight/Obese | -0.013 | 0.56 | -0.007 | 5.395 | -0.04 | 0.384 | -0.015 | 9.287 |
| Breastfeeding after 1 hour | -0.002 | 0.132 | 0 | 0.225 | 0.016 | 0.001 | 0 | -0.007 |
| Birth order | ||||||||
| 3-4 | 0.013 | -0.098 | -0.001 | 0.936 | -0.041 | 0.012 | 0.001 | -0.757 |
| 5 or more | 0.021 | -0.352 | -0.008 | 5.61 | -0.005 | -0.344 | -0.016 | 8.575 |
| Mother's age at birth of child | ||||||||
| 20-14 | -0.035 | 0.058 | -0.002 | 1.532 | -0.017 | 0.015 | 0 | 0.126 |
| 25-29 | -0.034 | 0.045 | -0.002 | 1.132 | -0.01 | 0.051 | 0.001 | -0.36 |
| 30-49 | -0.01 | -0.186 | 0.001 | -0.814 | -0.005 | -0.166 | 0 | -2.041 |
| Urban residence | 0.017 | 0.483 | 0.008 | -6.26 | -0.003 | 0.433 | -0.001 | 5.937 |
| religion | ||||||||
| Muslim | 0.003 | -0.001 | 0 | 0.003 | 0.009 | 0.04 | 0 | -0.211 |
| Christian | -0.002 | -0.006 | 0.051 | -0.497 | 0.004 | 0.035 | -0.005 | -0.711 |
| others | -0.001 | 0.307 | 0 | 0.208 | -0.006 | 0.311 | -0.002 | 1.123 |
| caste | ||||||||
| Scheduled tribes | 0.032 | 0.045 | 0.05 | 4.931 | 0.005 | 0.089 | 0.048 | 6.096 |
| Other backward caste | -0.018 | -0.005 | 0 | -0.069 | -0.045 | 0.039 | -0.002 | 1.096 |
| Others | -0.033 | 0.265 | -0.009 | 6.422 | -0.031 | 0.268 | -0.008 | 5.085 |
| wealth | ||||||||
| Poor | -0.014 | -0.306 | 0.004 | -3.099 | -0.013 | -0.331 | 0.004 | -2.504 |
| Middle | -0.021 | 0.115 | -0.002 | 1.8 | -0.043 | 0.092 | -0.004 | 2.378 |
| Richer | -0.036 | 0.494 | -0.018 | 13.349 | -0.059 | 0.469 | -0.028 | 16.697 |
| Richest | -0.059 | 0.816 | -0.048 | 35.668 | -0.061 | 0.802 | -0.049 | 29.702 |
| Residual | -0.002 | 100% | -0.003 | 100% | ||||
| Total | -0.131 | -0.165 | ||||||
Table 4: Decomposition of Concentration Index for Stunting among children below the age of 5 years in India.
| Variables | NFHS-3 | NFHS-4 | ||||||
|---|---|---|---|---|---|---|---|---|
| Elasticity | C.I. | contribution | % contribution | Elasticity | C.I. | contribution | % contribution | |
| Birth size of the baby (below average) | 0.055 | -0.077 | -0.004 | 2.42 | 0.035 | -0.102 | -0.004 | 1.956 |
| Delivery by C- section | -0.016 | 0.208 | -0.003 | 1.911 | 0.006 | 0.067 | 0 | 0.795 |
| Mother’s education | ||||||||
| Primary education | -0.009 | -0.039 | 0 | -0.193 | -0.016 | -0.189 | 0.003 | -1.704 |
| Secondary education | -0.026 | 0.347 | -0.009 | 5.161 | -0.095 | 0.144 | -0.014 | 7.51 |
| Higher education | -0.008 | 0.768 | -0.006 | 3.524 | -0.047 | 0.6 | -0.028 | 15.339 |
| Father’s education | ||||||||
| Primary education | 0.006 | -0.193 | -0.001 | 0.681 | -0.007 | -0.277 | 0.002 | -1.043 |
| Secondary education | -0.012 | 0.156 | -0.002 | 1.099 | -0.049 | 0.072 | -0.004 | 1.924 |
| Higher education | -0.014 | 0.594 | -0.008 | 4.828 | -0.012 | 0.516 | -0.006 | 3.345 |
| BMI of mother | ||||||||
| Normal | -0.127 | 0.028 | -0.004 | 2.038 | -0.192 | -0.021 | 0.004 | -2.232 |
| Over/obese | -0.032 | 0.56 | -0.018 | 10.25 | -0.091 | 0.384 | -0.035 | 19.225 |
| Breastfeeding after 1 hour | -0.014 | 0.132 | -0.002 | 1.034 | 0.02 | 0.001 | 0 | 0.002 |
| Birth order | ||||||||
| 3-4 | 0.014 | -0.098 | -0.001 | 0.759 | 0.002 | -0.344 | -0.001 | 0.38 |
| 5 or more | 0.015 | -0.352 | -0.005 | 3.002 | 0.005 | -0.522 | -0.003 | 1.388 |
| Mother's age at birth of child | ||||||||
| 20-14 | -0.021 | 0.058 | -0.001 | 0.7 | -0.031 | 0.015 | 0 | 0.25 |
| 25-29 | -0.009 | 0.045 | 0 | 0.244 | -0.015 | 0.051 | -0.001 | 0.43 |
| 30-49 | -0.003 | -0.296 | -0.005 | -0.198 | -0.006 | -0.288 | -0.004 | -0.492 |
| Urban residence | 0.015 | 0.483 | 0.007 | -4.155 | 0.012 | 0.433 | 0.005 | -1.915 |
| Religion | ||||||||
| Muslim | -0.001 | -0.001 | 0 | 2.999 | -0.001 | 0.04 | 0 | 0.026 |
| Christian | 0 | -0.001 | 0 | 1.5 | -0.001 | 0.02 | 0 | 0.013 |
| Others | -0.005 | 0.307 | -0.002 | 0.92 | -0.004 | 0.311 | -0.001 | 1.642 |
| Caste-group | ||||||||
| Scheduled tribes | -0.009 | -0.002 | 0 | -0.026 | -0.01 | 0.013 | 0 | 0.22 |
| Other backward caste | -0.027 | -0.005 | 0.001 | -0.079 | -0.031 | 0.039 | -0.001 | 0.659 |
| Others | -0.046 | 0.265 | -0.012 | 9.915 | -0.039 | 0.268 | -0.011 | 5.758 |
| Wealth quintiles | ||||||||
| Poor | -0.023 | -0.306 | 0.007 | -4.064 | -0.032 | -0.331 | 0.011 | -5.788 |
| Middle | -0.046 | 0.115 | -0.005 | 3.016 | -0.059 | 0.092 | -0.005 | 3.005 |
| Richer | -0.059 | 0.494 | -0.029 | 16.65 | -0.069 | 0.469 | -0.032 | 17.709 |
| Richest | -0.074 | 0.816 | -0.06 | 34.515 | -0.073 | 0.802 | -0.058 | 31.97 |
| Residual | -0.002 | 100% | -0.002 | 100% | ||||
| Total | -0.174 | -0.183 | ||||||
Table 5: Decomposition of Concentration Index for underweight among children below the age of 5 years in India.
Discussion and Conclusion
Different analytical methods used in this study have been organized to answer the key questions relating to the nature and pattern of socioeconomic inequalities in undernutrition among children below age 5 in India along with its major drivers. The findings, which are based on anthropometric data on height and weight of children under age 5 from a large-scale nationally representative sample, show a substantial decline in undernutrition among children over the last decade. The age of the child, birth order, parental education, maternal nutrition, and wealth of the household were the key contributors to declining undernutrition among children under age five [23]. The prevalence of stunting and underweight among children shows a significant decline with an increasing level of mother’s education, a similar finding to that of Singh et al., in which the authors analysed the transition in malnutrition among children under age three in India using data from various cross-sectional surveys. These findings indicate that in India, where the level of female educational attainment still lags behind the level of male educational attainment, maternal, infant, and young child nutrition (MIYCN) counselling should be an integral part of maternal and child health care services, as well as any nutrition-specific intervention, so that even women with lower levels of education may have intensified counselling on ways of maintaining their nutritional status, especially during pregnancy and lactation.
Further, it is evident from the findings of both rounds of NFHS (2005-06 and 2015-16) that higher birth-order children were more prone to being stunted and underweight, a similar finding to Horten, who found that birth order was strongly associated with stunting and had less effect on wasting in the Philippines. Similar findings were also reported in studies in other developing countries including India, showing that birth order is an important predictor of child malnutrition [24]. Many scholars have tried to establish the pathways of how the birth order of children affects their nutritional status. One of the most prominent intervening variables that emerged from the studies is the maternal nutrition. In fact, the nutritional status of children is strongly associated with the mother’s nutrition, since children of mothers with low BMI were more likely to be malnourished. Energy deficiency among mothers adversely affects the nutritional status of children, which in turn affects their cognitive development, educational attainment, morbidity, and health related quality of life. It is expected that during pregnancy women should have four or more antenatal care (ANC) visits and should take 100 or more iron and folic acid (IFA) tablets or an equivalent dose of syrup, which are essential for both the mother and child [25]. However, in most of the EAG states in India the proportion of women going for four or more ANC visits during the last pregnancy was much lower than the national average of 51 percent. Under the circumstances, maternal nutrition needs to be strengthened, which may be achieved by improving supplementary nutritional support during pregnancy and lactation through the Integrated Child Development Services (ICDS) programme, health and nutrition counselling inclusive of IFA supplementation, and maternity protection through effective implementation of Pradhan Mantri Matritya Vikash Yojna (PMMVY).
Findings show that children belonging to the highest wealth quintile are less likely to suffer from stunting and underweight. Of course, there is no uniform pattern in the prevalence of stunting and underweight in different wealth quintiles, but the results show that children from the highest wealth quintile are in a better position than those in the lowest wealth quintile. These findings are similar to those observed in many other studies, where economic status was highlighted to be the most important factor that affects stunting among children. In another study, Sakka and Osman established a link between household wealth status and nutritional status by linking it with improved dietary diversity and food availability [26]. They found that children belonging to the higher socio-economic households were more likely to get diverse food and easy food access, which positively affected their nutritional status. However, the pattern of variation in malnutrition among children under the age of five years across different states of India over the last decade presents two contrasting patterns across EAG and non-EAG states. The findings indicate a high degree of childhood malnutrition in EAG states, with a relatively larger proportion of households below the poverty line and a slower pace of improvement in maternal and child health indicators. The level of stunting among children under the age of five was substantially higher (44-50%) in four major EAG states, namely Bihar, Uttar Pradesh, Madhya Pradesh, and Jharkhand, and in Meghalaya (Figure 1a). The pattern remains by and large the same even in the case of the prevalence of underweight among children below the age of five years (Figure 1c). It is evident from the results of multivariate analysis that children from the poorest and poor strata were more prone to stunting, as well as underweight, which signifies that poverty is a strong determinant of malnutrition among children. The predicted probability of being stunted has declined almost by the same magnitude among children coming from the richest and the poorest households. However, there is a lack of congruence between economic development and the reduction in undernutrition among children in India. Despite the rapid growth in the Gross Domestic Product (GDP) of more than 7 percent as against the average growth rate of 3.4 percent for the rest of the world over the same time span, the pattern of microeconomic development is not uniform across states, and hence, the improvement in GDP has not been translated into substantial progress in nutrition. As in most of the states, particularly the EAG states, the level of malnutrition is high and has not experienced a remarkable decline over the period (Figure 1), which may result in relatively higher levels of infant and child mortality in the years to come. These findings justify the argument that macroeconomic growth is a major policy instrument for improving health and nutrition in developing countries.
In India, childhood undernutrition is positively linked with the age of children. Children age three and more years are more likely to suffer from stunting than children less than six months-old (5.1 times in 2005-06 and 2.8 times in 2015-16). The pattern remains the same even in the case of the prevalence of underweight. These findings are similar to the findings of other studies conducted in heterogeneous environments in Kenya, Brazil, and Ethiopia. Therefore, all nutrition interventions should prioritize IYCF indicators in terms of both dietary diversity and food frequency, in addition to the community nutrition requiring multisectoral approaches. World Health Organization findings have also highlighted that more than half of the malnutrition among children under age five is among children who are 12 or more months old. This is associated with repeated diarrhoea or intestinal worm infections as a result of unsafe water and lack of hygienic practices. Therefore, any nutrition intervention may not be optimally effective unless it is aligned with universal access to safe drinking water, sanitation, and hygiene with a defecation free environment.
Decoding the factors that play a pivotal role in increasing socioeconomic inequality in underweight among children under age five shows that household wealth, mother's education, their BMI, and a nutritionally secure environment, especially reaching the most nutritionally vulnerable community/groups such as SC/ST and minorities, are the most important contributors. These findings clearly affirm that there has been an effective decline in inequality in stunting and underweight among the poorest children in the country and also among children of mothers with no education, which may be largely due to government’s efforts to address infant and young child care and nutrition including ensuring food security. Regardless of the number of programmes and interventions available in recent years, the lack of focus on MIYCN counselling, newborn care, the Baby Friendly Hospital Initiative, and child feeding practices still result in very high childhood malnutrition in most of the EAG states.
Recommendations
Improvements in the nutritional status of children require a focused intervention on maternal nutrition as a strategy to minimize undernutrition among their children by promoting appropriate child feeding practices. This may be done by identifying potential opportunities for enhancing efficacy of child health programmes with a continuum in services ensuring exclusive breastfeeding, supplementary feeding and growth monitoring, and on adopting differential intervention approaches in community nutrition in EAG and other states.
Limitations
The study used a number of factors with direct and indirect effects on malnutrition among children in India and estimated the contribution of a number of biosocial factors. However, this study did not consider a number of unobserved confounders, including medical factors, which were not investigated as part of the survey.
Author’s Contribution
SKS conceived the idea and designed the experiment. SKS and SS analysed the data, interpreted the results, and drafted the manuscript. Both authors reviewed the manuscript and approved the final manuscript for submission for publication.
Conflicts of Interest
The authors do not have any conflict of interest to declare.
Funding
This research received no specific grant from any funding agency, commercial entity or not-for-profit organization.
Acknowledgement
Authors are happy to acknowledge the contribution of Dr. Ankita Siddhanta in effectively executing the copyediting scrubs in the manuscript as per suggestions of anonymous reviewer. We are also thankful to the reviewer for the valuable comments, which has further strengthened quality of the manuscript.
References
- Bhutta ZA, Das JK, Rizvi A, Gaffey MF, Walker N (2013) Evidence-based interventions for improvement of maternal and child nutrition: what can be done and at what cost? The lancet 382: 452-477.
- ECLAC, UNICEF, UNICEF TACRO (2006) Challenges: Child malnutrition in Latin America and the Caribbean. Teleton Santiago.
- Genebo T, Girma W, Haider J, Demissie T (1999) The association of children's nutritional status to maternal education in Zigbaboto, Guragie Zone, Ethiopia. Ethiop J Health Dev 13: 55-61.
- Hong R, Mishra V (2006) Effect of wealth inequality on chronic under-nutrition in Cambodian children. J Health Popul Nutr 24: 89-99.
- IIPS, ORCM (2016) National Family Health Survey 4 (NFHS4) 2015-16. Mumbai: International Institute for Population Sciences.
- Kandala NB, Madungu TP, Emina JB, Nzita KP, Cappuccio FP (2011) Malnutrition among children under the age of five in the Democratic Republic of Congo (DRC): does geographic location matter? BMC public health, 11: 261.
- Kanjilal B, Mazumdar PG, Mukherjee M, Rahman MH (2010) Nutritional status of children in India: household socio-economic condition as the contextual determinant. Int J Equity Health 9: 19.
- Kawachi I, Berkman L (2000) Social cohesion, social capital, and health. Social Epidemiology 4: 174-190.
- Larrea C, Kawachi I (2005) Does economic inequality affect child malnutrition? The case of Ecuador. Social Science & Medicine 60: 165-178.
- Marston C, Cleland J (2003) Do unintended pregnancies carried to term lead to adverse outcomes for mother and child? An assessment in five developing countries. Population studies 57: 77-93.
- Mwaniki EW, Makokha AN (2013) Nutrition status and associated factors among children in public primary schools in Dagoretti, Nairobi, Kenya. African health sciences 13: 38-46.
- Novignon J, Aboagye E, Agyemang OS, Aryeetey G (2015) Socioeconomic-related inequalities in child malnutrition: evidence from the Ghana multiple indicator cluster survey. Health Econ Rev 5: 34.
- Parraga I (2006) Growth deficits in school age children in Brazil. American Journal of Clinical Nutrition 50: 687-696.
- Pelletier DL, Frongillo EA Jr, Schroeder DG, Habicht JP (1995) The effects of malnutrition on child mortality in developing countries. Bull World Health Organ 73: 443-448.
- Popkin BM, Horton S, Kim S, Mahal A, Shuigao J (2011) Trends in Diet, Nutritional Status, and Diet-related Noncommunicable Diseases in China and India: The Economic Costs of the Nutrition Transition. Nutr Rev 59: 379–390.
- Preston SH (1975) The changing relation between mortality and level of economic development. Population studies 29: 231-248.
- Pritchett L (1997) Divergence, big time. The Journal of Economic Perspectives 11: 3-17.
- Shekar M, Heaver R, Lee YK (2006) Repositioning nutrition as central to development: A strategy for large scale action. World Bank Publications.
- Saaka M, Osman SM (2013) Does household food insecurity affect the nutritional status of preschool children aged 6–36 Months? International Journal of Population Research 2013: 304169.
- Shapiro-Mendoza C, Selwyn BJ, Smith DP, Sanderson M (2005) Parental pregnancy intention and early childhood stunting: findings from Bolivia. International journal of epidemiology 34: 387-396.
- Sommerfelt AE, KStewart M (1994) Children’s nutritional status. Demographic and Health surveys comparative studies No. 12. Calverton, MD: Macro International. Inc., Zimbabwe.
- Singh SK, Maharana GB, Srivastava S (2017) Transition in Childhood Malnutrition in India: Evidence from Various Cross-sectional Surveys conducted during 1998 to 2013. Adv Nutr Food Sci 2: 1-13.
- Ukwuani FA, Suchindran CM (2003) Implications of women's work for child nutritional status in sub-Saharan Africa: a case study of Nigeria. Soc Sci Med 56: 2109-2121.
- United Nations Children’s Fund, World Health Organization, The World Bank (2012) Levels and trends in child malnutrition. UNICEF-WHO-The World Bank joint child malnutrition estimates. UNICEF, New York; WHO, Geneva; The World Bank, Washington, DC.
- Van de Poel E, Hosseinpoor AR, Jehu-Appiah C, Vega J, Speybroeck N (2007) Malnutrition and the disproportional burden on the poor: the case of Ghana. International Journal for Equity in Health 6: 21.
- Yimer G (2000) Malnutrition among children in Southern Ethiopia: Levels and risk factors. Ethiopian Journal of Health Development 14: 283-292.
Citation: Singh SK, Srivastava S (2019) Decoding Factors Contributing to Socio-Economic Inequalities in Malnutrition among Children in India. Epidemiology (Sunnyvale) 9: 366. DOI: 10.4172/2161-1165.1000366
Copyright: © 2019 Singh SS, et al. This is an open-access article distributed under the terms of the Creative Commons Attribution License, which permits unrestricted use, distribution, and reproduction in any medium, provided the original author and source are credited.
Share This Article
Recommended Journals
Open Access Journals
Article Tools
Article Usage
- Total views: 5024
- [From(publication date): 0-2019 - Apr 02, 2025]
- Breakdown by view type
- HTML page views: 4133
- PDF downloads: 891