Research Article Open Access
Deciphering Groundwater Quality for Drinking and Irrigation Purposes ��? A Study in Lefunga Block of West Tripura District, Tripura, India
Rajib Paul1, Shreya Das2, S.K.Nag2* and M.K.Singh11Department of Chemistry, Tripura University, Suryamaninagar-799022,Tripura, India
2Department of Geological Sciences, Jadavpur University, Kolkata-700032, India
- *Corresponding Author:
- S.K.Nag
Department of Geological Sciences
Jadavpur University, Kolkata-700032, India
Tel: 03324572227
E-mail: sisirknag@gmail.com
Received date: November 29, 2016; Accepted date: December 23, 2016; Published date: December 31, 2016
Citation: Paul R, Das S, Nag SK, Singh MK (2016) Deciphering Groundwater Quality for Drinking and Irrigation Purposes – A Study in Lefunga Block of West Tripura District, Tripura, India. J Earth Sci Clim Change 7: 378. doi: 10.4172/2157-7617.1000378
Copyright: © 2016 Paul R, et al. This is an open-access article distributed under the terms of the Creative Commons Attribution License, which permits unrestricted use, distribution, and reproduction in any medium, provided the original author and source are credited.
Visit for more related articles at Journal of Earth Science & Climatic Change
Abstract
The aim of the present study is to assess the groundwater quality of Lefunga block, west Tripura district, Tripura, for irrigation and domestic purposes. Nine samples were collected from bore wells used for drinking and irrigation purposes. The water samples were analyzed for major cations like calcium, magnesium, sodium, potassium, iron and anions like chloride, bi-carbonate and sulfate. Samples were also analyzed for arsenic and fluoride concentration. The important constituents that influences water quality for irrigation such as Electrical conductivity (EC), Total Dissolved Solids (TDS), Sodium Adsorption Ratio (SAR), Magnesium Adsorption Ratio (MAR), Soluble Sodium Percentage (SSP) and Permeability Index (PI) were determined and compared with standard limits. The values of TDS range from 29.33 – 86.00 mg/L, SAR values range from 0.04 – 0.07, MAR values range from 33.56 – 53.68 and SSP range from 3.01 – 5.87. Results show that they all lie within the safe limits and thus largely suitable for irrigation purpose. Hence, the groundwater of this area is free from salinity hazard and has no adverse effect on soil properties. Furthermore, the water samples also fall within recommended limits and are found suitable for drinking purposes except one sample having high levels of iron and thus rendering it to be very poor for drinking purposes as per WQI classification.
Keywords
Bicarbonate; Electrical; Fluoride; Geology; Irrigation; Sandstone; Temperature; Water
Introduction
The present study focuses on irrigational and drinking water suitability of Lefunga block of West Tripura district in Tripura. Groundwater quality monitoring is especially important in areas where a sizeable chunk of the population depends on it for regular usage. Groundwater scarcity is a current crisis globally and in our country as well. The utilization of water from ages has led to its over exploitation coupled with the growing population along with improved standard of living because of technological innovations [1,2]. Thus, contamination of groundwater is not away from the evils of modernization. Besides anthropogenic factors, groundwater quality gets affected due natural geological and chemical processes. The quantity and composition of dissolved minerals in natural water depend upon the type of rock or soil with which it has been in contact or through which it has passed and the duration it has been in contact with these rocks [3-6].
In developing countries, 80% of diseases are directly related to poor drinking water and unsanitary conditions [7]. Groundwater quality studies provide a better understanding of possible changes in quality as development progress. Suitability of groundwater for domestic and irrigation purposes is determined by its hydrochemistry. Groundwater quality data gives important clues to the geologic history of rocks and indications of groundwater recharge, movement, and storage [8]. Groundwater quality depends on number of factors, such as general geology, degree of chemical weathering of prevailing lithology, quality of recharge water and inputs from sources other than water-rock interaction. Demarcation of groundwater zones on the basis of quality was attempted [9-18].
Quality of groundwater may vary from place to place and from stratum to stratum. It also varies from season to season. The requirement of quality of water for various purposes such as drinking water, industrial water and irrigation water vary widely. Thus a compact study has been carried out in the present study area to form a better understanding regarding the irrigational and drinking water quality.
Study Area
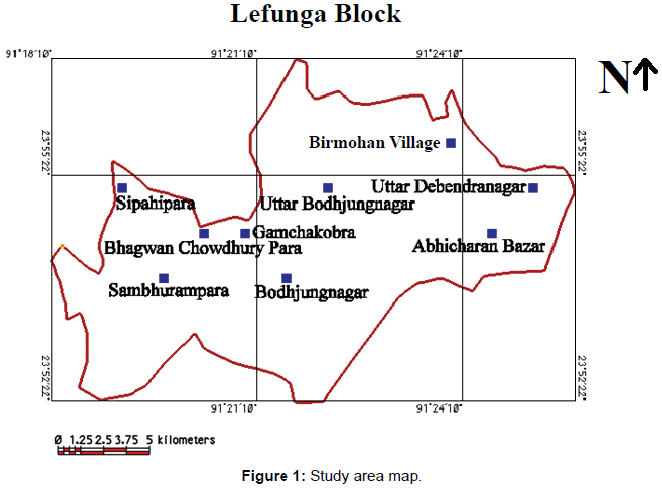
The present study area, Lefunga block, lies in West Tripura district, Tripura, India. The block lies between 23�?52�?22�?�?N - 23�?56�?55�?�?N and 91�?18�? 10�?�? E - 91�?25�? 49�?�?E. The Lefunga block (Study area) is composed of Recent Formation (alluvium), Dupitila Series and Tipam Group.
Alluvium deposits of recent or sub recent rivers comprising silica Ghilatoli formation sand, silt and clay and vegetation debris unconsolidated, pale yellow to dirty sand, silt clay with organic Formation and decomposed vegetable matter; massive, coarse grained, gritty poorly cemented sandstone with current bedding.
Tipam Group conformably overlies Surma Group and the gradational contact is marked by a ribbed sandstone unit with minor thin siltstone bands. The transitional Bokabil-Tipam boundary often poses problem for its demarcation. It is observed that sandstone unit towards the top of Bokabil Formation commonly shows a ribbing pattern. The occurrence of ‘ribbed sandstone unit’ could define changes in depositional parameters and thereby the base of Tipam Group. Mapping by Nandy and in parts of the state showed that Tipam Group can be broadly divided into two formations [19]. (a) Lower Tipam Formation: (studied at Manzu Bazar) consisting of fairly thick unit of fine to medium grained sandstone, subarkosic sandstone, including laminated layers of thick lenticular bands of sandy shale, siltstone and sandy mudstone of brackish to fresh water shallow marine facies. The sandstone unit is medium grained, current bedded having a distinct ribbed pattern, contains boulders of calcareous concretions and coal streaks. The concretions are rounded, spheroidal and oval shaped varying from 10 cm to 30 cm in diameter. The outer surface of boulders has ferruginous coating but the inner portion is hard and calcareous. Reworked siltstones are closely associated with the lower part of Tipam Group.
Dupitila formation overlies Tipam Group with an angular unconformity. The contact is marked by a thin band of pebbleconglomerate. It comprises white to yellowish, loose, unconsolidated ferruginous sandstone with pink and yellow clay bands. The coarse grained sandstone contains fragments of quartz, quartzite, muscovite, biotite and feldspar with profuse lithic fragments. Bedding is indistinct due to massive and unconsolidated nature of sand rock. There are pockets of well-sorted, medium to coarse grained quartz and white clay. Sandstone, from which ferruginous material has been leached away, has formed sand pockets. Few discontinuous horizons of iron-coated clay pebbles and angular class of sandstone occur in ferruginous sand matrix within sandstone. Thin lateritic soil capping has been recorded on the top of several mounds composed of the sandstone (Figure 1).
Methodology
Groundwater samples have been collected from nine locations spanning over the Lefunga block during March – May, 2016 (pre monsoon period). Quantitative chemical analyses treatments have been performed on the water samples to determine the concentration of the major cations and anions present in groundwater. All chemical analyses were performed using standard quantitative analysis procedures in accordance with [20]. The parameters measured were pH, electrical conductivity (EC), total dissolved solids (TDS) were measured in situ using the potable HI 98130 Combo pH/ EC/ TDS/ Temperature meter by Hanna Instruments. Sodium (Na), potassium (K) were measured using flame photometry, calcium (Ca) and magnesium (Mg) were measured complex-metrically, chloride (Cl¯) was measured following argent-metric analysis, sulphate (SO42¯) and iron (Fe) was measured sphectophotometrically, bicarbonate (HCO3¯) was measured following titrimetric principles, fluoride (F¯) was measured using the Ion selective electrode, and arsenic (As) was detected using atomic absorption spectrophotometer. The quantitative analysis results have been presented in Table 1. All ionic concentrations have been measured in mg/l. For determination of irrigational and drinking water quality certain water quality indices were calculated for each location, the values and plots of which have been presented in results and discussions.
| L. No. | Location Name | pH | EC | TDS | Ca | Mg | Cl- | SO42- | HCO3- | F- | Na+ | K+ | Fe | As |
|---|---|---|---|---|---|---|---|---|---|---|---|---|---|---|
| L1 | Uttar Bodhjungnagar | 4.79 | 59.43 | 70.0 | 11.78 | 3.57 | 18.86 | 3.02 | 19.14 | 0.11 | 0.84 | 0.11 | 0.19 | BDL |
| L2 | Abhicharan Bazar | 5.23 | 121.2 | 86.0 | 9.82 | 5.95 | 16.5 | 15.4 | 45.5 | 0.43 | 0.85 | 0.28 | 3.06 | 0.01 |
| L3 | Birmohan Village | 5.10 | 147.29 | 44.67 | 7.85 | 3.97 | 18.87 | 2.18 | 23.92 | - | 0.52 | 0.07 | 0.12 | BDL |
| L4 | Uttar Debendranagar | 4.36 | 157.01 | 78.0 | 10.47 | 3.97 | 18.87 | 2.97 | 36.67 | 0.31 | 1.02 | 0.35 | 0.57 | BDL |
| L5 | Bodhjungnagar | 4.60 | 66.86 | 54.0 | 9.16 | 6.37 | 23.57 | 2.37 | 22.32 | 0.18 | 0.67 | 0.16 | 0.52 | 0.013 |
| L6 | Gamchakobra | 5.01 | 36.52 | 29.33 | 10.47 | 5.55 | 18.86 | 2.66 | 52.62 | 0.17 | 0.78 | 0.19 | 0.11 | BDL |
| L7 | Bhagawan Chowdhury Para | 4.59 | 35.9 | 34.67 | 7.85 | 3.97 | 18.86 | 2.75 | 20.73 | 0.11 | 0.49 | 0.12 | 0.16 | BDL |
| L8 | Sambhurampara | 4.84 | 124.4 | 30.67 | 9.16 | 3.97 | 18.86 | 3.02 | 20.73 | 0.11 | 0.99 | 0.24 | 0.69 | BDL |
| L9 | Sipahipara | 4.79 | 51.3 | 42.0 | 10.47 | 6.34 | 22 | 2.86 | 35.08 | 0.14 | 0.684 | 0.115 | 0.08 | BDL |
Table 1: Quantitative chemical analysis results.
Results and Discussion
For determination of irrigational water suitability three geochemical indices – Sodium adsorption ratio, soluble sodium percentage and magnesium adsorption ratio were calculated for each water sample and the respective plots were drawn to interpret the quality of water. To determine drinking water suitability, Water quality index – where relative weights are assigned to each parameter in accordance with their potential to render water suitable or unsuitable for drinking, has been calculated for each water sample [21].
Sodium adsorption ratio (SAR)
Total salt concentration and probable sodium hazard of the irrigation water are the two major constituents for determining SAR. If water used for irrigation is high in Na+ and low in Ca2+ the ion-exchange complex may become saturated with Na+ which destroys the soil structure, due to the dispersion of clay particles and reduces the plant growth. Excess salinity reduces the osmotic activity of plants [22,23]. Sodium percentage exceeding 50% was taken as a warning of sodium hazard. However, in 1954, it was proposed that the sodium percentage is to be replaced by a significant ratio termed the Sodium Adsorption Ratio or SAR because it has a direct relation with the adsorption of sodium by soils [24]. This ratio is calculated from the following formula:
SAR = [Na+]/ {([Ca2+] + [Mg2+])/ 2}1/2....... (1)
Where, concentrations of the ions are expressed in meq/L.
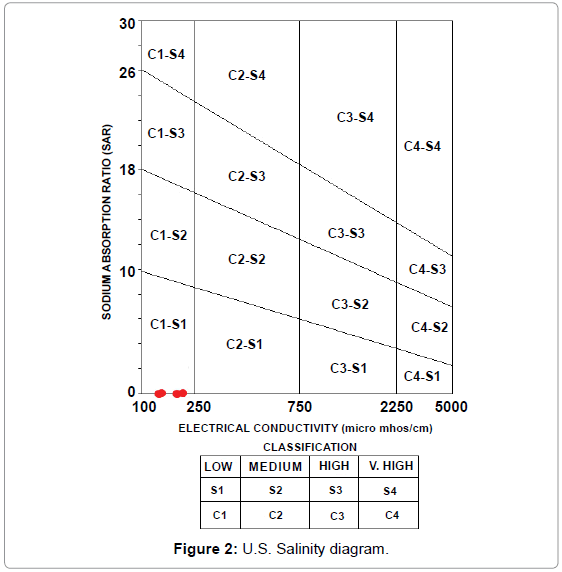
Thus the concentration of sodium, magnesium and calcium ions determination is of great importance for assessing the suitability of water for irrigation purposes. This method is widely used now-a-days for specifying the suitability of irrigation waters. In this method, the electrical conductivity and SAR value for the water are first evaluated and thereafter its position is located on the standard U.S. Salinity diagram. The diagram gives direct indication of the salinity and alkalinity hazards. According to this diagram, the irrigation waters have been classified into 16 different groups, each having specific properties.
When plotted on the U.S. Salinity diagram each point gives the classification of the water sample based on two classifications:
• The salinity hazard is represented by C1, C2, C3, C4 classes along the X axis along which electrical conductivity is plotted.
• The exchangeable sodium accumulation in soil is represented by S1, S2, S3, S4 classes along the Y axis along which the SAR values are plotted.
According to the calculations and plot (Figure 2), all water samples of the present study are suitable for irrigation w.r.t SAR values and fall within the C1-S1 class. All SAR values have been presented in Table 2.
| Location No. | Location Name | SAR | SSP | MAR | P.I. |
|---|---|---|---|---|---|
| L1 | Uttar Bodhjungnagar | 0.05 | 4.25 | 33.56 | 60.72 |
| L2 | Abhicharan Bazar | 0.05 | 4.28 | 50.24 | 84.40 |
| L3 | Birmohan Village | 0.04 | 3.26 | 45.74 | 83.97 |
| L4 | Uttar Debendranagar | 0.07 | 5.87 | 38.72 | 86.32 |
| L5 | Bodhjungnagar | 0.04 | 3.25 | 53.68 | 59.45 |
| L6 | Gamchakobra | 0.05 | 3.78 | 46.91 | 91.10 |
| L7 | Bhagawan Chowdhury Para | 0.04 | 3.26 | 45.74 | 78.31 |
| L8 | Sambhurampara | 0.07 | 5.87 | 41.94 | 70.12 |
| L9 | Sipahipara | 0.04 | 3.01 | 50.23 | 70.14 |
Table 2: Calculated water quality indices.
Soluble sodium percentage (SSP)
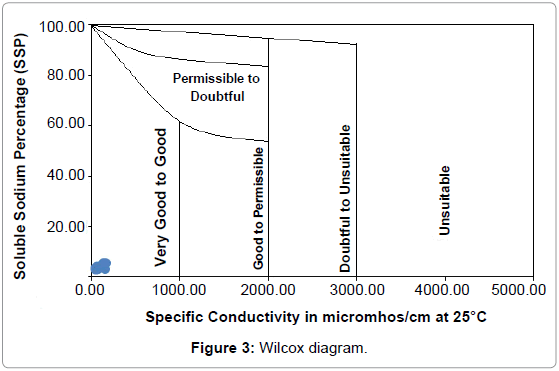
EC and sodium concentration are very important in classifying irrigation water. The salts, besides affecting the growth of the plants directly, also affect soil structure, permeability and aeration, which indirectly affect plant growth [25]. Soluble Sodium Percentage (SSP) Todd was calculated by the following equation [22]:
SSP= [(Na +K)/ (Ca + Mg + Na + K)] xl00....... (2)
Where, all the ionic concentrations are expressed in meq/L.
The SSP values have been presented in Table 2. According to the Wilcox diagram plot (Figure 3), all samples fall in the Very good – Good range [26].
Magnesium adsorption ratio (MAR)
Generally Ca2+ and Mg2+ maintain a state of equilibrium in most groundwater. During equilibrium more Mg2+ in groundwater will adversely affect the soil quality rendering it alkaline resulting in decrease of crop yield Kumar and Paliwal had developed the following equation for calculating the magnesium hazard (MAR) [27,28]:
MAR = (Mg2+ * 100)/ (Ca2+ + Mg2+)......... (3)
Where, all the ionic concentrations are expressed in meq/L.
MAR categorizes groundwater into two broad classes; water having MAR < 50 is considered suitable for irrigation whereas those having MAR > 50 are considered unsuitable. According to calculations MAR values are marginally above 50 at three locations - Abhicharan bazaar, Bodhjungnagar and Sipahipara. Rest of the locations have suitable values. All MAR values have been presented in Table 2.
Permeability index (P.I.)
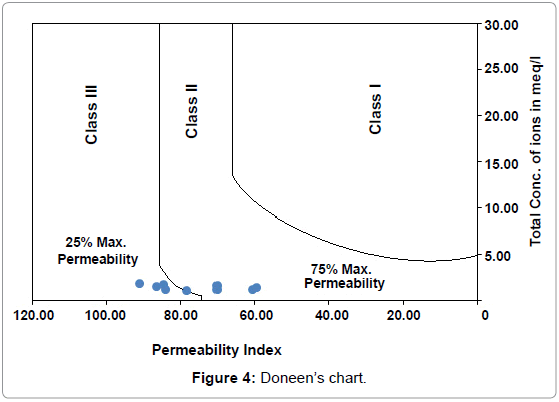
The permeability of soil is affected by long-term use of irrigation water and is influenced by sodium, calcium, magnesium and bicarbonate contents in soil. Another modified criterion has evolved based on the solubility of salts and the reaction occurring in the soil solution from cation exchange for estimating the quality of agricultural waters [29]. Soil permeability is affected by long-term use of irrigation water and is influenced by - (i) Total dissolved solids, (ii) sodium contents and (iii) bicarbonate content. To incorporate the first three items [30]. has empirically developed a term called, 'Permeability Index' after conducting a series of experiments for which he has used a large number of irrigation waters varying in ionic relationships and concentration. The following formula gives the permeability index:
PI = Na+ + [{(HCO3¯) ½/ (Ca2++Mg2++Na+)}*100] ............ (4)
Where, the ions are expressed in meq/L.
On plotting the P.I. values on Doneen’s chart (Figure 4), it can be seen four locations fall in Class II and four locations fall in Class III. One location falls in the borderline range. The permeability index values have been presented in Table 2.
Water quality index (WQI)
This study has been carried out in three major steps:
In the first step the measured physico-chemical parameters have been assigned weights in accordance with their relative importance in controlling drinking water quality.
In the second step a relative weight is calculated using the following equation:
Wi = wi/ Σwi........... (5)
Where wi is the weight assigned to each parameter and Σwi is summation of all the weights assigned to each parameter.
In the third step a quality rating (qi) is assigned for each parameter using the following equation:
qi = (Ci X Si)/ 100.......... (6)
Where, Ci is the concentration of each chemical parameter in each water sample in mg/L, and Si is the Indian drinking water standard for each chemical parameter in mg/L according to the guidelines of WHO.
Using the relative weight and quality rating scale values SI for each parameter is calculated.
Water quality Index or WQI is then calculated using the equation below:
SIi = Wi ��? qi.............. (7)
WQI = ΣSIi............. (8)
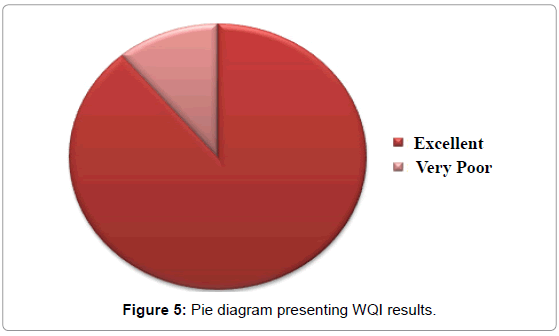
The weights assigned to each parameter and all relevant calculations have been presented in Table 3, Water Quality Index values have been presented in Table 4 and Water Quality Index classification has been presented in Table 5. The results obtained have been plotted in form of a pie chart in Figure 5. Arsenic is found to be below detectable limits at most locations and no particular WHO standard is available for potassium. Hence these two parameters have been left out from WQI calculations. According to the results, only the water sample collected from Abhicharan bazaar has been found to be unsuitable for drinking; most probably due to its high iron content.
| Parameter | WHO Standard | Weight (wi) | Relative Weight (Wi) |
|---|---|---|---|
| pH | 6.5 | 5 | 0.128205128 |
| EC | 2250 | 2 | 0.051282051 |
| TDS | 1000 | 4 | 0.102564103 |
| Ca | 200 | 2 | 0.051282051 |
| Mg | 100 | 2 | 0.051282051 |
| Cl- | 1000 | 3 | 0.076923077 |
| SO4-2 | 400 | 5 | 0.128205128 |
| HCO3- | 732 | 3 | 0.076923077 |
| F- | 1.5 | 5 | 0.128205128 |
| Na+ | 200 | 3 | 0.076923077 |
| Fe | 0.3 | 5 | 0.128205128 |
Table 3: Relative weight of measured parameters.
| Location Name | WQI |
|---|---|
| Uttar Bodhjungnagar | 13.09953 |
| Abhicharan Bazar | 209.2634 |
| Birmohan Village | 8.311796 |
| Uttar Debendranagar | 39.07922 |
| Bodhjungnagar | 35.65273 |
| Gamchakobra | 7.641207 |
| Bhagawan Chowdhury Para | 11.04098 |
| Sambhurampara | 47.26482 |
| Sipahipara | 5.587693 |
Table 4: Water quality index values.
| WQI Value | Water Quality | Percentage of Samples |
|---|---|---|
| <50 | Excellent | 88.88 |
| 50-100 | Good | 0 |
| 100-200 | Poor | 0 |
| 200-300 | Very Poor | 11.11 |
| >300 | Unsuitable | 0 |
Table 5: WQI classification and results.
Conclusion
The objective of the present study was to identify and interpret the irrigational and drinking water suitability of the nine water samples collected from different spots in Lefunga block, west Tripura district, Tripura. According to the analyses performed the, the quantitative chemical analysis results have shown that in all samples, barring one, the basic major cationic and anionic concentrations are well within the WHO standards. Thus, the geochemical water quality index studies carried out to interpret water suitability show that all samples are suitable for irrigation. In terms of drinking water quality, only one sample containing high levels of iron have been rendered very poor for drinking as per WQI classifications.
Acknowledgments
The authors (S. Das and S.K. Nag) gratefully acknowledge the infrastructural support for providing the use of Remote Sensing and GIS softwares (TNT Mips) by the Department of Geological Sciences, Jadavpur University, Kolkata. The authors (R. Paul and M.K. Singh) are thankful to the Head, Department of Chemistry for providing infrastructural facilities for carrying out the research work. Authors also acknowledge the help received from the Chairman, Tripura State Pollution Control Board, Government of Tripura for extending laboratory facilities for analytical works.
References
- Todd DK (1995) Groundwater development in an arid environment. pp: 1429-1449.
- Raj I (2000) Issues and objectives in groundwater quality monitoring programme under hydrology project.
- Domenico PA (1972) Concepts and models in groundwater hydrology. New York.
- Freeze RA, Cherry JA (1979) Groundwater. Englewood Cliffs: Prentice-Hall.
- Hussein M (2004) Hydrochemical evaluation of groundwater in the Blue Nile Basin, eastern Sudan, using conventional and multivariate techniques. Hydrogeol J 12:144-158.
- Schuh WM, Klinekebiel DL, Gardner JC, Meyar RF (1997) Tracer and nitrate movements to groundwater in the norruem great plains. J of Env Qual 26: 1335-1347.
- UNESCO (2007) Water portal newsletter, water related diseases.
- Walton WC (1970) Groundwater resource evaluation, McGraw-Hill.
- Subba Rao N, Prakasa Rao J, John DD, Srinivasa Rao KV (2002) Hydrogeochemistry and groundwater quality in a developing urban environment of a semi-arid region, Guntur Andhra Pradesh. J Geol Soc Ind 59: 159-166.
- Stites W, Kraft GJ (2001) Nitrate and chloride loading to groundwater from an irrigated North-Central U.S. Sand-plain vegetable field. J Environ Qual 30: 1176-1184.
- Ahmed SS, Mazumder H, Jahan CS, Ahmed M, Islam S (2002) Hydrochemistry and classification of groundwater, rajshahi city corporation area, Bangladesh. J Geol Soc Ind 60: 411-418.
- Bathrellos GD, Skilodimou HD, Kelepertsis A, Alexakis D, Chrisanthaki I, et al. (2008) Environmental research of groundwater in the urban and suburban areas of Attica region, Greece. Environ Geol 56: 11-18.
- Ramesh K, Elango L (2005) Groundwater quality assessment in Tondiar basin. Indian J Env pro 26: 497-504.
- Brindha K, Elango L (2010) Study on bromide in groundwater in parts of Nalgonda district, Andhra Pradesh, India. Earth science India 3: 73-80.
- Brindha K, Elango L (2011) Hydrochemical characteristics of groundwater for domestic and irrigation purposes in Madhuranthakam, Tamil Nadu, India. Earth Sci Res J 15: 101-108.
- Nag SK, Ghosh P (2013) Variation in groundwater levels 520 and water quality in chhatna block, bankura district, West Bengal - A GIS Approach. J Geol Soc India 81: 261-280.
- Nag SK (2014) Evaluation of hydrochemical parameters and quality assessment of the groundwater in Gangajalghati Block, Bankura District, West Bengal, India. Arab J Sci Eng 39: 5715-5727.
- Das S, Nag SK (2015) Deciphering groundwater quality for irrigation and domestic purposes – A case study in suri I and II blocks, Birbhum district, West Bengal, India. J Earth Sys Sci 124: 965-992.
- Nandy DR, Das GS, Sarkar S, Ganguly A (1983) Tectonic evolution of Tripura Mizoram fold belt, Surma basin, Northeast India. Q J Geol Min Metal Soc India 55: 186-194.
- APHA (American Public Health Association) (1995) Standard methods for examination of water and waste water. American water works association and water pollution control federation, Washington DC, USA.
- Ramakrishnaiah CR, Sadashivaiah C, Ranganna G (2009) Assessment of water quality index for the groundwater in Tumkurtaluk, Karnataka, India. E-Journal of Chemistry, 6: 523-530.
- Todd DK (1980) Ground water hydrogeology.
- Subramani T, Elango L, Damodarasamy SR (2005) Groundwater quality and its suitability for drinking and agricultural use in Chithar River Basin, Tamil Nadu, India. Environ Geol 47: 1099-1110.
- Richards LA (1954) Diagnosis and improvement of saline and alkali soils.
- Singh AK, Mondal GC, Kumar S, Singh TB, Tewary BK, et al. (2008) Major ion chemistry, weathering processes, and water quality assessment in upper catchment of Damodar River basin, India. Envir Geol 54: 745-758.
- Wilcox LV (1955) Classification and use of irrigation waters.
- Kumar M, Kumari K, Ramanathan AL, Saxena R (2007) A comparative evaluation of groundwater suitability for irrigation and drinking purposes in two intensively cultivated districts of Punjab, India. Environ Geol 53: 553-574.
- Paliwal KV (1972) Irrigation with saline water.
- Gupta SK, Gupta IC (1987) Management of saline soils and water. Oxford and IBH Publishing Company, New Delhi, India 399.
- Doneen LD (1964) Notes on water quality in agriculture. Published as a Water Science and Engineering Paper 4001, Deparment of Water Science and Eng, University of California, Devis.
Relevant Topics
- Atmosphere
- Atmospheric Chemistry
- Atmospheric inversions
- Biosphere
- Chemical Oceanography
- Climate Modeling
- Crystallography
- Disaster Science
- Earth Science
- Ecology
- Environmental Degradation
- Gemology
- Geochemistry
- Geochronology
- Geomicrobiology
- Geomorphology
- Geosciences
- Geostatistics
- Glaciology
- Microplastic Pollution
- Mineralogy
- Soil Erosion and Land Degradation
Recommended Journals
Article Tools
Article Usage
- Total views: 4693
- [From(publication date):
December-2016 - Jul 09, 2025] - Breakdown by view type
- HTML page views : 3680
- PDF downloads : 1013

