Crossflow Turbine Design Specifications for Hhaynu Micro-Hydropower Plant-Mbulu, Tanzania
Received: 29-Mar-2019 / Accepted Date: 12-Apr-2019 / Published Date: 19-Apr-2019
Abstract
Micro-hydropower plants are very applicable in rural and off-grid areas where water resources become available. This is because they can be installed with fraction of the cost as compared to large hydropower plants or even grid extension. Also in rural and off-grid areas, the population density is small and very sparsely distributed which makes it un-economical for the development of large electricity supply projects. In this case the mini and micro energy projects are the suitable technology to be used to supply power to the consumer load demand in the rural and off-grid areas. One of the sustainable ways to do is to use the available water resources like small rivers to develop micro-hydropower plants. The effective use of water from local rivers to develop micro-hydropower plants have proven to be sustainable way of electricity generation. But despite all these positive outcomes, studies have shown that many of the available rural areas micro-hydropower potential sites are facing reduced water volumetric flow due to irrigation activities and also lack high site heads due to the nature of the landscape. In this case, the development of a micro-hydropower for electricity generation is limited to specific type of hydro turbine technology called crossflow turbine. This is because this type turbine technology can accommodate wider range of flow discharge and head values in the micro and mini scale of hydropower technology range. The crossflow turbines can also be manufactured locally and adapted to the local rural environments and also have been proven to be very robust with less operational and maintenance costs. Thus why there is a need to customize this technology in the local rural area in terms of turbine design in order to standardize the local manufacturing and this is the main motivation that this design study have been addressing.
Keywords: Crossflow; Hhaynu; Micro-hydropower; Hydro turbine; Mbulu; Tanzania
Introduction
The type of turbine to be used in Hhaynu micro- hydropower project has been selected based on the data obtained from the site area. In this case, two site measured parameters are required for the determination of turbine type selection and these parameters are the available volumetric flow of the river (Q) and site head (H). On the other hand in literature, there are two general types of a water turbines, Reaction turbine and Impulse turbines on which each type fits on specific site characteristic for it to be selected for a particular application. In terms of their characteristics reaction turbines requires a substantial amount of water flow discharge while impulse turbines are much more dependable on medium and high head site locations [1].
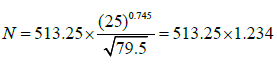
From the site feasibility study report, the determined volumetric flow for Hhaynu river is 0.9 m3/s on which the results from the hydrological study shows that only 0.45 m3/s (50% flow) is the feasible discharge flow for the micro-hydro turbine system on which it will make provision for environmental flow during the dry season. In addition to that, the ma×imum gross head obtained after taking the site measurements is 25 m and this is the distance from the forebay area to the power house location. Using these two values which have been obtained from the site measurements, then the type of turbine technology to be used for this research project is obtained by using the following two diagrams in Figure 1 and Figure 2 below [2,3].

Figure 1: Turbine selection chart based on head and flow discharge.

Figure 2: Turbine selection chart based on water flow discharge and head.
As shown in Figure 1 above the cross-reference lines for the site measured values of the net head of 22.71 m (25 m gross head) and turbine discharge of 0.45 m3/s with the 79.5 kW turbine mechanical power which falls under crossflow turbine category and therefore this type of turbine technology will be used in this research project.
Alternative turbine selection chart has been used based in Figure 2 below which also shows similar results for the selected crossflow turbine technology. Both charts shows that crossflow turbines have a wider range of head and flow discharge values from low to medium values, thus why they are mostly applicable to micro- hydropower systems in developing countries like that of Hhaynu micro-hydropower plant in Mbulu, Tanzania as shown in Figure 2 below.
Materials and Methods
Turbine transmission
The micro-hydro turbine transmission involved the turbine rotational speed in RPM and also transmission speed ratio between the turbine and generator pulleys.
Turbine speed: Cross flow turbines use pulley and belt as the transmission drive from the turbine to the generator unit which means that the turbine speed is usually lower than the generator speed. In calculating the generator speed the following formula (1) is used [4].
 (1)
(1)
Where; N=Turbine speed in RPM, Hg=Gross head (m) and Pm=Mechanical/Turbine Power (kW)
So, substituting the values we get;
N=633.30 RPM
Choose the value of the turbine speed to be 635 RPM (satisfying the condition that turbine and generator speed ratio should be between 2-3) [5].
Turbine- generator speed ratio:
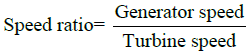

Thus the Turbine- Generator speed ratio is 1:2.3622 (Table 1).
| S/N | Parameter | Value | Unit | Remarks |
|---|---|---|---|---|
| 1 | Turbine speed | 635 | RPM | Design value |
| 2 | Speed ratio | 1:2.36 | ||
| 3 | Turbine torque | 1.5 | kNm | |
| 4 | Turbine shaft diameter | 60 | mm | Design value |
Table 1: Summary of main turbine design values.
Turbine parameters
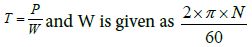
Turbine shaft diameter: The turbine shaft diameter is calculated using the Power- Torque equation (2) as follows;
P=T.W. (2)
Where; P=Mechanical Power, T=Torque, W=Rotational speed in radians and N=speed in RPM

Then, Tmax=1.25 × T=1.25 × 1196.154=1495.1928 Nm
Also the Torque can be calculated using the following shear stress equation (3) as follows;
 (3)
(3)
Where: τs=shear stress of steel=42 MPa
Re-arranging the equation gives the following;
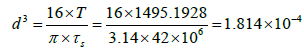
d=0.0566 m=56.61 mm=≈ 60 mm
So, the diameter of the turbine shaft is 60 mm (Figure 3).

Figure 3: Turbine shaft diameter.
Turbine runner outer diameter: The outer diameter of the turbine runner is calculated using the following equation;
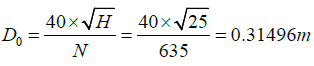
D0=315 mm
Turbine runner outer diameter is shown in the below Figure 4.

Figure 4: Turbine runner outer diameter.
Turbine runner length and runner blade spacing: The turbine runner length is given using the following equation (4);
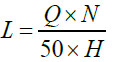 (4)
(4)

Turbine length, L=228.6 mm ≈ 2222222222 (Figure 5)

Figure 5: Turbine runner length.
Turbine runner blade spacing:
Blade jet entrance (te)=K. Do (5)
Where; K=constant value=0.087
te=0.087 × 315 mm=27.405 mm ≈ 28 mm
Take standard blade spacing value of te=≈ 22222222
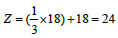
Turbine runner tangential spacing and runner blade number:
Tangential spacing (tb)=0.174 × Do (1.6) (6)
tb=0.174 × 315 mm=54.81 mm ≈ 55 mm
Take the standard tangential spacing value, tb=55 mm [This is also called Radial Rim Width (a)]
Turbine runner blade number:
Minimum number of runner blade;
 (7)
(7)
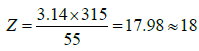
But, the recommended number of runner blade should be at least 30% more than the calculated value in order to make it effective, so in this case the design number of runner blades,
Thus, the turbine runner blade number is 24
Water jet thickness and nozzle area to the runner:
Water flow jet thickness:
tj=0.29 × Do (8)
tj=0.29 × 315 mm=91.35 mm ≈ 99222222 So, the water jet thickness to the turbine entry is 92 mm (Figure 6).

Figure 6: Turbine nozzle area.
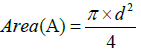
Nozzle area:
Area=L × W (9)
Area=0.23 × 0.092=0.02116 m2 Area=2.116 × 10⁻² m2
Size of penstock pipe diameter to connect the nozzle
The area is given using the following formula,
 (10)
(10)
Re-arranging the equation gives,
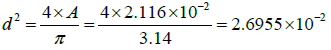
D=0.16418 m=164.18 mm
So, the size of the penstock pipe diameter to connect to the turbine nozzle is 164.18 mm (take 165 mm) which is equivalent to 6.5” pipe size.
Inner diameter of the turbine runner and radius of blade curvature:
Inner diameter of the runner (Di)=Do – 2 × radial rim width
Di=315 – 2 × 55=205 mm
Radius of blade curvature:
Radius of the blade curvature (Rc)=0.163 × Do
Rc=0.163 × Do
=0.163 × 315 mm
=51.345 mm
Rc=≈ 55222222
So, the diameter of the pipe for blades=2 × Rc=2 × 52 mm=104 mm
Thus, the selected value of the blade curvature should be from class C steel pipe of size 4”.
Alternatively, Do=Di+2Rc which gives

Water jet velocity and turbine arc length: The water jet velocity is calculated on the impulse turbines (Crossflow and Pelton) using the following equation (11);
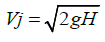 (11)
(11)
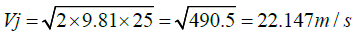
Vj=22.147 m/s
Thus, the water jet velocity, Vj is 22.15 m/s
Turbine arc length:
 (12)
(12)
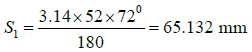
S1=≈ 66 mm
Pipe cut for turbine blades:
Size of pipe diameter 104 mm (4”)
Then the pipe circumference is given by;
C=π × D
C=3.14 × 104=326.56 mm
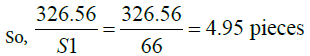
Where: S1=the arc length (equation 12)
Note: Cut 4 full pieces of 4” diameter steel pipe to make the turbine blades.
Water pressure and force to the turbine nozzle: In water power systems, the power inside the turbine is given by;
Pt=pQ (13)
Where: p=pressure (kN/m2), Q=Flowrate (m3/s), Pt=Turbine (kW)
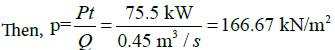
But pressure  when re-arranging this equation gives the following (14);
F=p × A (14)
But, Area=L × W
A=0.23 × 0.092=0.02116 m2
So; Force (F)=p × A=166.67 × 0.02116=3.5267
kN
Therefore, the Force e×erted to the turbine runner through the nozzle, F=3.53 kN
Alternatively;
Power (Pt)=Water Force (Fw) × Velocity (Vj)
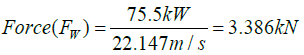 (15)
(15)
Then the distributed force at the turbine entry=F1=F/L=3,530 N/m × 0.23
Therefore the distributed water force on the turbine=811.9 N
Penstock pipe calculations
The penstock is the steel pipe that conveys water with pressure from the forebay to the turbine unit in the power house. The water in the forebay is stored in a form of potential energy and when delivered to the turbine through a penstock pipe and produce kinetic energy which rotates the hydro turbine. On the other hand, the penstock steel pipe wall thickness depends on the pipe materials, diameter and operating pressure and is calculated as follows:
Penstock diameter and thickness:
Dp=2.65 × (n2 × Q2 × Lp/Hg) 0.204 (16)
Where: Dp=penstock diameter,
n=manning coefficient for the mild steel penstock pipe=0.012
Q=design flow discharge=0.45 m3/s
Lp=length of the penstock=162 m Hg=Gross head=25 m
So in this case;
Dp=2.65 × ( (0.012)2 × (0.45)2 × 162/25) 0.204
=2.65 × (0.000144 × 0.2025 × 6.48) 0.204
=2.65 × (1.88956 × 10-4) 0.204=0.460918 m
Dp=460 mm
Therefore, the size of the penstock pipe selected to supply the design discharge to the turbine is 460 mm dimeter (18”) [6].
From literature, the minimum wall thickness is given by the following equation (17) [7]
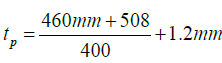 (17)
(17)
tp=minimum penstock thickness (mm)
Dp=penstock diameter=460 mm
tp=3.62 mm=~ 4 mm
Therefore the thickness of the steel penstock pipe selected is 4 mm
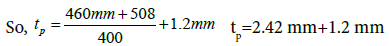
Water flow velocity in the penstock: The water flow discharge to the turbine passes through the penstock pipe and is given by the following equation (18):
Q=AV (18)
Where;
Q=water flow discharge, A=penstock pipe area and V=water flow velocity
Making V the subject from the above equation gives (19);
 (19)
(19)
Water flow velocity V in the penstock is 2.7 m3/s [Recommended water flow velocity in the penstock pipe range between 1 m/s – 2.8 m/s] [8].
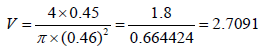
Area of the penstock pipe: Area of the penstock pipe is given by the following equation (20);
 (20)
(20)
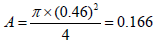
Therefore, the computed area of the penstock is 0.166 m2
Penstock head loss: Head loss in the penstock can be calculated using the following equation (21):
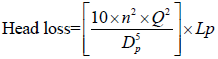 (21)
(21)
Where; n=Manning value, Q=Design flow discharge, Dp=Diameter of the penstock and Lp=Length of the penstock
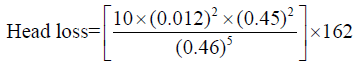
=0.014158 × 162 m =2.294 m
Head loss=2.29 m
Therefore, the net head is given;
Net head=Gross head – head loss=25 m – 2.29 m=22.71 m
Net head is 22.71 m.
Percentage of head loss:
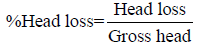 (22)
(22)
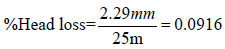
Head loss=9.16 %
The recommended economical head loss for most small hydropower schemes should be below 10% (Table 2) [9].
| S/N | Parameter | Value | Unit | Remarks |
|---|---|---|---|---|
| 1 | Penstock diameter | 460 | mm | 18” Standard value |
| 2 | Water velocity in the penstock | 2.7 | m/s | 1 m/s-2.8 m/s so, OK |
| 3 | Area of the penstock pipe | 0.166 | m2 | |
| 4 | Penstock head loss | 2.29 | m | |
| 5 | Percentage of head loss | 9.16 | mm | <10% so, OK |
Table 2: Summary of penstock pipe design values.
Pulley and belt design
In order to calculate the pulley and belt parameters, the following standard values have been selected based on the turbine and generator design calculations:
Turbine design parameters:
(a) Turbine speed=635 RPM
(b) Turbine Power=79.5 kW
(c) Turbine operation time 24 hours
Generator design parameters:
(a) Generator speed=1500 RPM
(b) Generator Power=75.5 kW
(c) Synchronous, 3 phase, 90 KVA with power factor 0.8
(d) Generator pulley diameter=150 mm (OK because >140)
(e) Generator operation time 24 hours
Turbine pulley design:
Turbine pulley diameter using speed ratio
In calculating the turbine-generator speed ratio the turbine and generator speed and diameter ratios need to be considered as follows (23);
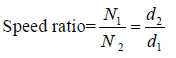 (23)
(23)


Therefore the pulley diameter d1 of the turbine side is 354.33 mm as shown in Table 3 below.
| Generator Pulley diameter (mm) | Turbine pulley diameter (mm) | Closest standard Turbine pulley diameter (mm) | Turbine speed (RPM) |
|---|---|---|---|
| 150 | 354.33 | 355 | 635 |
Table 3: Generator and Turbine pulley dimensions.
Sizing of the belt length
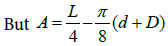
The belt length is determined using the following relation (24);
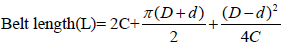 (24)
(24)
Where: C=centre distance and d=diameter of pulley
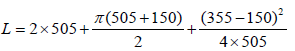
L=1802.85 mm+20.8045 mm
L=1823.654 mm
The closest standard v-belt length is SPB wedge belt SPB1825 with 17 mm top width and 13 mm height (Figure 7).

Figure 7: Designed V-belt section.
Turbine pulley belt speed
The turbine velocity is given with the following equation (25):
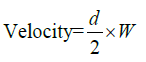 (25)
(25)
Where; w is the rotational turbine speed given as (26);
 (26)
(26)
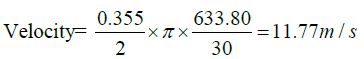
(OK because <40)
Therefore the belt velocity of the turbine pulley is 11.17 m/s.
Belt centre distance
Centre distance C is calculated as follow;
C=d+D=150 mm+355 mm=505 mm
But the e×actly centre distance can be calculated using the following formula (27);
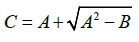 (27)
(27)
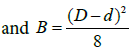
Taking L=1825 mm and substituting the values to the above A and B equations gives;
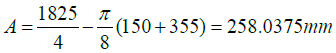
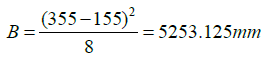

Therefore the actual centre distance for the belt is 505.69 mm.
Power per belt
Interpolating from the given Table [10]
-Rated power per belt=(20.75+23.56)/2=22.155 kW
-Additional power=(1.50+1.75)/2=1.625 kW
Therefore the basic power per belt=22.155 kW+1.625 kW=23.78
kW
Correction power per belt
From Table the combined correction factor is 0.85 [10]
Therefore correction power per belt=23.78 kW × 0.85
Correction power per belt=20.213 kW
Number of belt
Number belt for the belt design is given as follow;
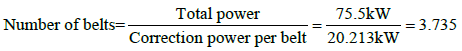
Therefore choose 4 belts as standard
Net driving force
The net driving force from the turbine pulley is given from the following equation;
Fd=Ff-Fb
The above equation can also be derived from the torque formula (28) as;
Torque=Fd × r (28)
where r=radius of the turbine pulley (177.5 mm) and T=Torque (1,495 nm)
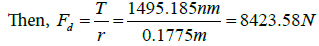
Therefore, the driving force for the turbine pulley system is 8.423 kN (Table 4).
| S/N | Parameter | Value | Unit | Remarks |
|---|---|---|---|---|
| 1 | Turbine pulley diameter | 355 | mm | Standard value |
| 2 | Generator pulley diameter | 150 | mm | |
| 3 | Length of the belt | 1825 | mm | SPB1825 |
| 4 | Belt velocity | 11.7 | m/s | <40 so,OK |
| 5 | Belt centredistance | 505.69 | mm | |
| 6 | Number of belts | 4 | pcs | |
| 7 | Net driving force | 8.42 | kN |
Table 4: Summary of pulley and belt drive design values.
Electrical system components
The electrical components consist of the generator system and transmission system. These components are related to the electrical power produced and transmission to the consumers.
Generator system: The generator system will be operated with the following rated design values:
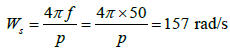
Frequency, f=50 Hz
Rated power, Pe=75.5 kW Efficiency, eff=95%
Rated speed, N=1500 RPM Number of poles, p=4 Power factor, p.f.=0.8
The generator power is calculated based on the available turbine mechanical power using the following equation;
Pe=turbine mechanical power × generator efficiency
(Refer to the turbine mechanical power, Pm=0.45 m3/s × 9.81 m/s2 × 25 m × 0.72=79.46 kW) Therefore, Electrical Power,
Pe=79.46 × 0.95=75.49 kW
Pe=75.5 kW (Figure 8) [11].

Figure 8: Efficiency range with design flow discharge for different turbines.
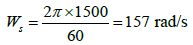
The generator power output will be supplied to the consumer load through the local grid connections in the area. The generator design output value is very much influenced by the turbine output power. The synchronous speed, ws of the generator is related to the speed N and is given as (29):
 (29)
(29)
At the rated condition N=1500 RPM
So, synchronous speed
This can also be calculated using the following equation;
In the actual speed of the generator changes due to load changes and this affects the actual speed of the generator. This speed value is the difference between the actual speed and synchronous speed and is the one that determines the instantaneous generator speed under different loading condition as shown in Table 5 below.
| Generator Power (kW) | Generator speed (RPM) | Generator speed (rad/s) | Remarks |
|---|---|---|---|
| 75 | 1500 | 157 | Rated capacity |
| 40 | 1520 | 159.09 | Minimum load |
| 101.8 | 1494 | 156.37 | Maximum load |
Table 5: Generator power and speed at different rated capacity.
Therefore, the difference in speed (RPM) from the above three scenarios can be calculated as follows (40);
 (40)
(40)
At low power demand,
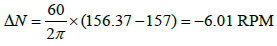
(this indicate a generator speeds up which is over speed during low demand)
At high power demand, (this indicate a generator slows down which is under speed during high demand)
Discussion and Conclusion
In designing hydro turbines, many parameters need to be considered on which most of them are obtained from a particular site. Two of the most deterministic parameters to be considered are the design flow discharge (Q) and site head (H) which are obtained from the particular site during feasibility study and data measurements. In additional to that, the two measured parameters can also be used to determine the type of turbine technology to be used in a particular hydropower project by using standard turbine selection charts. On the other hand, when turbine design capacity need to be determined, the value of flow discharge (Q) and site head (H) are also used as inputs to determine the turbine power using the standard formulas. Thus, using the results from the currents study for the turbine design, the flow discharge for Hhaynu micro-hydropower plant is 0.45 m3/s with the site head of 25 m and based on the turbine selection charts, the selected turbine type falls under the crossflow turbine technology. The crossflow turbine technology has wider values of flow discharge and head in the medium range which make them to be widely used for micro- hydropower projects in off-grid rural areas. The crossflow turbines can also be adapted locally with a simple design which results to low in maintenance cost hence makes the micro- hydropower project sustainable.
Acknowledgement
This turbine design project was funded by the Rural Energy Agency (REA) in collaboration with Arusha Technical College-(ATC) as part of the Hhaynu Microhydropower project development in Mbulu, Tanzania and my research study at Newcastle University in the UK.
References
- Oliver P (2002) Micro-hydro power: Status and prospects. J Power and Energy 216: 31-40.
- Fraekel P, Paish O, Bokalders V, Harvey A, Brown A, et al. (1991) Micro-hydro Power: Aguide for development workers. Immediate Technology Publications in association with the Stockholm Environment Institute.
- Penche C (1998) Layman’s guidebook on how to develop a small hydro site, published by European Small Hydropower Association (ESHA), Second edition, Belgium.
- Mockmore CA, Merryfield F (1949) The Banki water turbine. Engineering experimental station bulletin series No. 25.
- Nasir BA (2014) Design considerations of micro hydro electric power plant. International Conference on Technologies and Materials for Renewable Energy, Environment and Sustainability, TMREES14. Energy Procedia 50: 19-29.
- Mohibullah MAR, Hakim MA (2004) Basic design aspects of micro-hydro- power plant and its potential development in Malaysia. National Power and Energy Conference (PEC on) Proceedings, Malaysia.
- Singh D (2009) Micro-hydropower, resource assessment handbook. Asian and Pacific Centre for Transfer of Technology of the United Nations- Economic and Social Commission for Asia and the Pacific (ESCAP).
- New South Wales (2000) Technical and education commission. Manufacturing and Engineering Educational Services. Bankstown, N.S.W.: Manufacturing and Engineering Educational Services, N.S.W. TAFE Commission (3rd Edn).
- Penche C (1998) Layman's guidebook on how to develop a small hydro site. European Small Hydropower Association (ESHA) (2nd Edn), Belgium.
Citation: Ngoma DH, Wang Y, Roskilly T (2019) Crossflow Turbine Design Specifications for Hhaynu Micro-Hydropower Plant-Mbulu, Tanzania. Innov Ener Res 8:225.
Copyright: © 2019 Ngoma DH, et al. This is an open-access article distributed under the terms of the Creative Commons Attribution License, which permits unrestricted use, distribution, and reproduction in any medium, provided the original author and source are credited.
Share This Article
Recommended Journals
Open Access Journals
Article Usage
- Total views: 6029
- [From(publication date): 0-2019 - Apr 05, 2025]
- Breakdown by view type
- HTML page views: 4998
- PDF downloads: 1031