Cropping Pattern and Crop-Water Productivity Assessment in Mizawa Watershed, Blue Nile Basin, North Western Ethiopia
Received: 21-Mar-2022 / Manuscript No. acst-22-49581 / Editor assigned: 24-Mar-2022 / PreQC No. acst-22-49581 (PQ) / Reviewed: 07-Apr-2022 / QC No. acst-22-49581 / Revised: 20-May-2022 / Manuscript No. acst-22-49581 (R) / Published Date: 01-Jun-2022 DOI: 10.4172/2329-8863.1000517
Abstract
The big problem that challenges agricultural production is to produce more food from less water. Information on crop water in productivity Mizawa micro watershed was not available to conduct water conservation practices without losing productivity levels of crops. To fulfill these gaps the study was designed to assess crop water productivity of major crops. CROPWAT model version 8.0 (2009) was used to compute the crop water requirement for each crop. In order to produce cropping pattern map of the study watershed, track points of boundaries of each crop fields and other land use classes were recorded using a hand held GPS. The collected track points were transferred to ArcMap directly from GPS using DNR Garmin software and changed to shape file (polygon). The weather data obtained from the weather stations was input into the FAO CROPWAT model was used to generate the crop water requirements and crop water use (actual evapotranspiration) for each crop in the cropping seasons. Water productivity was calculated for each crop after the average productivity of each sampled crop types were determined in kg/ha from the sampled crop using excel. Crop water use of the three major crops in Mizawa watershed was 456, 317 and 304 for maize, finger millet and tef respectively. In the 2011 cropping season the average the crop water productivity of rainfall of maize, finger millet and tef which was 0.014 kg/m3, 0.008 kg/m3 and 0.006 kg/m3 in respectively. Crop water productivity results by this study fall in the lower ranges of other studies. This might be because the in the monitoring sites fertilizer application and use of improved varieties was not practiced in the monitored sites. The crops got deficit especially in the mid of the growing seasons which exists in large parts of the watershed, as well as excess water and flooding as a result of high rainfall and low effective rainfall amount was observed in the development stages of the three crops under investigation showing management practices are the key to sustain high efficiency.
Keywords: Mizawa, Watershed, Crop, water, Productivity, Cropping pattern
Introduction
The big problem that challenges agricultural production is to produce more food from less water. Water demand already exceeded supply in many parts of the world, and as world population continues to rise, many more areas are expected to experience water scarcity. Increasing water scarcity poses a threat to food security and safe domestic water supplies. Agriculture, the sector in which a large majority of the poor makes a living, is the engine of overall economic growth and, therefore, broad-based poverty reduction. Globally, it is the major user of all water resources (green water and blue water) and it accounts for about 70% of all withdrawals worldwide. Water is the most limiting factor for agricultural development and it is the scarcest natural resource. The global contribution of rain-fed agricultural systems is around 69% and where 58% of the world food is produced. It is primarily dependent on soil moisture gained from infiltrated rainfall. The semi-arid regions in Asia and Africa are primarily dependent on rain-fed agriculture. Because of rainfall variability, accelerating land degradation, on adoption of appropriate technologies, and limited economic investments, the productivity of rain-fed systems has been quite low. Hence, the relative share and severity of poverty is often higher in rain-fed regions [1]. Currently, global discussions on water scarceness have been prevailed by considerable amount of debate on the productivity of water in view of the increasing scarcity of economically accessible water resources in many regions. Over the coming decades, global change will affect food and water security and the livelihoods of poor farmers (IFPRI, 2008). Raising water productivity in agriculture sector is the basis of demand management strategy, as this sector continues to be the major consumptive user of water in many transitional economies. The last decades have brought the plague of extended drought to many African countries where water scarcity is reaching alarming dimensions in response to the extremely rapid population growth. In fact, the population increase is consuming the future water potential. With 99% rain fed production of main cereals such as maize, millet and sorghum, the cultivated cereal area in sub-Saharan Africa has doubled since 1960 while the yield per unit of land has been nearly stagnant for these staple crops (FAOSTAT, 2005). Many countries in Africa will not be able to afford the water demands expected from rising sectors of society such as industry. Most of the East African countries will have arrived at absolute scarcity by 2025. Five of these countries will depend on water security to support high yields or even have to import food for self-sufficiency [2].
Problem statement
Climate change, increasing food demand, and mismanagement of land are some of the first ranking factors that contribute to the scarcity of water. Reducing poverty in rural areas of developing countries requires maintained and sustainable increases in agricultural water productivity. Water is one of the most critical inputs for agriculture. However, the level of water use differs significantly across basins and farming systems, and even farm plots. As the largest water user, the agricultural sector is facing a challenge to produce more food with less water, or to produce more crops per drop. Arid and semiarid regions of Ethiopia mostly face with inadequate, irregular and erratic nature of rainfall. Water scarcity to a great extent affects crop and mixed croplivestock systems in the country [3]. To sustain the rapidly growing Ethiopian population, agricultural production will need to increase, but the proportion of fresh water currently available for agriculture is decreasing (IWMI, 2000). Amhara region where the Mizawa micro watershed if found is the area where 25 % of the Ethiopian population resides, out of which nearly 90 % lives in rural areas engaged in subsistence crop-livestock mixed agriculture activities (CSA 2007). Despite the ample natural resources, an overwhelming number of people in the region suffer from poverty and food insecurity. Water has become increasingly scarce in a number of places a number of places in this region. Out of the 105 districts found in the region, 48 of them were classified as drought prone and food insecure areas [4].
Thus, in order to solve the problems and satisfy the food needs of the growing populations in the area, the productivity rain fed agricultural systems should be improved and through efficient use of water and development of new technology and policy options for sustainable intensification and diversification of production systems. For accomplishing these problem-solving journeys by different stakeholders’ better knowledge of crop water productivity in the watersheds and micro-watersheds is valuable information to achieve local water conservation practices without losing productivity levels of crops. To gain this knowledge, it is very important to have data available on actual crop production and crop-water productivity from field. To fulfill these gaps in Mizawa micro Watershed, the study was designed to assess crop water productivity of major crops [5].
Objectives
The general objective of this paper therefore is to assess the crop water productivity different landscape positions for crops commonly cultivated in Mizawa micro watershed under rain-fed agriculture [6].
The specific objectives
• To analyse the major crops and land use inventory of the study watershed
• To produce land use and cropping pattern map of the study watershed
• To analyze changes in cropping pattern, cropping intensity of the study watershed
• To estimate biomass and grain yields of major crops in the study watershed
• To map and analyse the crop productivity of the study watershed
Scope of the study
The study was conducted in Mizawa micro watershed which is found in Ariba Amba Kebele Administrations. The watershed has been stratified into three landscape positions (upper, middle and Lower) and theses three landscapes were included in the study. Therefore, the study was restricted to the assessment of water productivity of the major crops in their respective local landscape positions (agro-ecological zones) in the watershed. So the study was limited to Mizawa micro watershed, Upper Blue Nile Basin which has 27 m2 areas and restricted to the assessment of water productivity of the major crops, assessing the cropping intensity and cropping pattern mapping [7].
Significance of the Study
Few studies have been conducted to understand the water productivity and cropping pattern and intensity of watershed in the Blue Nile Basin. The research aims to generate valuable data and information that can help to reveal the current status of crop-water productivity, identify determinant factors affecting crop-water productivity. It also will help to give directions and devise solutions that can improve the crop productivity of the area and thereby improve the livelihoods of the people who are dependent on rain fed agriculture. The results of this study help for policy makers, national and international actors and other stakeholders to take the right decisions related to crop productivity. It is also have a very big significance for the local community in the area and other communities in watersheds with similar characteristics [8].
Literature Review
Crop water productivity
Water is one of the most important inputs essential for the production of crops. Plants need it continuously during their life and in huge quantities. It profoundly influences photosynthesis, respiration, absorption, translocation and utilization of mineral nutrients, and cell division besides some other processes. Agriculture is concerned with the conversion of solar radiation to energy usable by people for food, fibre, and fuel. Biomass production (BIO) is associated with Photosynthetically Active Radiation (PAR) that is part of the short wave solar radiation which is absorbed by chlorophyll for photosynthesis in the plants, regulating primary productivity, or the rate of carbon fixed by the plants [9].
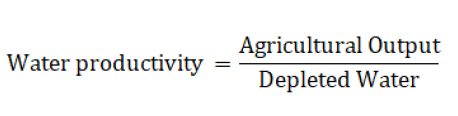
Estimations of crop production at different scales are becoming more important in both developing and developed countries for supporting policy planning and decision-making in agriculture. The need for modeling water productivity in semi-arid regions is increasing with climate and land use changing together with the current emerging crisis in food security, due to the growing world population. Water productivity is the ratio of outputs to the amount of water consumed and measures the ability of agricultural systems to convert water into food. It is defined as the ratio of the net benefits from crop, forestry, fishery, livestock, and mixed agricultural systems to the amount of water required to produce those benefits. In its broadest sense it reflects the objectives of producing more food, income, livelihoods, and ecological benefits at less social and environmental cost per unit of water used, where water use means either water delivered to a use or depleted by a use. It is used exclusively to denote the amount or value of product over volume or value of water depleted or diverted. When the productivity of water is evaluated in relation to agricultural products it is termed as agricultural productivity. The value of the product might be expressed in different terms (biomass, grain, money) [10].
Crop water productivity is defined in either physical or monetary terms as the ratio of the product (usually measured in kg) over the amount of water depleted (usually limited to crop evapotranspiration, measured in m3). Crop water productivity is Water Productivity (WP) broadly signifies the efficiency of water use at the production system or farm level. At this scale, the production of more economic biomass per unit of water is expressed both in terms of more crop per unit
Crop Water Productivity can be also calculated for each crop for each year. The Crop Water Productivity under rain-fed condition (CWPrf) was expressed as:
Over 90% of the water required by terrestrial plants is not ‘used’ in any biochemical way but lost through transpiration. The crop water productivity is a vital parameter to assess the performance of irrigated and rain fed agriculture it can be represented in physical or economic units. The physical crop water productivity (kg/m3) is the ratio of crop yield (ton/ha) to the amount of water used (m3/ha). The economic water productivity ($/m3) relates the economic benefits per unit of water used [12].
Determination of crop water productivity
How to reduce agricultural water use and make water resources more sustainable is an increasingly urgent question. It is a question that requires combined agronomic, physiological, biotechnological/ genetic and engineering approaches which may be collectively described as ‘water saving agriculture. It is important to use appropriate agronomy to grow crops best suited to the environment, with least use of water, whether in irrigated or rain fed production. We need to develop crops that require less water to produce sufficient yield, through understanding the physiological mechanisms that determine growth and water loss, and plant response to reduced water availability. We need to consider fully the returns on irrigation, as part of making real improvements in sustainable water management [13].
Evapotranspiration (ET) (which includes a shift from nonproductive evaporation to productive transpiration without external hydrological implications) and in terms of more crop per unit rainfall or even per unit harvested water [11] (Table 1).
Crop water requirements
Water requirement of a crop is the quantity of water needed for normal growth and yield and that may be supplied by rainfall or irrigation or both. Water needed mainly to meet the demands of Evaporation (E) and Transpiration (T) and metabolic needs of the plants altogether known as Consumptive Use (CU). Crop Water Requirement (CWR) is defined as the depth of water needed to meet the water losses through Evapotranspiration (ET) of a disease free crop, growing in large fields under non restricting soil conditions including soil water and fertility while achieving full production potential under the given growing environment (IUCN, 2006). The crop water need mainly depends on the climate, crop type, growth stage of the crop etc. CWR of various crops grown in fields is determined from ETo using crop coefficient of each crop. The procedures for crop water management and applications for planning and management in rain fed agriculture and irrigated were facilitated by the development of computerized procedures in CROPWAT [14]. The factors that mainly determine crop water need are climate, crop type and crop growth stage. In sunny hot climate crops need more water per day than in a cloudy and cool climate. Some crops need more water than others. This crop water need also varies at their initial and late crops growth stages [15].
The estimation of crop water requirements or need is derived from estimating crop evapotranspiration according to standardized crop and climatic conditions. A range of methods were developed to estimate potential crop Evapotranspiration (ETc) from readily available climatic parameters. The water requirement of a given crop was derived through a crop coefficient that integrated the combined effects of crop transpiration and soil evaporation into a single crop coefficient, according the following relationship:
ETcrop=Kc × ETo
Where: ETo is reference crop evapotranspiration Kc is crop coefficient
ETcrop is the crop evapotranspiration, computed for optimal conditions (ETc)
Evapotranspiration
Evapotranspiration is a combination of evaporation and transpiration. It is the physical process whereby water flows from the evaporating surfaces into the atmosphere which is referred to as actual Evapotranspiration (ETa). The ETa is critically important in semi-arid regions because besides being essential for crop production its increase means less water available for ecological and human uses in river basins. Distinctions are made between reference crop Evapotranspiration (ETo), potential Evapotranspiration (ETp) and ETa. ETo is the water flux from a reference surface, not short of water, which can be a hypothetical grass surface with specific characteristics. ETp may be referred as the water flux from crops that are grown in large field sunder optimum soil moisture, management and environmental conditions, and achieve full production under the given climatic conditions. ETa involves all situations of the vegetated surface. Due to sub-optimal crop management and environmental constraints in semi-arid environments that affect crop growth and limit evapotranspiration, ETa is generally smaller than ETp [16].
Effective rainfall
When rain water falls on the soil surface, some of it infiltrates into the soil, some stagnates on the surface, while some flows over the surface as runoff. When the rainfall stops, some of the water stagnating on the surface evaporates to the atmosphere, while the rest slowly infiltrates into the soil. From all the water that infiltrates into the soil, some percolates below the root zone, while the rest remains stored in the root zone. In other words, the effective rainfall is the total rainfall minus runoff minus evaporation and minus deep percolation; only the water retained in the root zone can be used by the plants, and represents what is called the effective part of the rainfall. The term effective rainfall is used to define this fraction of the total amount of rainwater useful for meeting the water need of the crops which is used effectively [17].
Spatial variability of water productivity
Large variations in water consumption and water productivity of different crops could be explained by factors like land fertility, water supply, crop management and climatic conditions. Both crop yield and CWP differ significantly across countries and even within a country. The potential yield and CWP can be improved in all the countries. This means that better water and fertilizer management can enhance both the food production and the crops produced per drop. Most African countries have the potentials in achieving high maize yield and CWP. The current low values are to a large extent due to the poor water management or the low fertilizer application. Efforts have to be strengthened in water and soil management should the malnutrition be reduced or even eliminated in the near future.
The need for assessment of crop water productivity
Considering the persistently growing pressure on finite freshwater and soil resources, it becomes increasingly clear that the challenge of feeding tomorrow’s world population is, to a large extent, about improved water productivity within present land use. Rain-fed agriculture plays a critical role in this respect. Eighty per cent of the agricultural land worldwide is under rain-fed agriculture, with generally low yield levels and high on-farm water losses. This suggests a significant window of opportunity for improvements. In semi-arid and dry sub-humid tropical agro-ecosystems is the area where the increase in Crop Water Productivity (CWP) is most important. Most of the research examples are taken from sub-Saharan Africa, which faces the largest food-deficit and water-scarcity challenges today. The fear of rapidly growing water scarcity problems, especially in arid and semi-arid tropical regions of the world, is based on analyses comparing blue-water availability with actual blue water withdrawals, and projections of future withdrawals based on general per capita water requirements.
Water productivity in Ethiopia
Written information on water use is not available, but agriculture is obviously the main water consuming sector. Based on the total irrigated area, cropping pattern and calendar, annual agricultural water use is estimated to be in the order of 5.2 km3, while municipal and industrial water withdrawals are estimated to be about 0.33 and 0.02 km3 respectively. Rainfall in Ethiopia is highly erratic, and most rain falls intensively, often as convective storms, with very high rainfall intensity and extreme spatial and temporal variability. Ethiopia is endowed with a substantial amount of water resources. The surface water resource potential is impressive, but little developed. The result is that there is a very high risk of annual droughts and intra-seasonal dry spells. Both irrigated and rain fed agriculture is important in the Ethiopian economy.
Virtually all food crops in Ethiopia come from rain fed agriculture with the irrigation sub-sector accounting for only about 3 percent of the food crops. Export crops such as coffee, oilseed and pulses are also mostly rain fed, but industrial crops such as sugar cane, cotton and fruit are irrigated. Other important irrigated crops include vegetables and fruit trees in medium and large scale schemes and maize, wheat, vegetables, potatoes, sweet potatoes and bananas in small-scale schemes. Apparently, mitigation of intra-seasonal dry spells is a key to improving WP in rain-fed agriculture in semi-arid and dry sub humid tropical environments like Ethiopia. There are three major avenues to achieve this:
• Maximize plant water availability (maximize infiltration of rainfall, minimize unproductive water losses (evaporation), increase soil water-holding capacity and maximize root depth).
• Maximize water-uptake capacity of plants (timeliness of operations, crop management and soil-fertility management).
• Dry-spell mitigation using supplemental irrigation.
Cropping pattern
For the sustainable utilization of the land ecosystems, it is essential to know the natural characteristics, extent and location, quality, productivity, suitability and limitations of various land uses. The analysis of the spatial extent and temporal change of cropland and cropping pattern has critical importance to agricultural sciences. This information helps to formulate future plan of action involving crop, soil and water including the dissemination of agricultural technologies to homogenous areas in the basins and watersheds and microwatersheds.
Crop productivity information, which is a combination of two parameters namely the information about crop type and the information about spatial coverage of that crop, is very important for accurate crop yield estimation. Cropping pattern and changes in land use/cover have long term impact on water productivity, sediment and nutrient by disturbing the watershed ecosystem services which should be evaluated. Planners and policy makers cannot formulate strategies to minimize the undesirable effects of future cropping pattern and land use/cover changes without such information from watershed/ landscape.
Materials and Methods
Description of the study area
Location: The study area is located 37°46”49.59’ to 37°51” 13.14’ East and 11°52”55.68’ to 11°56”13.41’ North. Mizawa Watershed found in the north-eastern direction of Woreta town of the Fogera district. It is 67 Km North East of Bahir Dar adjacent to Woreta Debre Tabor road. Mizawa has elevation ranging from 1852-2360 masl and covers 27 km2 area. It has mid altitude where crop and livestoke production dominates the area. Maize, Millet and teff are identified as major crops of the area.
Agro-ecology and crops: The watershed has been stratified into three landscape positions (agro-ecological zones) which are lower, middle and upper. Only elevation was used in the classification. The dominant crops cultivated in the study area across the three landscape positions were Finger Millet, teff (Eragrostis tef), maize (Zea mays) and barley (Hordeum Vulgera), Minor crops include, faba bean (Vicia faba L.), field pea (Pisum sativum L.) flax (Linum usitatissimum), and niger seed (Guizotia abyssinica).
Cereals like tef, maize and millet are the predominant crops in the Mizawa micro watershed. In the middle position millet, teff and maize is a dominant crop and in the lower position the order of dominancy is maize, millet and tef. Upper positions barley, fababean and field pea come to be observed respectively. The cropping pattern in the lower position is different from that followed in the upper position.
Sources of climatic and crop yield data
In order to get the productivity of water for the rain fed crops, weather data comprising of rainfall, temperatures, relative humidity, sunshine hours and wind speed were obtained from ten weather stations. These weather stations are Addis-Zemen weather station and Debre-Tabor weather stations. The crop yield and area cultivated to the major rainfed crops were obtained from the archives of the Fogera District Agricultural Office. Records of the crops yield and the total
Climate mean monthly maximum temperature (°C), Mean monthly minimum temperature (°C), Mean monthly relative humidity (%), Sunshine hours (hours), Wind speed
Crop water requirements and water use
The weather data (rainfall, maximum and minimum temperatures, relative humidity, wind speed and sunshine hour data) obtained from the weather stations was input into the FAO CROPWAT model to generate the crop water requirements and crop water use (actual evapotranspiration) for each crop in the cropping seasons. The crop area cultivated to each crop during the cropping season were taken from 2011 crop survey. The Figure 1 shows the location of measurement stations. Although there are many stations installed in nearby the micro watershed, only few stations known by the FAO database.
CROPWAT model version 8.0 (2009) was used to compute the crop water requirement for each crop. It is a program developed for Water Resources Development and Management Services of FAO based on the previous versions of 1992 and 1999 (FAO, 2009). It was mainly designed to calculate crop water requirements and irrigation schedules based on climate data. The users can directly enter data into the CROPWAT model or import from other sources like New LocClim. The required input parameters for the CROPWAT model include: Climate, crops and soil characteristics of the study area. Three main datasets are used as inputs in the CROPWAT estimation: climate, crop and soil. Details of these datasets are tabulated below (Table 2).
parameters required as input data in the model, which include Crop coefficient (Kc), rooting depth and depth of moisture extraction, were assumed to be the default data in the CROPWAT model. The only crop parameters inputted were planting dates and length of crop growing period for each crop, which were adjusted to the cropping calendar in the study area. The cropping calendars for the crops, especially as per planting dates were dictated by the period of the onset of rains. In the simulation model planting dates for the crops were assumed and taken from the 2011 crop survey.
Computation of crop water productivity
After adjusting the moisture content of the gain yield in to 12%, the average productivity of each sampled crop types were determined in kg/ha from the sampled crop using excel. These values were used as a numerator in crop water productivity assessment. In the study, both physical and economic water productivity with respect to consumptive crop water use were determined for further analysis. The procedures employed for each of them were described below.
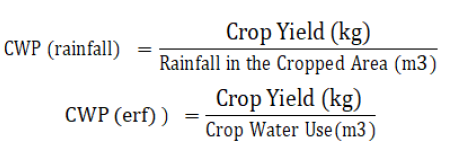
Crop Water Productivity was calculated for each crop. The crop water productivity under rain- fed condition (PWrf) was expressed as: CPW (rainfall)=crop yield (kg)/ rainfall in the cropped area (m3).
The Crop Water Productivity of effective rainfall (CPWerf) was expressed as: CPW (erf)=crop yield (kg)/effective rainfall in the cropped area (m3).
The Crop Water Productivity of water use (CPWeta) was expressed as: CPW (ETa)=crop yield (kg)/crop water use (m3).
Mapping land use and crop types
In order to produce cropping pattern map of the study watershed, track points of boundaries of each crop types and other land use classes were recorded using a hand held GPS. The collected track points were transferred to ArcMap directly from GPS using DNR Garmin software and changed to shape file (polygon). Finally, the cropping pattern map of the study watershed was produced using different GIS techniques. In order to identify the boundaries of each crop fields clearly, the field data collection was completed at the end of harvesting. Area coverage of each crop and other land use types were also calculated by using ArcGIS software.
Recording crop type in which detailed data was collected including planting date, seeding rate fertilizer use, tillage frequency and monitoring of other agronomic practices, phenology, biomass and grain yield for crop phenology and management practice monitoring the sub- watershed was classified in to three landscape components using ArcGis 9.2 3D analysis tool (Figure 2).
Results and Discussion
Agro-ecological/ landscape position classification
For crop phenology and management practice monitoring the district where Mizawa micro- watershed is found was classified in to landscape components taking the altitude in to account using ArcGis 9.2 3D analysis tool. The approach used to landscape classification and identifying the adjoining major crops was adopted from Ian Campbell IPMS Environmental Consultant (IPMS EAASR report, 2005). Based on the agro-ecological classification the presence of three landscape positions/agro ecologies were identified which can helped to identify the major crops growing in the area (Figure 1) and (Table 1). The lower landscape within 1785-1800 masl, the middle within 1801-2000 masl and the upper landscapes within 2001-2410 masl covers 25,107.64, 68,630.47 and 15,394.53 hectares respectively.

Figure 1: Mizawa micro watershed.
| Stakeholder | Definition | Scale | Target |
|---|---|---|---|
| Plant physiologist | Dry matter/transpiration | Plant | Utilize light and water |
| Agronomist | Yield/evapotranspiration | Field | Sufficient Food |
| Farmer | Yield/irrigation | Field | Maximize income |
| Irrigation engineer | Yield/canal water supply | Irrigation scheme | Efficient water utilization |
| Policy maker | $/available water | River basin | Maximize profit |
Table 1: Definition of water productivity given by different stakeholders.
Except the lower landscape position where rice contributed 96% (rice-belt landscape); the other landscape positions have three crops that constitute greater than 70% of the crop cover (Table 2). This approach grouped Mizawa micro-watershed under the middle landscape position where finger millet, tef and maize are major crops (Table 3). Five plots (Figure 2) from each of the major crops in the three landscape positions were selected.
Figure 2: Methodological framework.
| Datasets | Parameters |
|---|---|
| Climate | Mean monthly maximum temperature (°C), Mean monthly minimum temperature (°C ), Mean monthly relative humidity (%), Sunshine hours (hours), Wind speed |
| (km/day), and Precipitation (mm) | |
| Crop |
|
| (ky), and Rooting depth | |
| Soil |
|
Table 2: Datasets and their description.
Cropping pattern
According to the results of the study major livelihood strategy in Mizawa micro watershed is crop livestock mixed farming system. The survey results of the study watershed revealed that more than 64% of the total area was agricultural land in 2011 (Table 3) and the noncropland area is mainly field bounds, fragmented barren land, isolated small settlements. From the total area of the micro watershed more than 43% of the watershed was used for cultivation and settlement and the remaining 21% was grazing land (Table 3). Around 36% of the micro watershed was serving for other non-agricultural activities. Other land use types constituted 35.8% (1150.73 ha) of the total area of the watershed which comprises of, natural and plantation forests, bush and grazing lands, settlement area and others.
The crop dominance map for Mizawa is shown in Figure 3
Figure 3: Percent crop cover source: Field survey, 2011.
The cropping pattern map and the area covered shows finger millet, tef and maize were the dominant crop cultivated in the study watershed with 29.7%, 28.3% and 13.5 respectively which together covered over 74.5% of the total crop area (1229.3 ha) in 2011. It is observed that finger millet and tef are the dominant crops in the watershed. Maize, to a lesser extent, is the dominant crop in the in the watershed in 2011 cropping season. The tef area is distributed in the whole parts of the micro watershed. Other crops, e.g., Niger seed (noug), groundnut, pulses, pepper, potato and linseed are scattered out in fragmentations mixed with the major crops.
Crop rotation and fallowing were the primary activities in the study area. The participants of the survey indicated that they practice this activity for reversing fertility of their fields. Mixed copping systems were also the other commonly common activity. According to the survey results cropping systems vary depending on the onset of rainfall in the watershed in addiction to other criteria’s of selecting to plant the next crop a certain field. In the area two main cropping systems identified in the survey which are dominantly applied for the major crops (Table 4). The first choice is planting maize fields with tef and then planting finger millet in the next cropping season. The second alternative identified in the survey was planting maize fields with Maize crop and then planting the same field with tef in the following cropping season (Table 5).
Based on the crop rotation mechanism the survey participants pointed out the crops the cropping pattern map of the 2010/11 and 2012/13 was developed (Figure 4 and Figure 5). But as indicated in the above paragraph the rotation system might be affected by the late and early onset of rainfall in the area (Figure 6).
Figure 4: Cropping pattern map of 2011/12.
Figure 5: Cropping pattern map of 2010/11.
Figure 6: Cropping pattern map of 2012/13.
| Land use type | Area | % Cover |
|---|---|---|
| Crop land | 1229.3 | 38.2 |
| Residential area | 157.9 | 4.9 |
| Total | 1387.2 | 43.2 |
| Grazing land | 676.23 | 21 |
| Total agricultural land | 2063.48 | 64.2 |
| Forest | 359.1 | 11.2 |
| Riverine forest | 28.32 | 0.9 |
| Eucalyptus plantation | 3.68 | 0.1 |
| Gravel production area | 3.73 | 0.1 |
| Bush land | 755.9 | 23.5 |
| Total non-agricultural land | 1150.73 | 35.8 |
| Total | 3214.2 | 100 |
Table 4: Land use and cover of mizawa micro-watershed.
| Crop type | Area (ha) | % cover |
|---|---|---|
| F. Millet | 365.42 | 31.9 |
| Maize | 165.58 | 14.5 |
| Teff | 347.99 | 30.4 |
| Total | 878.99 | 76.8 |
Table 5: Major crops.
Fertilizer, seeding rates and planting date
According to the survey results application of DAP and phosphorus fertilizers were not practiced in the study area. The results of the current study showed that the average seed rate for maize fields were 36 kg/ha with standard deviation of 6.5 and the results also showed that the seed rate for finger millet was 49 kg/ha with standard deviation of 18.8 while for tef the seed rate was 63 kg/ha with standard deviation of 18.8.
Almost all the fields in the watershed were planted with local varieties except few maize fields. According to interviews results with development agent at Arba-Amba ‘Kebele’ where the watershed is found five quintals of improved BH-540 were distributed in 2011-2012 cropping season but none of the farmers who bought the improved variety of maize were included in the monitoring activity of the current study. This might be because the monitoring fields were selected with random method of sampling and by chance these farmers may not be included in the survey. While for other dominant crops, tef and finger millet the whole fields monitored in 2011-2012 were planted with local varieties. Based on the field monitoring results the planting time for maize started on 4th week of May and extended up to the end of the 3rd week of June. For finger millet the planting date varies between 12 June and 29 June. While for teff the observed planting date was 10 July to 18 July.
Rainwater management practices
RWM practices significantly increased crop yield and thereby enhance water productivity. The field monitoring and farmers interview results indicate that the use of RWM rare practices exist in the cultivated lands of the sampled households in the study watershed. RWM practices implemented by the local farmers in the study watershed were mainly determined by the slope of the crop field and the existing soil type. The most common RWM practice used by the local farmers in the monitored millet and tef crop fields was surface drainage.
Watershed crop yield and water productivity
Land productivity/crop yield: The total area planted with Maize was 165.58 ha. The average crop cover at seedling stage was 79% with standard deviation of 4.2 and the crop cover at vegetative growth stage was 91% with standard deviation of 4.7. The watershed’s average biomass yield grain yield was 7.9 t/ha and 3.9 t/ha respectively. The area planted with finger millet in the Mizawa watershed was 365.42 ha. The survey indicated that the average crop cover at seedling stage was 63% with standard deviation of 12.6 and the crop cover at vegetative growth stage was 82% with standard deviation of 10.4. The watershed’s average biomass yield grain yield was 18.3/ha and 1.8 t/ha respectively. Crop fields planted with tef was around 348 hectare. The average crop cover at seedling stage was 77% with standard deviation of 13.0 and the crop cover at vegetative growth stage was 92% with standard deviation of 6.7. The watershed’s average biomass yield grain yield was around (Table 6).
| DF | DM | SR | CCS | CCD | GY | SBM | Total | |
|---|---|---|---|---|---|---|---|---|
| (kg/ha) | (%) | (%) | (tons/ha) | (tons/ha) | Yield | |||
| Maize | 90 | 158 | 36 | 79 | 91 | 3.9 | 7.96 | 11.86 |
| Finger Millet | 92 | 148 | 49 | 63 | 82 | 1.83 | 6.03 | 7.86 |
| Tef | 55 | 127 | 63 | 77 | 92 | 0.76 | 3.32 | 4.08 |
Table 6: Crop yield data.
Crop water requirement and water use: As extracted from the FAO cowat software, crop water use was within the range of 373 mm and 577 mm/season for maize; 295 mm and 319 mm/season for finger millet and 310 mm and 322 mm/season for tef. The average crop water requirements for maize, finger millet and tef were 586 mm, 368 mm, and 408 mm, respectively. The results of maize average crop water requirement agrees with Bekele et al. which is 500-800 mm but in the case of millet and teff it is different from the mentioned results.
Crop water uses were found to be appreciably lower than crop water requirement for all the crops under consideration in the current study in Mizawa watershed. It was 456, 317 and 304 for maize, finger millet and tef respectively. Evapotranspiration deficit range from 52 mm to 207 mm for maize; 6 mm to 97 mm for finger millet, and 78 mm to 110 mm for tef. These deficits are associated with low rainfall at the beginning for maize growth period and early cessation of rainfall for both the three major crops that grow in Mizawa watershed while the annual rainfall was 1032 mm and the effective rainfall was 623.1 mm (Table 7).
Crop water productivity status
This section describes the results of water use (actual water use) and the actual yield produced from the crop in the monitoring stations and their relation to each other. The crop water requirement (CWR); total rainfall i.e. from planting to harvesting (TRF); Total Effective Rainfall (TER); crop water use/actual crop Evapotranspiration (Eta); evapotranspiration deficit (ETd); productivity of water/rainfall (PWrf); productivity of effective rainfall (PWerf); Productivity of Water use/ Evapotranspiration (PWETa) will be discussed against or in relation to the Actual Crop Yield (ACY).
Crop water productivity results for each crop in every monitoring station for the 2011 cropping season which was expressed in kg/m3. According to the current study the crop water Productivity of rainfall (PWrf) of maize ranged from 0.011 kg/m3 in the first and the third monitoring station to 0.0.029 kg/m3 in the second monitoring station (Table 7). The crop water productivity of rainfall for finger millet varies from 0.008 kg/m3 in the second station to 0.047 kg/m3 in the third monitoring station in cropping season. The crop water productivity of rainfall for tef varied from 0.006 kg/m3 in the first and fourth monitoring station to 0.017 kg/m3 in the fifth monitoring station. Table 7 shows the average the crop water productivity of rainfall (PW(rf)) of maize, finger millet and tef which is 0.014 kg/m3, 0.008 kg/m3 and 0.006 kg/m3 in respectively. The crop water Productivity of Water use (PWETa) for maize varied from 0.026 kg/m3 in the first monitoring station to 0.031 kg/m3 in the fourth monitoring station in the 2011 cropping season. The crop water productivity of water use (PWeta) for finger millet varied from 0.010 kg/m3 in in the fifth monitoring station to 0.050 kg/m3 in the third monitoring station in the cropping season. And the crop water productivity of water use varied from 0.010 kg/m3 to 0.024 kg/m3 for tef which was observed in the third and the fifth monitoring stations.
| CROP | TRF | TER | CWR | ETA | ETD |
|---|---|---|---|---|---|
| Maize | 853.58 | 510.96 | 511.2 | 391.86 | 119.34 |
| Finger Millet | 925.3 | 483.48 | 374.52 | 316.26 | 58.26 |
| Tef | 737.44 | 420.2 | 403.54 | 313.32 | 90.22 |
Table 7: Average total rainfall (trf), effective rainfall (tef), crop water requirement (cwr), actual evapotranspiration (eta) and evapotranspiration deficit (ETD).
The trends showed very close similarities among monitoring sites and the crops (Figure 7). This implies that the circumstances that may induce the crops to attain peak WP in different monitoring sites were the same for all the crops (Table 8).
Figure 7: Maize total biomass yield and rainfall relations.
| CROP | ACY | PWRF | PWER | PWETA |
|---|---|---|---|---|
| Maize | 11.86 | 0.014 | 0.023 | 0.03 |
| Finger millet | 7.86 | 0.008 | 0.016 | 0.025 |
| Tef | 4.08 | 0.006 | 0.01 | 0.013 |
Table 8: Crop water productivity.
That means the torrential rain falls at these periods only generated runoff without beneficially used by the crops to increase yield or water use. So that high rainfall in July and August may not necessarily increase crop yield. But the Evapotranspiration (ET) deficit and actual crop yield showed visible relation in the monitoring sites of the three major crops in the study area. The relation was not strong in the finger millet (Figure 14).
Figure 8: Maize water productivity.
Figure 9: Finger millet total biomass yield and rainfall relations.
Figure 10: Finger millet water productivity.
Figure 11: Tef total Biomass Yield and Rainfall Relations.
Figure 12: Tef water productivity.
Figure 13: Rainfall Situation.
Figure 14: The relation between ET deficit and actual yield.
Conclusion
Estimating crop yields and ET to assess agricultural water productivity using different software received major development in terms of both methodology and applications over the past century. The crop yield, consumptive use of water and water productivity of the predominant crops maize, finger millet and tef, are determined by combining field monitoring data, data from local climate estimator (New LocClim), weather and field survey data. Generally the physical crop water productivity results by this study fall in the lower ranges of other studies. This might be because the in the monitoring sites fertilizer application and use of improved varieties was not practiced in the monitored sites. But the ET values were in the range of values given by other literature. The physical CWP values of maize were higher than those of finger millet and tef. The crops got deficit especially in the mid of the growing seasons which exists in large parts of the watershed, as well as excess water flooding as a result of high rainfall and low effective rainfall amount was observed in the development stages of the three crops under investigation showing management practices are the key to sustain high efficiency.
References
- Bhaskarachary K, Rao DSS, Deosthale YG, Reddy V (1995) Carotene content of some common and less familiar foods of plant origin. Food Chem 54: 189-193.
- Budi W, Anna AR, Noor I, Dedi R, Agung K (2015) Identification of fifty sweet potato ipomoea batatas (L.) Lam.) promising clones for bioethanol raw materials. Energy Procedia 65: 22-28.
- Burgos R, Carpio C, Sanchez S, Paola P, Eduardo J, et al. (2009) A colour chart to screen for high β-carotene in OFSP breeding. The 15th triennial symposium of the international society for tropical root crops (ISTRC), Lima. Chiona M (2009) Towards enhancement of b-carotene content of high dry mass sweet potato genotypes in Zambia. University of KwaZulu-Natal, Pietermaritzburg, South Africa, PhD Dissertation. 2009, pp. 47-52
- El-Sheikha AF, Ray RC (2017) Potential impacts of bioprocessing of sweet potato: Critical Review. Food Sci Nutr 57: 455-471.
Indexed at, Google Scholar, Crossref
- Engida T, Sastry EVD, Nigussie D (2006) Correlation and path analysis in sweet potato and their implications for clonal selection. J Agron 5: 391-395.
Indexed at, Google Scholar, Crossref
- Federer WT, Ragavarao D (1975) On augmented designs. Biometrics 31: 29-35.
- Federer WT (1956) Augmented designs. Hawain Planters Record 55: 191-207.
- Fekadu G, Shimelis H, Mark L (2015) The potential of orange-fleshed sweetpotato to prevent vitamin a deficiency in Africa. Int J Vitam Nutr Res 84: 65-78.
Indexed at, Google Scholar, Crossref
- Fekadu G, Shimelis H, Mark L (2018) Correlation and path-coefficient analyses of root yield and related traits among selected sweetpotato genotypes. South Afr J Plant Soil 35: 179-186.
- Fekadu G (2019) Sweetpotato research and development in Ethiopia: A comprehensive review. J Agricul Crop Res 7: 106-118.
- Hossain MD, Rabbani MG, Mollah MLR (2000) Genetic variability, correlation and path analysis of yield contributing characters in sweet potato (Ipomoea batatas Lam.). Pak J Scient Indu Res 43: 314-318.
- Kamalam P (1977) Quality evaluation in sweetpotato. J Root Crops 3: 59-61.
- Mwanga ROM, Yencho GC, Gibson R (2013) Methodology for inoculating sweetpotato virus disease of tip dieback, recovery and reversion in different clones. Plant Dis 97: 30-36.
Indexed at, Google Scholar, Crossref
- Ray RC, Edison S (2005) Microbial spoilage of sweetpotato roots in the tropics and control measures. J Mycopathol 43: 147-158.
- Vimala B, Sreekanthb A, Binua H, Wolfgang G (2009) Variability in 42 orange-fleshed sweet potato hybrids for tuber yield, carotene and dry matter content. Gene Conserve 40: 190-200.
- Vimala B, Hariprakash B (2011) Variability of morphological characters and dry matter content in the hybrid progenies of sweetpotato (Ipomoea batatas (L) Lam). Gene Conserves 10: 65-86.
- Vanaja T, Babu LC (2006) Variability in grain quality attributes of high yielding rice varieties (Oryzasativa L.) of diverse origin. J Trop Agricul 44: 61-63.
Citation: Garede N, Erkosa T (2022) Cropping pattern and crop-water productivity assessment in mizawa watershed, blue nile basin, north western ethiopia. Adv Crop Sci Tech 10: 517. DOI: 10.4172/2329-8863.1000517
Copyright: © 2022 Garede N, et al. This is an open-access article distributed under the terms of the Creative Commons Attribution License, which permits unrestricted use, distribution, and reproduction in any medium, provided the original author and source are credited.
Select your language of interest to view the total content in your interested language
Share This Article
Recommended Journals
Open Access Journals
Article Tools
Article Usage
- Total views: 3008
- [From(publication date): 0-2022 - Sep 29, 2025]
- Breakdown by view type
- HTML page views: 2545
- PDF downloads: 463