Critical Factors of Infection Wavy Curve Oscillation of COVID-19 and Future Predictions in Japan
Received: 26-Dec-2022 / Manuscript No. JIDT-22-84752 / Editor assigned: 29-Dec-2022 / PreQC No. JIDT-22-84752 (PQ) / Reviewed: 13-Jan-2023 / QC No. JIDT-22-84752 / Revised: 20-Jan-2023 / Manuscript No. JIDT-22-84752 (R) / Published Date: 27-Jan-2023 DOI: 10.4172/2332-0877.1000526
Abstract
A novel model based on the macromolecule diffusion theory predicted the oscillation of the number of coronavirus disease 2019 infections. In this model, the diffusion coefficient, which depends on population density, determines the wavy oscillation frequency. The recovery rate of infected individuals determines the wavy amplitude. These two factors are critical factors beyond which the value of the infection phase abruptly changes, such as the phase transition. Therefore, we must ensure that the values remain within the critical values of social and medical preventive measures. The number of new infections was expected to peak around the 200-day serial intervals.
Keywords: Infection wavy curve oscillation; Nonlinear kinetics; Diffusion coefficient; Recovery rate
About the Study
We recently reported a nonlinear mathematical model to explain the wavy oscillation curve [1]. The purpose was to determine the critical factors that affect the increase in the number of new infections, the threshold factor, and the dynamics of the explosion in the number of new infections, which we call phase transition [2-4]. In infection propagation, the diffusion process of a population is a rate-limiting step and depends on the population density. Importantly, this diffusion dependency on the population density yields nonlinearity of the infection kinetics that causes infectious wavy oscillation [5-9]. Nonlinearity causes oscillation of the infectious number. Unlike previous models, we set the “cluster”, which can detect contagious people. We have added the growth steps for this cluster.
Infection transmission models, such as the SEIR model, consist of three or four types of individuals: susceptible (S), exposed (E), Infectious (I), and Recovered (R). Our model consists of three types of populations: X (non-infectious), Z (infectious), and W (cluster). The presence of the cluster was based on the dispersal data of the infection. First, X can irreversibly be involved in the cluster X+W→W . Subsequently, Z leaves the cluster W→Z . Furthermore, Z is treated to recover to X:Z+P→X . In addition, the population interactions increased the infection risk: X+Z→X+Z and X+Z→2Z.


h1,h4, and h5 are proportional to the diffusion coefficients of populations X and Z. These are the basic equations. p indicates the recovery rate. We set a metapopulation model based on the kinetics by combining the above equation applicable to areas with daily transportation. In the Japanese Kansai area, local governments cooperated to prevent infectious propagation. Each person obeyed the guidelines for preventing infection, for example, wearing a mask, performed healthy hygiene practices, and other non-pharmaceutical interventions. Transmission during transportation was not considered in this study. The infection wavy oscillation was well simulated, and the peak in the number of infections increased by approximately 2.0 times at each infectious wave. In past infections, the predicted serial interval with wavy oscillation was approximately 200 days ± 10 days. Using the above simulation, we predicted the threshold of the recovery rate pc. When p<0, an infection explosion occurs however, when p-pc>0, an infection explosion is suppressed, and the infection number may exhibit a wavy oscillation. Notably, the following relation between and the wavy oscillation frequency f was:
  , where α and β are arbitrary coefficients. The simulation predicts that the wave amplitude nearly approaches a plateau after the wavy oscillation. Another simulation result showed that individual diffusion control was critical for the suppression of infection control.
There are two critical values of h1 for diffusion in Eq.(1): h1c and h'1c (h1c <h'1c ). At h1 >h1c no new wave of infection was observed. At h1 >h1ca wavy oscillation was observed, and the amplitude approached a plateau when h1 was near h1c. Thus, suppressing the diffusion of infected individuals is critical for infection control. The oscillating model of infection waves proposed here can clearly explain the importance of limiting population diffusion (indicated by h1) detecting cluster outbreaks, and securing medical resources (indicated by p) to recover infected individuals. The thresholds for the diffusion coefficient and recovery rate can be calculated by simulation; thus, it is possible to judge whether the current infection state will transition to a state in which infections increase or whether the number of infections will oscillate. In addition, the data that the peak value of the wavy oscillation of infected people number has increased by about double may be related to the primary and effective reproduction numbers, which are indicators of «contagiousness.» However, from the perspective of nonlinear dynamics, this doubling of the peak value requires further theoretical analysis.
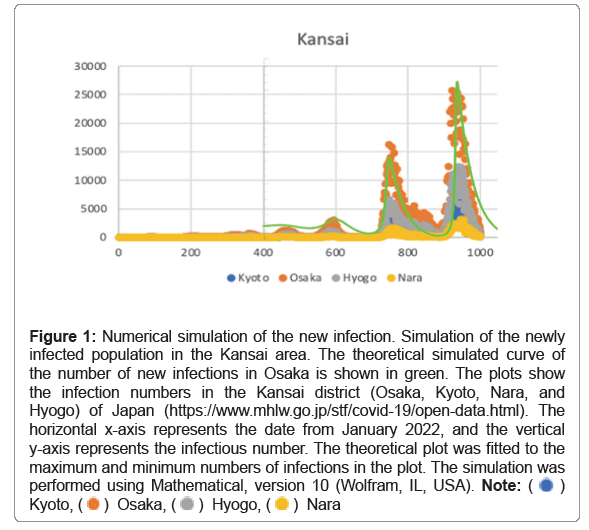
A plot of new infections in the Kansai area from January 16, 2022, and a simulated curve (green line) are shown in Figure 1. The cumulative number of infected people is expected to reach more than 25% of the Japanese population. The cumulative number of infected people exceeds 50% of the total population when the infection peaks the next time.
Figure 1: Numerical simulation of the new infection. Simulation of the newly infected population in the Kansai area. The theoretical simulated curve of the number of new infections in Osaka is shown in green. The plots show the infection numbers in the Kansai district (Osaka, Kyoto, Nara, and Hyogo) of Japan (https://www.mhlw.go.jp/stf/covid-19/open-data.html). The horizontal x-axis represents the date from January 2022, and the vertical y-axis represents the infectious number. The theoretical plot was fitted to the maximum and minimum numbers of infections in the plot. The simulation was performed using Mathematical, version 10 (Wolfram, IL, USA). 

Conclusion
Therefore, there is a possibility that herd immunity will be established by infecting almost the entire population at the next infection peak, and the infection may converge. However, as the flow of people recovers, the peak of infection accelerates, and it is expected that the peak of infection will occur earlier. In conclusion, the new infectious number model based on nonlinear diffusion kinetics can reasonably predict the infection number. This model may provide essential insights into similar transmissions in the future.
Conflict of Interest Statement
There is no conflict.
Funding
There are no conflicts of interest to declare.
Acknowledgments
This study was supported by the Tazuke Kofukai Kitano Medical Institute and Radiation Research Effects Foundation. The views of the author do not necessarily reflect those of the Radiation Effects Research Foundation or its funding agencies, the Ministry of Health, Labour, and Welfare of Japan, and the National Academies of Sciences, Engineering, and Medicine of the United States.
References
- Tsuruyama T (2022) Nonlinear model of infection wavy oscillation of COVID-19 in Japan based on diffusion kinetics. Sci Rep 12:19177.
[Crossref] [Google Scholar] [PubMed]
- Anderson RM, Grenfell BT, May RM (1984) Oscillatory fluctuations in the incidence of infectious disease and the impact of vaccination: Time series analysis. J Hyg (Lond) 93:587-608.
[Crossref] [Google Scholar] [PubMed]
- Wang F, Wang H, Xu K, Wu J, Jia X, 2013 IEEE 33rd International Conference on Distributed Computing Systems (ICDCS), IEEE Computer Society Digital Library, 2013:307-316.
- Wu J (2008) Spatial structure: Partial differential equations models. In: Brauer F, van den Driessche P, Wu J (eds) Mathematical Epidemiology. Lecture Notes in Mathematics. Springer, New York, USA, pp:191-203.
- Maged A, Ahmed A, Haridy S, Baker AW, Xie M (2022) SEIR Model to address the impact of face masks amid COVID-19 pandemic. Risk Anal 10:161-179.
[Crossref] [Google Scholar] [PubMed]
- Oosawa F, Asakura S (1975) Thermodynamics of the polymerization of protein. Massachusetts, Academic Press, USA.
- Gallagher WH, Woodward CK (1989) The concentration dependence of the diffusion coefficient for bovine pancreatic trypsin inhibitor: A dynamic light scattering study of a small protein. Biopolymers 28:2001-2024.
[Crossref] [Google Scholar] [PubMed]
- Tsuruyama T (2017) Kinetic stability analysis of protein assembly on the center manifold around the critical point. BMC Syst Biol 11:13.
[Crossref] [Google Scholar] [PubMed]
- Tsuruyama T (2014) A model of cell biological signaling predicts a phase transition of signaling and provides mathematical formulae. PLoS One 9:e102911.
[Crossref] [Google Scholar] [PubMed]
Citation: Tsuruyama T (2023) Critical Factors of Infection Wavy Curve Oscillation of COVID-19 and Future Predictions in Japan. J Infect Dis Ther 11: 526. DOI: 10.4172/2332-0877.1000526
Copyright: © 2023 Tsuruyama T. This is an open-access article distributed under the terms of the Creative Commons Attribution License, which permits unrestricted use, distribution, and reproduction in any medium, provided the original author and source are credited.
Share This Article
Recommended Journals
Open Access Journals
Article Tools
Article Usage
- Total views: 1531
- [From(publication date): 0-2023 - Mar 14, 2025]
- Breakdown by view type
- HTML page views: 1280
- PDF downloads: 251

