Cost-Effective Liquid Chromatographic Approach for Rapid Detection of Remdesivir in Pure Form and Pharmaceutical Formulations
Received: 03-Jan-2023 / Manuscript No. jabt-23-86967 / Editor assigned: 05-Jan-2023 / PreQC No. jabt-23-86967 / Reviewed: 19-Jan-2023 / QC No. jabt-23-86967 / Revised: 23-Jan-2023 / Manuscript No. jabt-23-86967 / Accepted Date: 29-Jan-2023 / Published Date: 30-Jan-2023 QI No. / jabt-23-86967
Abstract
The evaluation of Remdesivir in pure form and pharmaceutical dosage formulation has been established and verified using a simple, specific, and repeatable RP-HPLC approach. The estimation was accomplished by Thermo Scientific Hypersil BDS C18 column (150 x 4.6 mm) 5μ i.d. in gradient elution with a mobile phase made up of 10 mM ammonium acetate buffer (pH 3.5 by 2% glacial acetic acid) and acetonitrile, flowing at a rate of 1.0 mL/min. The analyte was measured at a wavelength of 245nm. Remdesivir’s linearity was found to be between 2 and 10 μg/mL, while its recovery was shown to be between 99.01 and 100.04%. The developed method was authenticated as per ICH guideline Q2R2.
Keywords
Remdesivir; RP-HPLC; Linear regression; Assay; Validation
Introduction
Gilead Sciences Biopharmaceutical initially created Remdesivir (RMV), an antiviral nucleotide analog, to treat the Ebola virus [1- 4]. RMV has recently been used to manage and treat coronavirus illness (COVID-19). It’s an infection with the CoV-2 coronavirus that triggers Severe Acute Respiratory Syndrome (SARS). RMV is a pro-drug analog of ATP that has been authorized for use in hospitals and possesses antiviral activity against COVID-19. Remdesivir’s chemical structure is shown in Figure 1 [1]. Due to the approval of RMV in emergency conditions during the pandemic, many cases have been reported for duplication, and substandard preparations of RMV injection have been noted. Therefore, it is necessary to develop a quick, precise, simple, and specific technique for identifying and quantifying RMV. The developed method should be capable of quantifying even minute levels to identify and differentiate between standard and sub-standard API and its formulations. The literature review examines various hyphenated analytical practices, including Liquid Chromatography-Mass Spectroscopy (LC-MS) and UHPLCESI (+)-MS/MS, for quantifying RMV in a formulation [6]. In 2016, a method for studying the pharmacokinetics of RMV in male rhesus monkeys without infection using LC-MS/MS [5]. In 2020, an analytical technique was created for LC-MS/MS by using methanol and zinc sulfate to determine RMV metabolites in human plasma by the quick protein precipitation method [3]. In 2020, a different investigation was conducted to measure the RMV in human plasma by LC-ESI (+)-MS/ MS hyphenated technique. One article reported HPLC method, but it lacked reproducibility, retention time was above 5 min, lacked peak spectral purity, and found interference with other peaks. According to a literature review, the LC-MS/MS and the UPLC-MS/MS procedures offer suitable analytical platforms to determine RMV. These techniques provide crucial analytical tools for the clinical treatment monitoring of RMV. The high cost of MS/MS hyphenated procedures makes them unaffordable for clinical laboratories. Due to the numerous benefits of MS detection, it might be expensive and challenging to use MSbased separation techniques in everyday practice. Chromatography is regarded as the greatest analytical method because of its fidelity, affordability, repeatability, human friendliness, efficiency, and selection. There have been attempts to create an HPLC method with a mobile phase that is LCMS compatible, has a short retention time, and is very sensitive. Until now, no consistent, sensitive, and robust technique has been available to determine RMV in base and pharmaceutical dosage forms. The current article aims to create a method that can quickly, precisely, and robustly estimate RMV in APIs with standard and non-standard formulations. The effectiveness and practicality of the suggested method were assessed with a focus on quality control research.

Figure 1: Structure of Remdesivir [1].
Experimental work
Types of equipment
Chromatographic analysis for RMV was performed on Agilent 1200 series liquid chromatography instrument equipped with a Double beam UV Spectrophotometric detector and binary pump module with Chem-station as and HPLC analytical software. This method also utilizes a pH meter (Picco pH meter), weighing balance (Shimadzu), and UV double beam spectrophotometric apparatus (UV1800 spectrophotometer Shimadzu, Japan) equipped with UV probe 2.7 software, Filtration assembly, and Double distillation assembly.
Chemicals and Reagents
Acetonitrile (ACN) (Rankem, HPLC grade), Glacial acetic acid (Rankem, AR grade), and ammonium acetate (Rankem, AR grade). A double distilled water prepared in the lab was used. RMV API and Pure Remadac injectable vial (100 mg/vial) were obtained from Zydus Cadila Healthcare, Ahmedabad, as a gift sample.
Wavelength determination for Remdesivir (λ)
30 μg/mL solution of RMV was prepared to determine the wavelength. The scan was performed in the range of 200-400 nm. A detection wavelength of 245nm was selected for further analysis of RMV. The scan for wavelength determination of RMV standard solution is depicted in.
HPLC chromatographic conditions
The mobile phase was prepared by combining 10mM ammonium acetate (pH 3.5) and acetonitrile solution, and a gradient programme was designed, as shown in Table 1. The pH 3.5, 10mM ammonium acetate buffer was prepared by dissolving about 0.77 g of ammonium acetate in 1000 mL of double-distilled water. The pH of 3.50±0.05 was adjusted by using 2% glacial acetic acid. Before use, the mobile phase was filtered through a 0.45 μm nylon membrane filter and sonicated for nearly 10 minutes to remove dissolved gas. An 80:20 mixture of buffer and ACN made up mobile phase A, whereas an 80:20 mixture of buffer and ACN made up mobile phase B.
| Time (min) | Mobile Phase A | Mobile Phase B |
|---|---|---|
| 0-2.5 | 35 | 65 |
| 2.5-4.5 | 20 | 80 |
| 7-10 | 35 | 65 |
Table 1: Gradient Elution pattern of mobile phase for RMV estimation.
i. Solution Preparations
• 2% glacial acetic acid
• 2 mL glacial acetic acid dissolved in 100 mL double distilled water.
ii. Diluent-1
• 100% mobile phase
Standard (STD) stock solution (200 μg/mL)
About 10 mg API was weighed and transferred carefully in a 50 mL volumetric flask. 1% of diluent-1 was added to the above 50 mL volumetric flask. The content mixture was sonicated with intermittent stirring to dissolve the content. The volume was made up to mark with ACN.
Working STD Solution (3 μg/mL)
Further dilution was made with diluent-1 from the standard stock solution to make 3 μg/mL of working STD solution.
Sample Solution Preparation for lyophilized powder
Remdac lyophilized powder was weighed equivalent to around 50 mg of RMV and transferred carefully into a 100 mL volumetric flask after being weighed. By adding 30% of the diluent-1 to the volumetric flask mentioned above, followed by 3 minutes of sonication and occasional shaking, the substance was made to dissolve. Once it reached room temperature, the substance was diluted to the appropriate level by diluent-1 (500 μg/mL). From the sample stock solution mentioned above, 0.6 mL of solution was precisely transferred in a 100 mL volumetric flask, and the solution was diluted with diluent-1 (3 μg/mL).
Analytical Method Validation
Specificity: The capability to differentiate amongst the analyte(s) and the other contents in the sample complex is known as the specificity of the analytical method. It is ensured for the HPLC method by fully separating the analyte peak from supplementary peaks originating from the sample medium. This method’s specificity was performed by injecting 3 μg/mL of Blank solution, Standard RMV solution, and Remdac sample solution, each of 20μL, respectively, into the chromatographic system.
Linearity: The standard stock solution of RMV was diluted with diluent-1 to produce a series of concentrations of RMV in the 2–10 μg/mL range. The least squares linear regression approach was applied to assess the calibration curve’s linearity, and the importance of linear regression was determined using the one-way ANOVA test.
Sensitivity: The Limit of Detection (LOD) and the Limit of
Quantitation (LOQ) of RMV were estimated by analyzing through a linear regression line equation for the determination of the method’s sensitivity.
Accuracy: Recovery studies for RMV using the traditional spike approach were used to evaluate the accuracy of the procedure. To produce solutions comprising each analyte at three different concentration levels, corresponding to 50%, 100%, and 150% of the target concentration, i.e., around 1.5, 3, and 4.5 μg/mL RMV, the calculated amount of reference substance for RMV was spiked into the samples. Triplicate samples were prepared and analyzed at each concentration level. The recovery percentage of added RMV with the RSD was integrated for every duplicate sample.
Precision: Current ICH criteria were used to validate the suggested approach in the context of system and method precision. Six measurements of a reference solution on the same day that contained each analyte at 100% of the fixed concentration were used to assess the system’s precision. These fixed concentrations were used for the method precision, repeatability, and intermediate precision. Three distinct concentrations were examined in triplicate measurements of the sample solution on a similar day and two separate days, respectively.
Robustness: By analyzing the impacts of purposefully making small modifications to the experimental settings, the robustness of the procedure was tested.
There were the following modifications made in this study:
(i) Flow rate: less than 0.02 mL/min
(ii) Mobile phase buffer has a pH of 0.02pH.
(iii) Wavelength shift: 2 nm
For every condition, a standard RMV solution and three sample solutions at about 100% of the target concentration were injected into the chromatographic apparatus. After three successive injections of the sample and standard solutions, the RSD of the peak area for the analyte was used to measure the technique’s robustness.
Analytical Solution Stability: Analysis of the standard and sample preparations from 0 to 96 hours at room temperature (25 °C) and 2-8 °C for a sample and standard preparation at 100% target concentration level was used to assess the stability of analytical solutions. The analytical solution stability was estimated based on fluctuation of the mean peak area and the analyte peak area RSD for each solution using duplicate injections each time.
Results and Discussion of The Analytical Method
Analytical method development and optimization
A literature search revealed details regarding the physiochemical characteristics and chromatographic behaviors of RMV. The development of the HPLC method made the selection of chromatographic parameters, including stationary phase, mobile phase, and wavelength for recording chromatograms of double beam UV-Vis spectrophotometric detector and preparation of sample technique. Initial tests were performed using a reversed-phase Thermo-scientific Hypersil BDS C18 column (150 x 4.6 mm) 5μ i.d. with different mobile phase compositions to optimize chromatographic conditions. Table 2 lists the outcomes of preliminary optimization. The final approach for performing routine analysis uses the improved chromatographic settings that are listed in Table 3.
| Sr. No. | Mobile Phase | Elution method | Observation | Result |
|---|---|---|---|---|
| 1 | Methanol - 10mM Potassium dihydrogen orthophosphate (50:50, v/v) | Isocratic | Elution strength was weak for RMV (retention time more than 12 min). | Rejected |
| 2 | Acetonitrile - 10mM Potassium dihydrogen orthophosphate (50:50, v/v) | Isocratic | Elution strength was weak for RMV (retention time more than 12 min). | Rejected |
| 3 | Acetonitrile - 10mM Potassium dihydrogen orthophosphate (80:20, v/v) | Isocratic | The retention time for RMV was around 6 min but failed peak purity (Interference with another peak). | Rejected |
| 4 | Acetonitrile - 10mM Ammonium Phosphate (80:20, v/v) | Isocratic | The retention time of about 6 min, with good peak symmetry, but failed peak purity (Interference with another peak). | Rejected |
| 5 | Acetonitrile - 10mM Ammonium Phosphate | Gradient | 4 min retention time, good peak symmetry with high intensity and spectrally pure peak. | Accepted |
Table 2: Optimization of HPLC conditions for Remdesivir estimation.
| Column | Thermo-scientific Hypersil BDS C18 column (150 × 4.6 mm) 5 µm i.d. |
|---|---|
| Mobile Phase | Buffer: 10mM ammonium acetate pH 3.5±0.05 and acetonitrile |
| Gradient Program | As mentioned in table 1 |
| Mobile phase flow rate | 1mL/min |
| Column oven temperature | 35±5˚C |
| Injection volume | 20µL |
| Run time | 10 min |
| RMV retention time | 4.00±0.05 |
| Wavelength (nm) | 245 nm |
Table 3: Optimized chromatographic condition for Remdesivir estimation.
Analytical Method Validation
Specificity
The chromatograms of the blank, standard RMV and Remdac sample solutions (equivalent to 3 μg/mL of RMV) were compared to evaluate specificity. For this, separate injections of blank, standard, and sample solutions into the HPLC apparatus were made. The overlay chromatogram result is displayed in. RMV was eluted at about 4.01 minutes under the (Table 4) chosen chromatographic conditions (Blank Solution- and Standard RMV solution). The peak purity graph shows no coeluting peaks at the retention period of RMV, suggesting that the principal analyte peak was not hampered. This result demonstrated the spectral purity of the analyte peak and supported the method’s specificity.
| Conc. (µg/mL) (n=6) | Avg. peak area (mAu.s) ± SD | RSD |
|---|---|---|
| 2 | 1930916.50 ± 16528.59 | 0.86 |
| 4 | 3764885.17 ± 31471.59 | 0.84 |
| 6 | 5314225.83 ± 29118.41 | 0.55 |
| 8 | 7146900.17 ± 45192.71 | 0.63 |
| 10 | 8992722.00 ± 59341.20 | 0.66 |
Table 4: Linearity and range of Remdesivir.
Linearity and Range
The capability of the technique to produce test conclusions is directly proportional to the concentration of the analyte in a definite range is known as the linearity of the designed analytical method. The overlay chromatogram for RMV standard in the concentration range from 2-10 μg/mL is displayed in. The calibration graph was plotted against the mean peak area and series of concentrations. The findings of the linearity investigation showed a linear relationship for RMV across the concentration array of 2–10 μg/mL.
The linear regression model statistically helps to determine the outcome variable (P <0.05) according to an ANOVA study for both analytes (as indicated in Table 5).
Sensitivity: limit of detection (LOD) and limit of quantification (LOQ)
| Model | df | SS (sum of squares) | MS (Mean Square) | F | Significance F |
|---|---|---|---|---|---|
| Regression | 1 | 3.06447E+13 | 3.06447E+13 | 3586.069476 | 1.0259E-05 |
| Residual | 3 | 25636447676 | 8545482559 | ||
| Total | 4 | 3.06703E+13 |
Table 5: Analysis of the ANOVA results for the Remdesivir calibration curve.
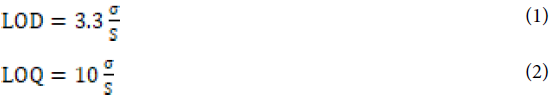
The lowest quantified quantity of analyte in a sample is known as the Limit of Quantification (LOQ). The lowest quantity of analyte in a sample matrix to be examined but not primarily be quantified is known as the limit of detection (LOD). RMV LOD and LOQ were theoretically computed through equations 1 and 2 below. The values of σ and s are depicted in Table 6. RMV’s theoretically predicted LOD and LOQ values were 0.35 and 1.06 μg/mL, respectively.
| R Square | 0.999 |
|---|---|
| Standard Error (σ) | 92441.78 |
| Observations | 5 |
| Intercept | 178242.13 |
| X variable (s) | 875281.30 |
Table 6: Regression statistics for LOD and LOQ.
Accuracy
The similarity of the findings produced by an analytical procedure to the actual value is known as accuracy. The recovery rate of the method appeared in the range of 99.09% to 100.04%, with an RSD of less than 2% (Table 7). These outcomes were discovered to be within the acceptable recovery range (98.0% to 102.0%).
| % Spiked Level | Replicate Number | Spiked amount | Area (mAu.s) | Amount Recovered | % Recovery | Mean (n=3) Recovery ± SD | RSD |
|---|---|---|---|---|---|---|---|
| 50 | 1 | 4.5 | 3721811 | 4.46 | 99.11 | 98.92 ± 0.32 | 0.32 |
| 2 | 4.5 | 3699768 | 4.43 | 98.55 | |||
| 3 | 4.5 | 3720873 | 4.46 | 99.09 | |||
| 100 | 1 | 6 | 5052482 | 5.98 | 99.69 | 99.35 ± 0.40 | 0.40 |
| 2 | 6 | 5039817 | 5.97 | 99.45 | |||
| 3 | 6 | 5011345 | 5.93 | 98.91 | |||
| 150 | 1 | 7.5 | 6382811 | 7.50 | 100.04 | 99.31 ± 0.69 | 0.69 |
| 2 | 7.5 | 6327954 | 7.44 | 99.20 | |||
| 3 | 7.5 | 6293457 | 7.40 | 98.68 |
Table 7: Accuracy of Remdesivir formulation (Remdac).
Precision
RSD values are used to establish the method’s precision. It is “the closeness of agreement amongst a set of measurements obtained from various sampling of the similar sample at a given particular circumstance”.
Precision of the system: The RSD values of the analyte peak’s area, as well as the performance of the chromatographic technique, are measured by HETP (Height Equivalent to Theoretical Plates) and tailing factor of the analyte peak, which were found to be less than 2.0%, as shown in Table 8. The analyte peak’s theoretical plate number was higher than 4000. Precision of the method: Tables 9, 10, and 11 correspondingly reveal that the RSD of the assay results of RMV in the repeatability and intermediate precision was less than 2.0%. So, according to system and method precision (RSD and analyte peak tailing factor, respectively, less than 2%, and the number of theoretical plates < 4000), the technique was accurate within the permissible limits.
| System Suitability Parameters | |||||
|---|---|---|---|---|---|
| parameters | values | %RSD | |||
| 1 | 2 | 3 | Mean (n=3) ± SD | ||
| Retention Time | 4.01 | 3.97 | 3.99 | 3.99 ± 0.02 | 0.50 |
| Theoretical plates | 122021 | 123898 | 124541 | 123486.67 ± 1309.39 | 1.06 |
| Tailing Factor | 1.12 | 1.13 | 1.12 | 1.12 ± 0.01 | 0.51 |
Table 8: System suitability Parameters for Remdesivir.
| Replicates | Area (mAu.s) |
|---|---|
| 1 | 2489011 |
| 2 | 2491011 |
| 3 | 2495477 |
| 4 | 2480199 |
| 5 | 2480991 |
| 6 | 2461567 |
| Mean ± SD | 2483042.67 ± 12060.08 |
| RSD | 0.49 |
Table 9: Repeatability of Remdesivir formulation (Remdac).
| Intraday Precision | ||
|---|---|---|
| Conc. (µg/mL) | Mean Area mAu.s ± SD (n=3) | RSD |
| 3 | 2460642.00 ± 29018.99 | 1.18 |
| 6 | 5242722.00 ± 31137.92 | 0.59 |
| 8 | 7168873.33 ± 52138.76 | 0.73 |
Table 10: Intraday Precision of Remdesivir formulation (Remdac).
| Interday Precision | ||
|---|---|---|
| Conc. (µg/mL) | Mean Area mAu.s ± SD (n=3) | RSD |
| 3 | 2460642.00 ± 29018.99 | 1.18 |
| 6 | 5263726.33 ± 40785.14 | 0.77 |
| 8 | 7192826.67 ± 75704.65 | 1.05 |
Table 11: Interday Precision of Remdesivir formulation (Remdac).
Robustness
The analytical method’s robustness was determined by estimating the impact of purposefully changing slight HPLC parameters on the system suitability criteria of the suggested method, as shown in Table 2. The robustness testing results, summarized in Table 12, revealed that minor variations to the method’s parameters, including wavelength, flow rate, and buffer pH of the mobile phase, were robust within the permitted ranges (RSD less than 2.0%). In all minor changes, a symmetric peak was seen with the lowest RSD values of peak area determined based on the duplicate injections of standard solution and the analyte assay results determined from sample solutions.
| Factor | Level Change | Mean area mAu.s (n=3) | RSD |
|---|---|---|---|
| pH | 4.45 | 2484147.00 ± 17211.11 | 0.69 |
| 4.5 | 2473975.33 ± 13795.48 | 0.56 | |
| 4.55 | 2472811.00 ± 20219.28 | 0.82 | |
| Flow rate | 0.98 | 2458979.00 ± 18496.45 | 0.75 |
| 1.00 | 2473975.33 ± 13795.48 | 0.56 | |
| 1.02 | 2496210.67 ± 12429.60 | 0.50 | |
| Wavelength | 242 | 2476113.33 ± 3920.01 | 0.16 |
| 245 | 2473975.33 ± 13795.48 | 0.56 | |
| 247 | 2481012.67 ± 2119.62 | 0.09 |
Table 12: Robustness of Remdesivir formulation (Remdac).
Solution Stability
The percentage recovery for RMV solutions for standard and sample solutions was reported between 98.0% to 102.0%, and RSD was less than 2%. As shown in Table 13, the solution stability research findings show that sample and standard solutions are stable at 2 to 8 ˚C for 36 to 48 hours compared to room temperature. These findings demonstrated that the analyte was reliable for the method’s intended use and stable in both sample and reference solutions.
| Studies | Time and Condition | Avg. Peak area (mAu.s) (n=2) | RSD | Recovery (%) |
|---|---|---|---|---|
| Standard Solution | 0h | 2480012.50 | 0.51 | 100.00 |
| 24 h (RT) | 2447051.00 | 0.04 | 98.76 | |
| 24 h (2-8˚C) | 2467272.00 | 0.11 | 99.49 | |
| 36 h (RT) | 2444843.50 | 0.29 | 98.58 | |
| 36 h (2-8˚C) | 2473966.00 | 0.01 | 99.76 | |
| 72 h (RT) | 2428898.00 | 0.06 | 97.94 | |
| 72 h (2-8˚C) | 2427981.00 | 0.11 | 97.90 | |
| Sample Solution | 0h | 2464326.50 | 0.32 | 100.00 |
| 24 h (RT) | 2455931.00 | 0.18 | 99.03 | |
| 24 h (2-8˚C) | 2448998.00 | 0.08 | 99.38 | |
| 36 h (RT) | 2438880.00 | 0.04 | 98.34 | |
| 36 h (2-8˚C) | 2439147.00 | 0.04 | 98.98 | |
| 72 h (RT) | 2428209.00 | 0.03 | 97.91 | |
| 72 h (2-8˚C) | 2420608.00 | 0.04 | 98.23 |
Table 13: Solution Stability of Remdesivir in standard and sample.
Assay
Remdac (Lyophilized vial)
2 vials of Remdac lyophilized powder were carefully transferred and weighed equivalently to 50 mg. The lyophilized powder was then reconstituted with 20 mL WFI and transferred carefully in a 100 mL volumetric flask. After attaining room temperature, the content was diluted up to mark with diluent-1 (500 μg/mL). The sample stock solution of 0.6 ml was accurately transferred to a 100 ml volumetric flask. The content was dissolved, and the solution was made up to mark with diluent-1 (3 μg/mL).
The assay results are summarized in Table 14.
| Set (n=6) Area (mAu.s) | Drug Recovered | % Assay | Avg Drug Recovered ± SD | RSD |
|---|---|---|---|---|
| 2458781 | 3.02 | 100.52 | 3.00 ± 0.04 | 1.18 |
| 2469872 | 3.03 | 100.94 | ||
| 2422346 | 2.97 | 99.13 | ||
| 2495733 | 3.06 | 101.93 | ||
| 2419982 | 2.97 | 99.04 | ||
| 2425375 | 2.98 | 99.25 |
Table 14: Assay of Remdesivir sample (Remdac Lyophilazied).
Remdac (Ready to use vial)
2 vials of Remdac Ready-to-use vials were pipetted equivalently to 50 mg and transferred carefully in a 100 mL volumetric flask. The solution was mixed with 30% of diluent-1 in the above volumetric flask, followed by sonication of about 3 minutes with intermittent shaking. After attaining room temperature, the content was diluted up to mark with diluent-1 (500 μg/mL). The sample stock solution of 0.6 ml was accurately transferred to a 100 ml volumetric flask. The content was dissolved, and the solution was made up to mark with diluent-1 (3 μg/ mL).
The assay results are summarized in Table 15.
| Set (n=6) Area (mAu.s) | Drug Recovered | % Assay | Avg Drug Recovered ± SD | RSD |
|---|---|---|---|---|
| 2428817 | 2.98 | 99.38 | 2.97 ± 0.02 | 0.57 |
| 2399278 | 2.95 | 98.25 | ||
| 2413246 | 2.96 | 98.79 | ||
| 2419753 | 2.97 | 99.03 | ||
| 2442980 | 3.00 | 99.92 | ||
| 2413574 | 2.96 | 98.80 |
Table 15: Assay of Remdesivir sample (Remdac Ready to use vial).
Conclusion
This work devised a simple, accurate, efficient, and reliable HPLC technique for estimating RMV in lyophilized powder and ready-to-use vials. According to ICH guideline Q2R1, the approach was verified and found appropriate for the intended use.
References
- Pardo J, Shukla AM, Chamarthi G, Gupte A (2020) The journey of remdesivir: from Ebola to COVID-19. Drugs in context 9.
- Santoro MG, Carafoli E (2021) Remdesivir: from Ebola to COVID-19. Biochemical and Biophysical Research Communications 538: 145-150.
- Eastman RT, Roth JS, Brimacombe KR, Simeonov A, Shen M, et al. (2020) Remdesivir: a review of its discovery and development leading to emergency use authorization for treatment of COVID-19. ACS central Science 6:672-683.
- Frediansyah A, Nainu F, Dhama K, Mudatsir M, Harapan H, et al. (2021) Remdesivir and its antiviral activity against COVID-19: A systematic review. Clinical epidemiology and global health 9: 123-127.
- Eastman RT, Roth JS, Brimacombe KR, Simeonov A, Shen M, et al. (2020) Remdesivir: a review of its discovery and development leading to emergency use authorization for treatment of COVID-19. ACS central Science 6:672-683.
- Warren TK, Jordan R, Lo MK, Ray AS, Mackman RL, et al. (2016) Therapeutic efficacy of the small molecule GS-5734 against Ebola virus in rhesus monkeys. Nature 53: 381-385.
Indexed at, Google Scholar, Crossref
Indexed at, Google Scholar, Crossref
Indexed at, Google Scholar, Crossref
Indexed at, Google Scholar, Crossref
Indexed at, Google Scholar, Crossref
Citation: Chokshi P (2023) Cost-Effective Liquid Chromatographic Approach for Rapid Detection of Remdesivir in Pure Form and Pharmaceutical Formulations. J Anal Bioanal Tech 14: 496.
Copyright: © 2023 Chokshi P. This is an open-access article distributed under the terms of the Creative Commons Attribution License, which permits unrestricted use, distribution, and reproduction in any medium, provided the original author and source are credited.
Share This Article
Open Access Journals
Article Usage
- Total views: 943
- [From(publication date): 0-2023 - Oct 20, 2024]
- Breakdown by view type
- HTML page views: 767
- PDF downloads: 176