Research Article Open Access
Corrosion Protection of Stainless Steel by Organic Inhibitors in Phosphate Industries in 15% H2SO4
Singh RK* and Kumar R
Department of Chemistry, Jagdam College, J P University, Chapra, India
- *Corresponding Author:
- Singh RK
Department of Chemistry
Jagdam College
J P University, Chapra, India
Tel: 06152-232407
E-mail: rks_jpujc@yahoo.co.in
Received Date: September 09, 2014; Accepted Date: September 29, 2014; Published Date: October 10, 2014
Citation: Singh RK, Kumar R (2014) Corrosion Protection of Stainless Steel by Organic Inhibitors in Phosphate Industries in 15% H2SO4. J Powder Metall Min 3:124. doi: 10.4172/2168-9806.1000124
Copyright: © 2014 Singh RK, et al. This is an open-access article distributed under the terms of the Creative Commons Attribution License, which permits unrestricted use, distribution, and reproduction in any medium, provided the original author and source are credited.
Visit for more related articles at Journal of Powder Metallurgy & Mining
Abstract
Phosphate industries use sulphuric acid during the manufacturing of fertilizers. This acid interacts with stainless steel to develop corrosion cell and it corrodes metal. Organic inhibitors 2-(aminomethyl) phenol and 2-(aminomethyl) benzenethiol were taken for corrosion control in 15% H2SO4 medium. Inhibitors anticorrosive effect studied at different temperatures and 10 mM concentration. The corrosion rate of metal absence and presence of inhibitors were determined gravimetric methods. The corrosion current density and inhibitors polarization effect was studied by potentiostat. Inhibitors’ corrosion protection activities like physisorption-chemisorption adsorption, thermal stability and surface films formation analysis can be done by activation energy, heat of adsorption, free energy, enthalpy and entropy. The experimental results of inhibitors surface coverage area and inhibition efficiency were exhibited strong bonding between inhibitors and base metal.
Keywords
Stainless steel; H2SO4; Inhibitors; Potentiostat; Surface adsorption
Introduction
Stainless steel is a very important metal for phosphate industry whereas H2SO4 produces hostile environment for surrounding material and it produces several forms of corrosion like galvanic, pitting, crevice, stress, intergranular embrittlment and blistering. Scientists and researchers were used different techniques for corrosion mitigation of materials like organic and inorganic coatings, use organic and inorganic inhibitors, composite materials coating, nanocoating and plasma coatings. Inorganic nanocoating of aluminum phosphate [1], zinc phosphate [2] and magnesium phosphate [3] in presence of DLC (diamond like carbon) filler were used as nanocoating materials in high temperature and acidic environment. Aliphatic and aromatic compounds [3-5] containing amino, hydroxyl and thiol functional groups were applied as corrosion protector in acidic medium. Polymeric coating [6-8] saved material for corrosion but this coating did not produce good results in long duration. Mixed types of organic inhibitors having cathodic [9-11] and anodic [12-15] polarization power used as an inhibitor in acidic condition. Plasma coating [16,17] provided corrosion resistance of metal at high temperature and strong acidic medium. Natural products [18,19] used as inhibitor which is ecofriendly with environment and these products has good inhibition properties.
Experimentals
Stainless steel (5×3×0.01) square meter size of coupons made for experimental work. Its surface was sharpened with emery paper and samples were washed with double distilled water. Finally it was rinsed with acetone and dried with air dryer and kept into desiccator. Inhibition effect of 2-(aminomethyl)phenol and 2-(aminomethyl) benzenethiol were studied at 50°C, 60°C and 70°C temperatures and 10mM concentration. The corrosion rate was calculated absence and presence of inhibitors by gravimetric method. Stainless steel (316) was used for this and its chemical composition analyzed in Bokaro Steel Plant Jharkhand, India.
The corrosion current and corrosion potential was determined with potentiostatic polarization by using an EG & G Princeton Applied Research Model 173 Potentiostat. A platinum electrode was used as an auxiliary electrode and a calomel electrode was used as reference electrode with stainless steel coupons.

Results and Discussion
The corrosion rates of stainless steel was calculated at 50°C, 60°C and 70°C temperatures and 10 mM concentration of inhibitors by equation 1 in presence of 15% H2SO4 solution absence and presence of inhibitors 2-(aminomethyl)phenol and 2-(aminomethyl) benzenethiol
K (mmpy) = 13.56 W / D A t (1)
Where W = weight loss of test coupon expressed in kg, A = Area of test coupon in square meter, D = Density of the material in kg/m3.
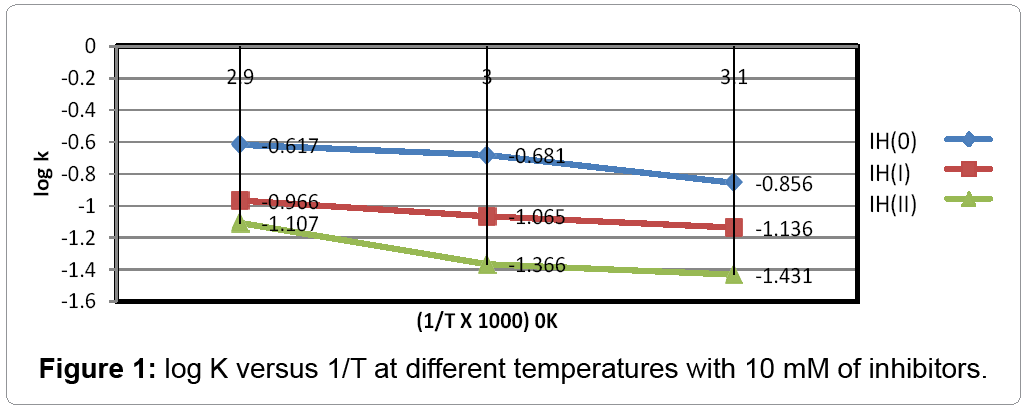
The corrosion rates of stainless steel without and with inhibitors mentioned in Table 1. The result of Table noticed that corrosion rate of metal is increasing without inhibitors and its values are decreasing with inhibitor as above recorded temperatures and concentration. The graph between log K versus 1/T was looked in Figure 1 shown that the rate of corrosion enhanced at lower temperature to higher temperature and its values suppressed after addition of inhibitors.
| Inhibitors | Temperature | 50°C | 60°C | 70°C | C (mM) |
|---|---|---|---|---|---|
| IH(0) | Ko | 0.139 | 0.208 | 0.241 | 0 |
| log Ko | -0.856 | -0.681 | -0.617 | ||
| IH(I) | K | 0.073 | 0.086 | 0.108 | 10mM |
| logK | -1.136 | -1.065 | -0.966 | ||
| θ | 0.474 | 0.586 | 0.551 | ||
| log(θ/1- θ) | 0.046 | 0.15 | 0.088 | ||
| IE (%) | 47.4 | 58.6 | 55.1 | ||
| IH(II) | K | 0.037 | 0.043 | 0.078 | 10mM |
| logK | -1.431 | -1.366 | -1.107 | ||
| θ | 0.733 | 0.793 | 0.676 | ||
| log(θ/1- θ) | 0.317 | 0.583 | 0.438 | ||
| IE (%) | 73.3 | 79.3 | 67.8 |
Table 1: The Corrosion of stainless steel in 15% H2SO4 at different temperatures and 10 mM concentration of inhibitors.
The percentage inhibition efficiency and surface coverage area of inhibitors were determined using 2 and equation3.
IE (%) = (1- K / Ko) 100 (2)
Where Ko is the corrosion rate without coating, K = corrosion rate with coating.
θ = (1 – K / Ko) (3)
where θ = Surface coverage area, Ko = corrosion rate without coating, K = corrosion rate with coating,
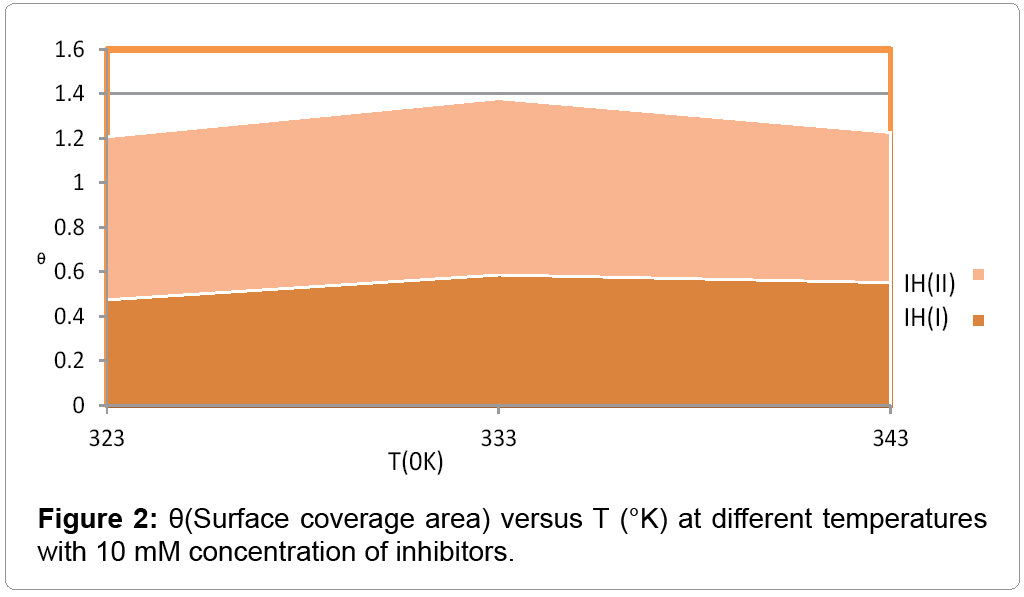
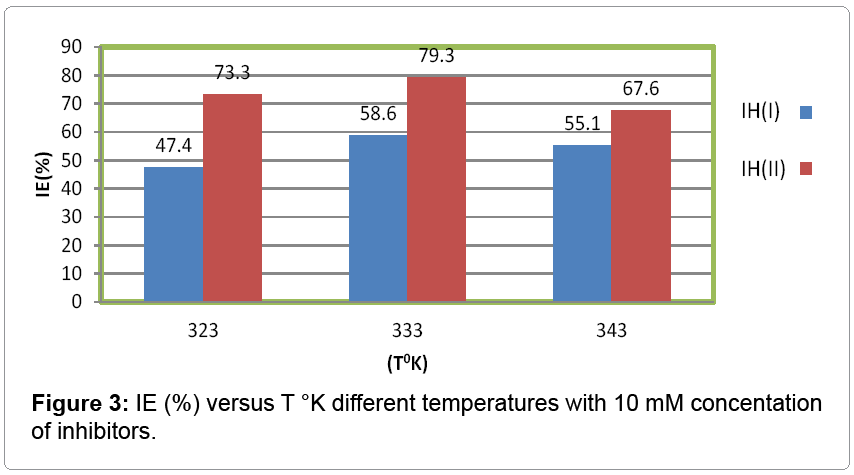
The percentage inhibition efficiency and surface coverage area values recorded in Table 1 at different temperatures and 10 mM concentration of inhibitors. It depicted that these values were increased with both inhibitors but good results observed with (2-aminomethyl) benzenethiol. The surface coverage area (θ) versus temperatures (T) for both inhibitors plotted in Figure 2. It found that 2-(amino-methyl) benzenethiol occupied more surface area than that of 2-(aminomethyl) phenol. Inhibition efficiency (IE) of both inhibitors versus temperature (T) was represented in Figure 3. This graph indicated that second inhibitor had more inhibition efficiency than that of first.
The activation energy of inhibitors was determined by equation 4 and Figure 1 and its values were recorded in Table 2. Activation energy increased without inhibitors and its values decreased with inhibitors.
| Inhibitor | Thermodynamical | 50°C | 60°C | 70°C |
|---|---|---|---|---|
| IH((0) | Ea(o) | 51.24 | 49.41 | 34.22 |
| IH(I) | Ea | 67.36 | 61.12 | 53.59 |
| Qads | -2.72 | -8.61 | -4.88 | |
| ΔG | -22.87 | -26.22 | -30.83 | |
| ΔH | -96.54 | -88.53 | -79.27 | |
| ΔS | -38.51 | -38.25 | -37.96 | |
| IH(II) | Ea | 83.67 | 78.39 | 61.41 |
| Qads | -18.79 | -33.45 | -24.99 | |
| ΔG | -5.37 | -8.94 | -22.99 | |
| ΔH | -111.04 | -105.8 | -87.11 | |
| ΔS | -37.55 | -38.24 | -37.96 |
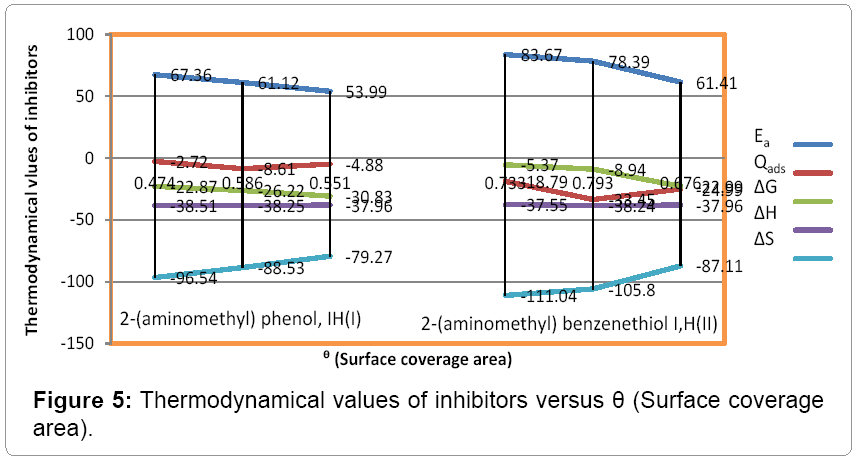
Table 2: Thermodynamical values inhibitors at different temperatures and 10 mM concentration.
These results were shown that inhibitors adhered with surface of base metal.
d /dt (logK) = Ea / R T2 (4)
where T is temperature in Kelvin and Ea is the activation energy of the reaction.
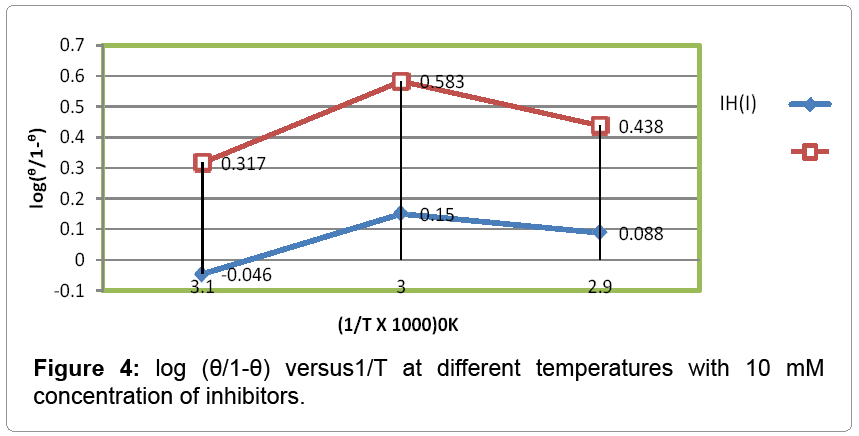
The heat of adsorption was calculated with help equation 5 and their values were mentioned in Table 2. The graph plotted between log (θ/1- θ) vs. 1/T was shown straight line in Figure 4 and its negative values indicated that inhibitors bind with metal by physical forces.
log (θ/1-θ) = log (A .C) - (Qads. / R T) (5)
where T is temperature in Kelvin and Qads heat of adsorption
Free energy was determined by equation 6 and its values were recorded in Table 3. Its values mentioned in Table 2 depicted that after addition of inhibitor exothermic reaction occurred.
ΔG = -2.303RT [log C - log (θ/1-θ) + 1.72] (6)
| Inhibitors | ΔE | ΔI | βa | βc | Icorr.cur(mA) | K(mmpy) | C(mM) |
|---|---|---|---|---|---|---|---|
| IH(0) | -725 | 72 | 111 | 63 | 2.14 | 0.561 | 0 |
| IH(I) | -674 | 64 | 68 | 94 | 1.45 | 0.435 | 10 |
| IH(II) | -521 | 51 | 44 | 75 | 1.01 | 0.305 | 10 |
Table 3: Potentiostatic Polarization values of stainless steel with inhibitors at 10 mM concentration.
The energy of enthalpy and entropy were calculated by transition state equation 7 and it values were recorded in Table 2. These values noticed that inhibitors were produced an exothermic reaction and they bonded with metal chemical adsorption. Thermodynamical values of Ea, Qads. , ΔG, ΔH and ΔS versus surface coverage area (θ) plotted in Figure 5 indicated that inhibitors adsorbed with metal by physisorptionchemisorption.
K = R T / N h log (ΔS# / R) X log (-ΔH #/ R T) (7)
where N is Avogadro’s constant, h is Planck’s constant, ΔS# is the change of entropy activation and ΔH# is the change of enthalpy activation.
The corrosion current density is determined in the absence and presence of inhibitors the help of equation 8 and their values are recorded in Table 3.
ΔE/ΔI = βa βc / 2.303 Icorr (βa + βc) (8)
where ΔE/ΔI is the slope which linear polarization resistance (Rp), βa and βc are anodic and cathodic Tafel slope respectively and Icorr is the corrosion current density in mA/cm2.
The metal penetration rate (mmpy) was calculated by equation 9 in absence and presence of inhibitors.
C.R (mmpy) = 0.1288 Icorr (mA/cm2) × Eq .Wt (g)/ρ (g/cm3) (9)
where Icorr is the corrosion current density ρ is specimen density and Eq.Wt is specimen equivalent weight.
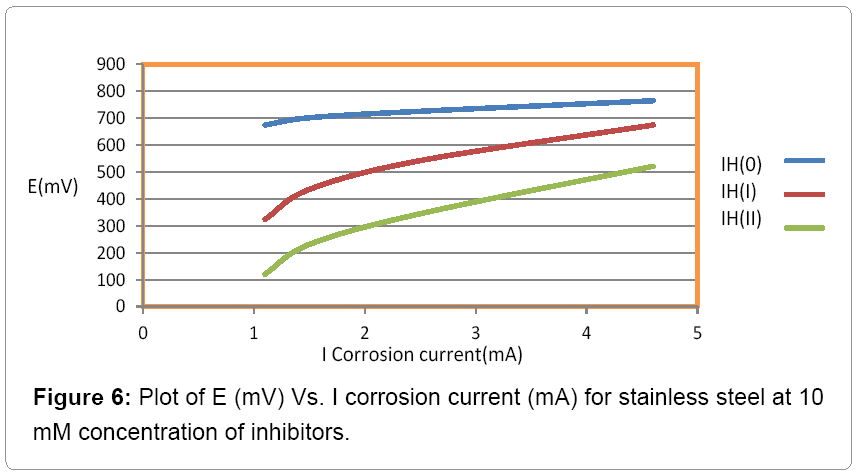
The observation of the results of Table 3, it was noticed that corrosion current increased without inhibitors and it reduced after addition of inhibitors. Figure 6 indicated that Tafel graph has plotted between electrode potential and corrosion current density in the absence and presence of inhibitors and this figure was shown that anodic potential, corrosion current density and corrosion rate increased without inhibitors but after addition of inhibitors these values decreased and inhibition efficiency increased.
Conclusion
Observation of results of inhibitors 2-(aminomethyl) phenol and 2-(aminomethyl) benzenethiol indicated that inhibition efficiency and surface coverage area at different temperatures in H2SO4 medium produced corrosion resistance effect for stainless steel. The inhibitors adhered with metal surface by physisorption-chemisorption adsorption. This adsorption phenomenon confirmed by activation energy, heat of adsorption, free energy, enthalpy and entropy. Potentiostat results for both inhibitors indicated that these inhibitors produced high polarization current and nullify the attack of H+ ions.
Acknowledgements
I am thankful to UGC, New Delhi for providing me financial support. I am also thankful to the department of chemistry, Ranchi University, Ranchi and the department of applied Chemistry Indian school of Mines, Dhanbad for providing laboratory facilities.
References
- Singh RK,Sanjoy M (2013) Corrosion protection of mild steel in SO2 environment by nanocoating with filler. J Metall MaterSci55: 227-234.
- Singh RK,Sanjoy M (2013) Corrosion protection of stainless steel in CO2environment by nanocoating of Zinc phosphate with DLC filler. JMetallMater Sci 55: 149-156.
- Singh RK,Sanjoy M (2013) Corrosion protection of rebar steel in marine atmosphere by nanocoating. J MetallMater Sci55: 313-321.
- Rojas PN,Rodil SE (2012) Corrosion Behaviour of Amorphous Niobium Oxide Coatings.IntJElectrochemSci7: 1443-1458.
- Giordano EJ, Alonso-Falleriros N, Ferreira I, Balancin O (2010) Electrochemical behaviour of two austenitic stainless steel biomaterials. Rem-RevistaEscola DeMinas 63: 159-166.
- Ramirez G, Rodil SE, Muhl S, Turcio-Ortega, Olaya JJ,et al. (2010) Amorphous niobium oxide thin films. J Non-Crystalline Solids 356: 2714-2721.
- Malik MA, Kulesza PJ,Pawlowska (2009) Surface analysis with scanning electrochemical microscopy in the feedback mode: Monitoring of reactivity and pitting precursor sites on the Nd–Fe–B-type magnetElectrochimicaActa 54: 5537-5543.
- Virtanen S, Milosev I, Gomez-Barrena E, Trebse R, Salo J, et al. (2008) Special modes of corrosion under physiological and simulated physiological conditions. ActaBiomaterialia 4: 468-476.
- Balamurugan A, Rajeswari S, Balossier G, Rebelo AHS, Ferreira JMF (2008)Corrosion aspects of metallic implants. Mater Corrosion/ Werkstoffeund Korrosion 59: 855-869.
- Tutunaru B, Patru A (2007) J OptoelectronAdv M 9: 9.
- Fenker M, Balzer M, Kappl H, Banakh O (2005) Some properties of (Ti,Mg)N thin films deposited by reactive dc magnetron sputtering. Surface & Coating Technology 200: 227-231.
- Yeh JM, Chen CL, Chen YC, Ma CY, Lee KR, et al. (2002) Enhancement of corrosion protection effect of poly (o-ethoxyaniline) via the formation of poly(o-ethoxyaniline)–clay nanocomposite materials. Polymer 43: 2729-2736.
- Erler F, Jakob C, Romanus H, Spiess L, Wielage B, et al. (2003) Interface behaviour in nickel composite coatings with nano-particles of oxidic ceramic. ElectrochemicaActa 48: 3063-3070.
- Ruhi G,Modi OP, Singh IB, Jha AK, Yegneswaran AH (2006) Wear and electrochemical characterization of sol-gel alumina coating on chemically pre-treated mild steel substrate. Surface and Coating Technol 201: 1866-1872.
- Shen GX, Chen YC, Lin CJ (2005) Corrosion protection of 316 L stainless steel by a TiO2 nanoparticle coating prepared by sol–gel method. Thin Solid Films 489: 130-136.
- Karunagaran B, Uthira Kumar P, Chung, SJ, Velumani S, Suh EK (2007)TiO2 thin film gas sensor for monitoring ammonia. Materials Characterization 58: 680-684.
- Yang WJ, Choa YH, Sekino T, Shim KB, Niihara K, et al. (2003)Thermal stability evaluation of diamond-like nanocomposite coatings. Thin Solid Films434: 65-74.
- Kim SH, Aust KT, Erb U, Gonzales F, Palumbo G (2003)A comparison of the corrosion behaviour of polycrystalline and nanocrystalline cobalt. Scripta Material 48: 1379-1384.
- Liu C, Leyland A, Bi Q, Matthews A (2003)An electrochemical impedance spectroscopy study of the corrosion behaviour of PVD coated steels in 0.5 N NaCl aqueous solution: Part I.: Establishment of equivalent circuits for EIS data modelling. Corrosion Sci 45: 1243-1256.
Relevant Topics
- Additive Manufacturing
- Coal Mining
- Colloid Chemistry
- Composite Materials Fabrication
- Compressive Strength
- Extractive Metallurgy
- Fracture Toughness
- Geological Materials
- Hydrometallurgy
- Industrial Engineering
- Materials Chemistry
- Materials Processing and Manufacturing
- Metal Casting Technology
- Metallic Materials
- Metallurgical Engineering
- Metallurgy
- Mineral Processing
- Nanomaterial
- Resource Extraction
- Rock Mechanics
- Surface Mining
Recommended Journals
Article Tools
Article Usage
- Total views: 15708
- [From(publication date):
December-2014 - Dec 19, 2024] - Breakdown by view type
- HTML page views : 11234
- PDF downloads : 4474
