Research Article Open Access
Correlation of Spatial Variability of Soil Macronutrients with Crop Performance by Using Satellite and Remote Sensing Indices for Site Specific Agriculture: Chakwal Region
Muhammad Zeeshan*, Muhammad Tariq Siddique, Nosheen Arab Ali and Muhammad Shakir FarooqDepartment of soil science and SWC, PMAS-Arid Agriculture University Rawalpindi
- *Corresponding Author:
- Muhammad Zeeshan
Department of soil science and SWC
PMAS-Arid Agriculture University Rawalpindi, Pakistan
Tel: +923076907121
Email: Mohammad.zeeshan95@yahoo.com
Received date: 04 February, 2017; Accepted date: 20 April, 2017; Published date: 29 April, 2017
Citation: Zeeshan M, Siddique MT, Ali NA, Farooq MS (2017) Correlation of Spatial Variability of Soil Macronutrients with Crop Performance by Using Satellite and Remote Sensing Indices for Site Specific Agriculture: Chakwal Region. J Rice Res 5:182. doi: 10.4172/2375-4338.1000182
Copyright: © 2017 Zeeshan M, et al. This is an open-access article distributed under the terms of the Creative Commons Attribution License, which permits unrestricted use, distribution, and reproduction in any medium, provided the original author and source are credited.
Visit for more related articles at Rice Research: Open Access
Abstract
Site-specific agriculture includes the application of soil on variable areas rather than the whole field and requires the knowledge of spatial variability of soil nutrients in the area. A survey was conducted to find out the spatial variation of soil macronutrient, to prepare the soil fertility maps and to correlate soil nutrients with NDVI values, at University Research Farm, Koont, Chakwal. Soil samples were collected and analyzed for soil macronutrient (NO3- N, P, K, SO4-S and CaCO3) concentration through standard procedures. Obtained data were analyzed by using GIS and ordinary statistics to predict the spatial variability and preparation of digital maps of the soil macronutrients. NDVI values were calculated by acquiring the cloud free landsat images of study area to correlate with soil macronutrients. The results showed that, NO3-N and Available P were deficient in study area and were having the mean value of 7.54 mg kg-1 and 6.64 mg kg-1 respectively. K and SO4-S were in satisfactory ranges and were having average values of 130.3 mg kg-1 and 8.69 mg kg-1 respectively. Study area was classified as moderately calcareous soil and lime content were having the mean value of 7.88%. Geostatistical analysis showed that NO3-N and available P were strongly spatial dependent while K, SO4-S and CaCO3 were moderately spatial dependent. Pearson correlation analysis among NDVI values and soil parameters showed that NO3-N, P, K and CaCO3 were significantly positively correlated with NDVI values whereas SO4-S showed non-significant positive correlation with NDVI values. Study recommended that spatial variability of soil properties should be taken in account in decision making processes regarding farm operations such as fertilizer application, more studies on different spatial scale should be conducted and use of such techniques in profitable and sustainable site-specific agriculture should be promoted.
Keywords
Site-specific farming; GIS; Spatial variation; Digital maps; NDVI
Introduction
Blind and uniform application of fertilizer, without knowledge of farm fertility status and spatial variability of nutrients is a common problem in this era that lead to the reduction of farmer profit. It has been observed in several studies that soil nutrients vary spatially in the fields [1]. Site specific agriculture is based on the management of spatial variation of soil nutrients by the application of amendments according to the specific site and crop [2]. Quantification and awareness of spatial variability of soil properties is a key for such type of management practices [3].
Different technologies have been developed that make us enable to improve the application of different amendments in accordance to their need [4]. Geostatistical approach is very supportive for the assessment of spatial varability as well as to predict the values at unsampled location of the study area [5]. Spatial variation and digital mapping of OM content were studied by many workers to develop the site specific agriculture technology for different areas [6-8]. Geostatistics is a statistical method that can be successfully used in soil science for preparation of maps and to estimate the soil properties at unsampled location [9]. Geostatistics has been proven a suitable technique for the evaluation and description of spatial pattern of soil properties and wheat yield. Identified spatial pattern and wheat yield by geostatistical and semivariogram analysis has been found helpful for the division of fields into different management zones such as fertilizer management, as well as gypsum application for reclamation of salt affected areas. Krigging and semivariogram was found helpful for the prediction of soil properties at unsampled locations [10].
Krigging is a technique that is used for the interpolation of unknown sites from measure sites to study the spatially variable processes. The term krigging is a generic name that has been adopted to appreciate the pioneer work of Daniel Krige. Kriging is the onesided average that is based on the known spatial dependence as shown by the semivariogram. It is able to provide more reliable description of spatial pattern for the soil characteristics than all other interpolators as observed in many comparative studies [11]. Noor et al. [12] in 2013 conducted a research trial for the estimation of spatial variability of micronutrients in citrus orchards by using krigging technique. The results revealed that almost all maps shown that micronutrients varies spatially in the field.
The Normalized Difference Vegetation Index (NDVI) shows patterns of vegetative growth from green-up to senescence by indicating the quantity of actively 4 photosynthesizing biomass on a landscape [13]. Verhulst et al. [14] demonstrated that the spatial variability of soil properties influence the crop performance and is correlated with the NDVI values by affecting the spectral characteristics of vegetation. Ma et al. [15] showed that higher the nitrogen contents increase the chlorophyll content and leading to increased NDVI values.
Keeping in view the above scenario a study was designed with the aim to examine the spatial variation of soil nutrients at farm level, to prepare the soil fertility maps and to correlate NDVI values and soil macronutrient status of University research farm Koont, Chakwal.
Materials and Methods
Study area and soil sampling
Study was conducted at University Research Farm Koont, Chakwal, Pakistan (N33° 6' 42.54" to N33° 7' 16.98"and E73° 0' 24.3" to E73° 1' 15.54") with an altitude of 1645 m to 1703 m above from sea level. The study area was about 100 hectors. Mainly parent material of the soil is derived from shale and sandstone, with humid t sub-humid climate and annual average rainfall is 350-500 mm. the mean annual monthly temperature is 5.9-38.4°C. Soil sampling was done at depth of 0-20 cm with 30 × 30 m grid spacing and location was recorded by global positioning system (GPS) receiver.
Soil analysis
All samples were analyzed for NO3-N [16], Available P [17], Extractable K [18], SO4-S [19] and CaCO3 [20].
Statistical and geostatisical analysis
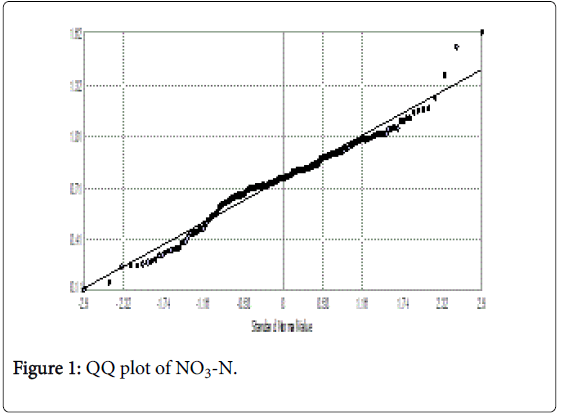
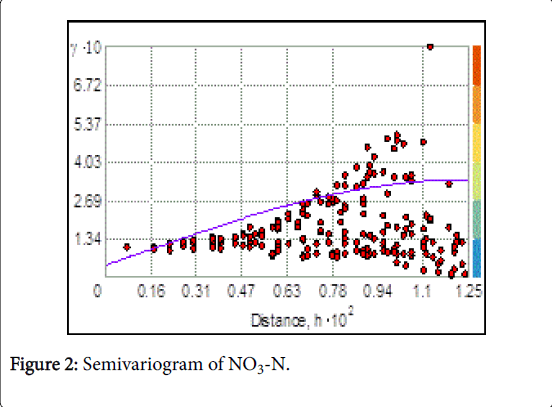
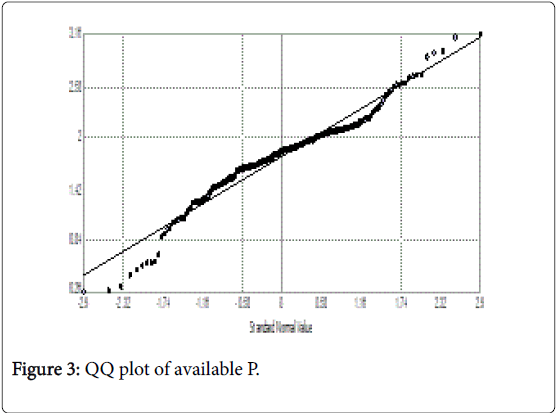
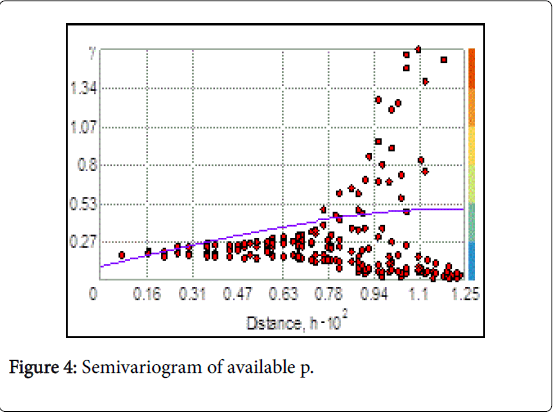
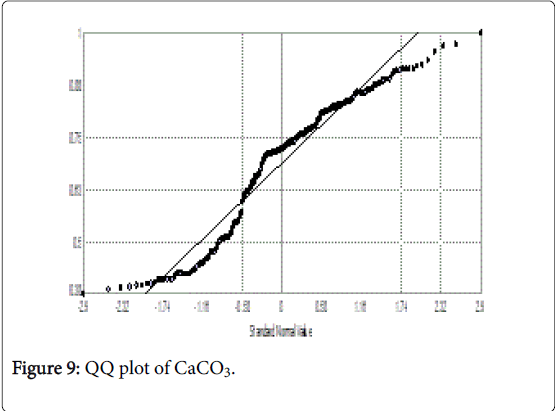
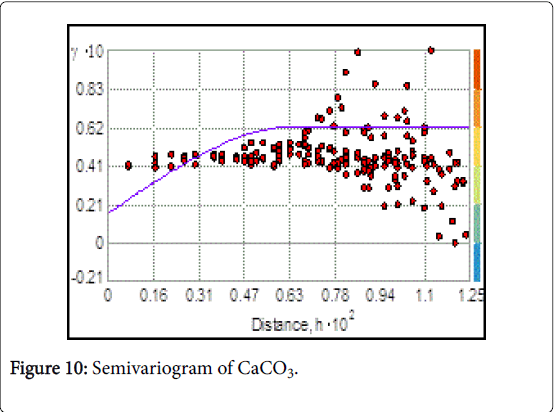
ArcGIS 10.1 software was used for statistical and geostatistical analysis of the data. Semivariogram analysis was done to calculate the nugget to sill ratio, which indicates the degree of spatial dependence by using uniform interval to establish the range of spatiality. According to criteria given by Attar et al. [21] spatial dependence is classified in to weak (ratio >75%), moderate (ratio 25-75%) and strongly spatial dependent (ratio <25%). Other statistical parameters of data such as mean, minimum, maximum and standard deviation (S.D) were also calculated. Co-efficient of variance (CV) was calculated to check the variation of soil nutrients in soil. Soil nutrients with CV<15% were grouped as least variable, nutrients with CV value 15-35% were moderately variable while nutrients with CV value >35% were grouped as highly variable Wilding [22]. Co-efficient of skewness and kurtosis were calculated to check the normality of distribution of data and our data did not show the normal distribution, so the data was logtransformed. Log transformed data made it clear that data was normally distributed. Data was cross validated by plotting a graph between the measured values on X-axis and predicted values on Y-axis which lead to the plotting a QQ plot between standardized error on Y axis and Normal value on X-axis to show the quantiles of difference between estimated and predicted values and relating quantiles from a standard normal distribution.
Digital mapping
Soil fertility maps of study area were prepared by using ArcGIS 10.1 software indicating the concentration of macronutrients at different locations of the area. GPS points of each sample were used to prepare the maps.
NDVI mapping and Correlation of NDVI and soil macronutrients
NDVI maps of studied area were prepared by obtaining cloud free landsat images for one year duration to calculate the NDVI values by using formula given by Chaudhury [23]. Pearson correlation analysis was done to find the co-efficient of correlation among NDVI values and soil macronutrients. To minimize the error NDVI values of fallow fields were excluded in correlation analysis.
NDVI=(pNIRā?pR)/pNIR+pR
Results and Discussion
Basic soil analysis of study area
According to the results pH was ranging from 7-8.5 with mean value of 7.72. Study area was free from salinity hazards and EC was ranging from 0.06 dsm-1-0.47 dsm-1 with mean value of 0.246 dsm-1. Overall there was deficiency of OM content in study area and OM contents were ranging from 0.1-1.6% with average value of 0.63%. Most of the samples were falling in sandy loam textural class whereas silt clay loam and sand clay loam classes were also observed in some samples. Sand contents were ranging from 18%-77% with average value of 57.6%, silt contents were falling in the range of 3%-70% with mean value of 30.1%,while clay contents were observed in the range of 3%-33% with mean value of 12.16%. All results are enlisted in Table 1.
Status of soil nutrients in study area
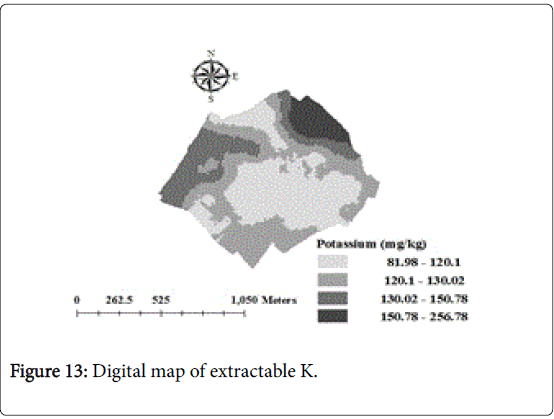
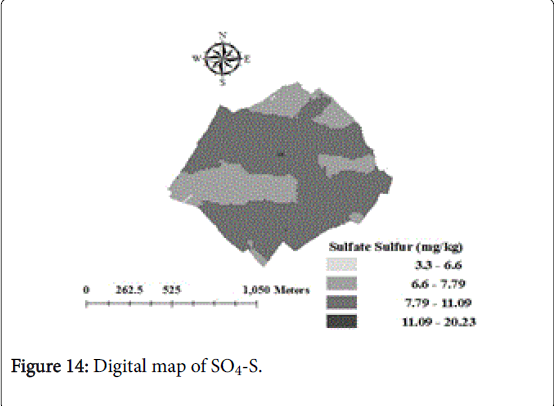
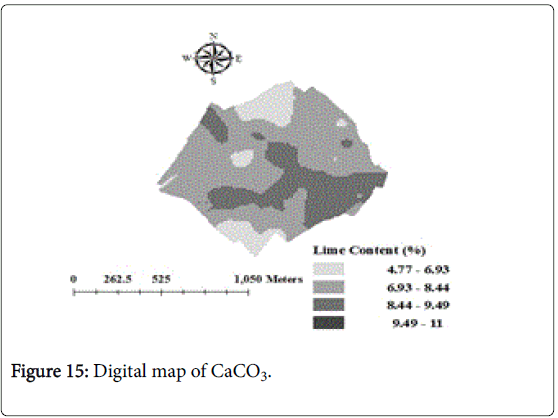
Nitrate nitrogen content were ranging from 1.053 mg kg-1 to 16.18 mg kg1 with the average value of 7.54 ± 2.21. About 95% samples were found deficient in NO3-N while 5% samples were marginal according to the criteria suggested by Malik et al. Deficiency of nitrogen in these areas is due to less organic matter contents in these soils due to climatic conditions and less use of organic amendments. Rizwan et al. [24] described almost similar results, Nitrate nitrogen was varying from 1.37 to 18.74 mg kg-1 with the average value of 7.89 mg kg-1 while they were working on same study area. About eighty five percent samples were found deficient and the difference in the results might be due to the temporal and seasonal variation in concentration of nitrate nitrogen in the area. The available P was ranging from 1.29 mg kg-1 to 23.6 mg kg-1 with the mean value of 6.64 ± 3.17. About 78% samples were deficient in available P, 19% samples were in satisfactory ranges while 3% samples shown adequate level of available P. Ahmad and Khan [25] declared almost similar results, that 70-95% soils have deficiency of available P. The reason of low available P is pH factor as most of soils were alkaline in study area which lead to the fixation of P with basic cations. Potassium was ranging from 81.98 mg kg-1to 256.78 mg kg-1 in surveyed area with the mean value of 130.3 ± 30.47. It was found that 86% samples were in satisfactory range, 13% samples showed sufficient K contents while the rest of 1% were having adequate K level. Khalid et al. [26] found the similar results and 62% samples were in satisfactory ranges. The reason of presence of adequate K concentration is most of the soils are dominant in mica minerals that is able to supply K to soil solution and plants. SO4-S was ranging from 3.3 mg kg-1 to 20.23 mg kg-1 with the mean value of 8.69 ± 3.15. About 95% samples were marginal in S, 4% samples were deficient while rest of samples shown adequate level of S contents. Deficiency of sulfur is due to less OM contents in these soils. Ahmad et al. [27] claimed that well drained and light textured soils with higher rainfall in pothowar region are generally deficient in S content. While CaCO3 contents were ranging from 4.77% to 11% with mean value of 7.88 ± 1.57 and soil were classified under weakly to moderately calcareous due to calcareous nature parent material. Shaheen et al. [28] also observed almost similar results and CaCO3 were ranging from 5.1 to 17.5% and soils of pothowar region were classified as moderately to strongly calcareous. All results are enlisted in Table 2.
Geostatistical analysis of the data
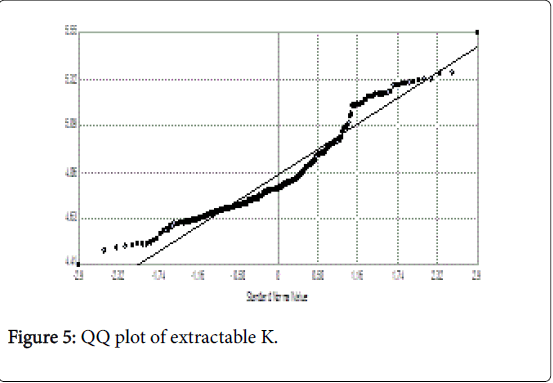
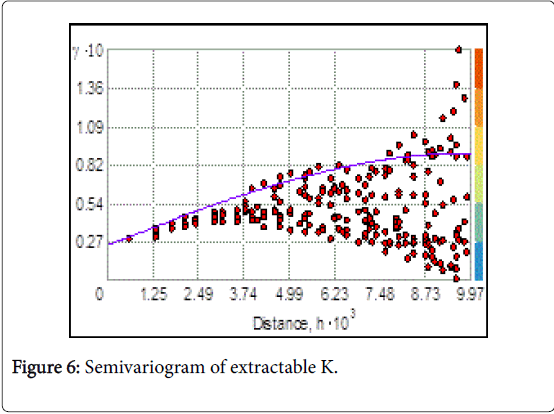
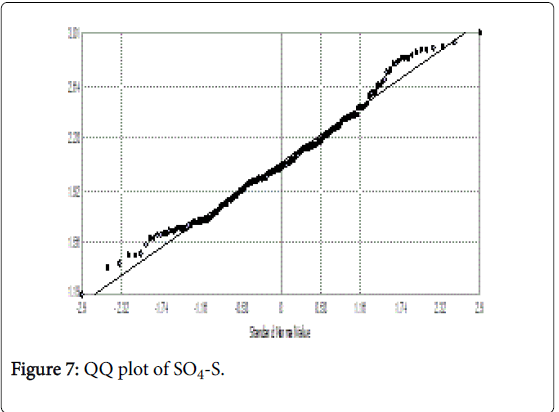
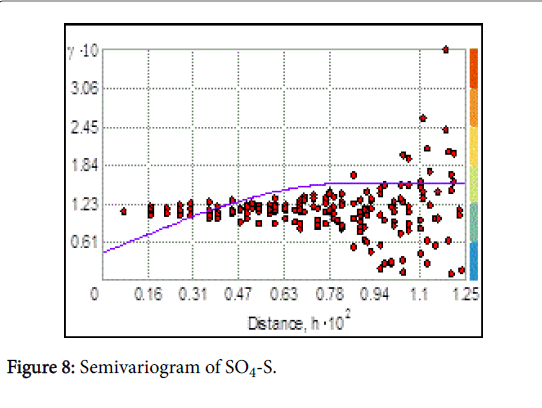
QQ plot assured the normal distribution of the data (Figures 1,3,5,7 and 9) and semivarience curve was obtained to check the degree of spatial dependence of data (Figures 2,4,6,8 and 10). And spherical model was best fitted for all nutrients. Nitrate nitrogen was found moderately variable with CV% 29.31 (Table 1). Non Log transformed data of Nitrate nitrogen showed the range of 1.23855Ao, data was strongly spatial variable as indicated by and nugget to sill ratio which was 13.784%. Available phosphorus was found highly variable within the study area with higher CV% of 47.74 (Table 1). Log-transformed data of available P contents and the range was 1.23855Ao. Nugget to sill ratio was 23.64% indicating strong spatial dependence of available P within the field. Extractable Potassium contents exhibited a weak variability with in the field with CV% 23.56 as listed in (Table 1). Extractable K was having the range of 1.23855Ao and Nugget to sill ratio was 38.23% pointing out the moderate spatial variability of K concentration with in the fields. Sulfate sulfur showed that there was a high variation in its concentration within the field CV% of 36.65 with as listed in (Table 1). Sulfate sulfur was having rang of 8.6691 Ao while Nugget to sill ratio was 38.90% giving an indication of moderate spatial variation of the sulfur. A weak variation in concentration of Calcium was reported with CV% of 19.92 as shown in (Table 1). Lime was having the range of 6.52826 Ao. Semivariogram analysis of lime contents showed nugget to sill ratio was 32.73%, indicated the moderate spatial variability of lime contents. All the geostatistical data is summarized in (Table 3).
Digital mapping
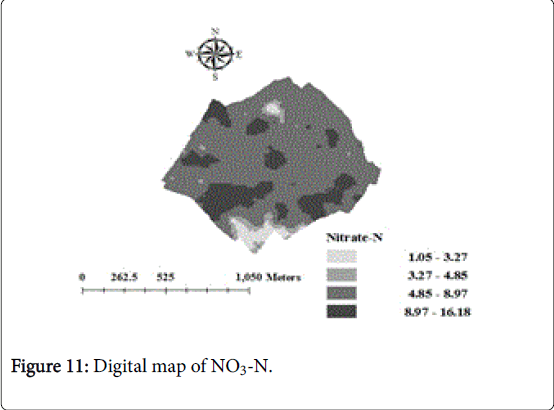
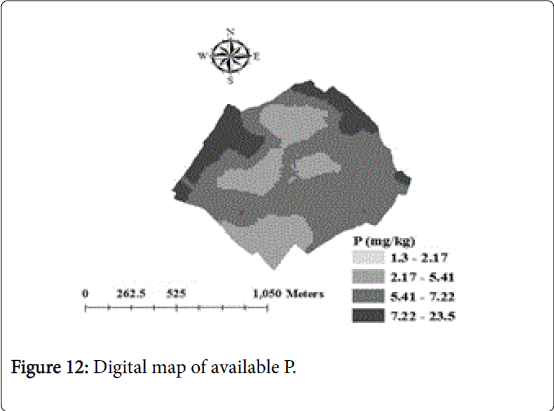
According to the prepared maps, it has been indicated that there was severe deficiency of NO3-N in over all study area however, some southern parts of studied area were containing moderate concentration of available N. Overall in the studied area there were patches having higher N contents. Keeping in view the map, the area was categorized as low in N although some area was in moderate ranges (Figure 11). The map showed that northern and western edges of studied area were containing higher available P contents while some southern and central parts of the studied area were containing lower contents of available P. Moreover, rest of the area was deficient available P contents (Figure 12). Available K contents were in satisfactory ranges in most parts of surveyed area, however it as found marginal in central parts of the studied area. The map showed that northeastern and southwestern parts of the area were containing higher amount of extractable K (Figure 13). Sulfate S contents were falling in moderate ranges in area while northeastern boundaries and southwestern parts of the surveyed area were lower in S concentration (Figure 14). Southern parts were containing lower concentration of lime and it was observed that some patches in central parts with lower lime contents, while the eastern parts were containing higher contents of lime as shown in Figure 15.
NDVI mapping
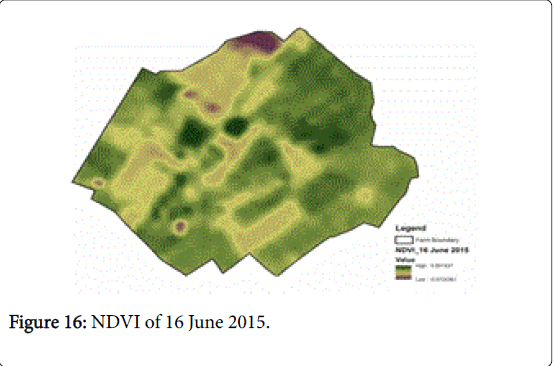
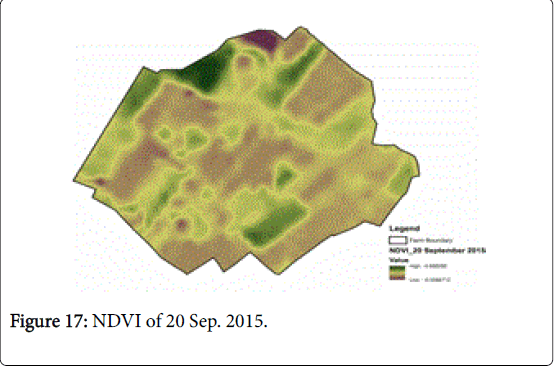
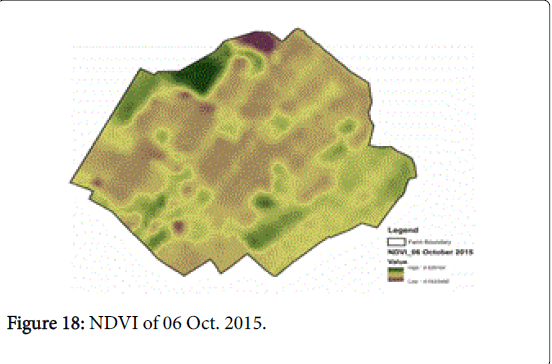
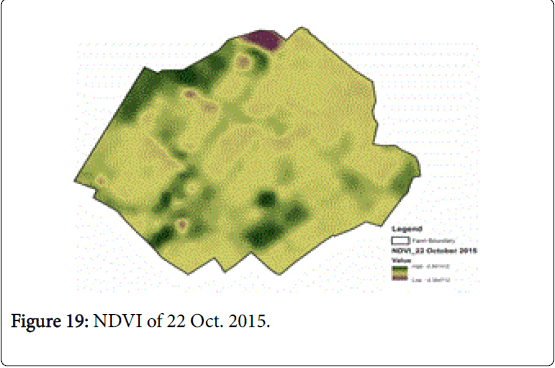
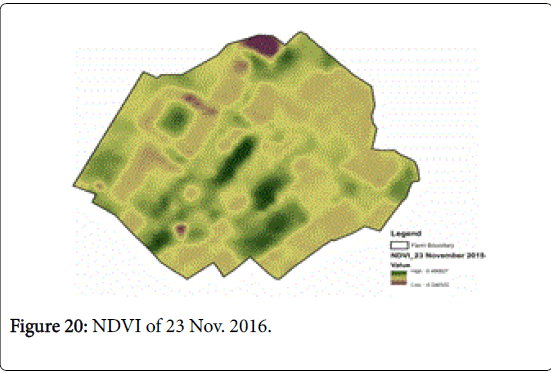
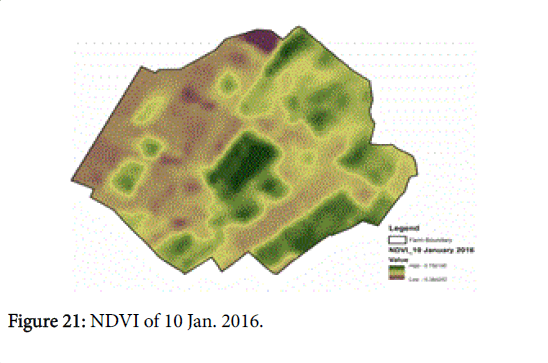
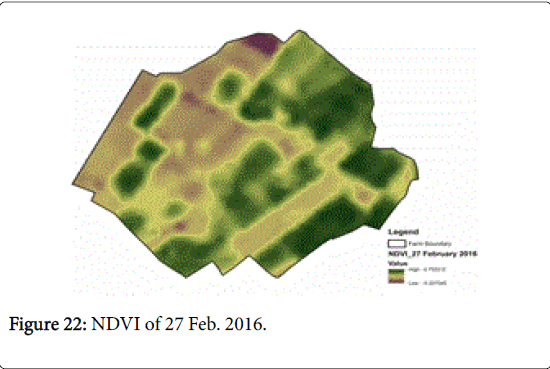
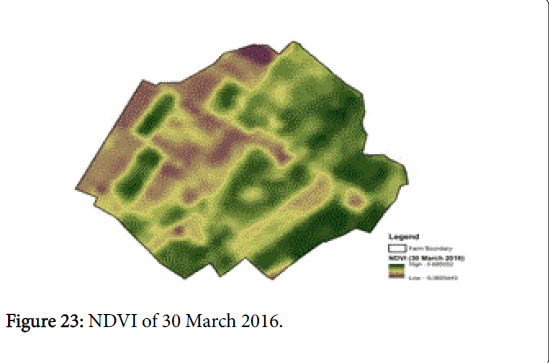
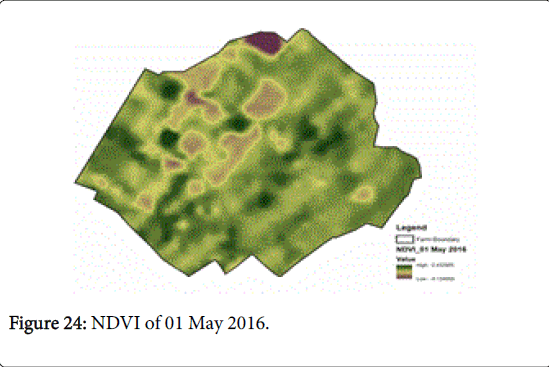
The Normalized Difference Vegetation Index (NDVI) shows patterns of vegetative growth from green-up to senescence by indicating the quantity of actively 4 photosynthesizing biomass on a landscape [13]. Landsat images of study area were acquired for one year duration. Cloud free images were used for NDVI calculation according to the prescribed procedures. Figures 16-24 show the NDVI maps of the study area for different dates. A large temporal as well as spatial variation was observed in the NDVI of the study area. The diversity of crops sown and their low density resulted in the relatively smaller NDVI values. Other reasons of lower NDVI values might be the irregular cropping pattern and the difference in sowing time of the crops.
Correlation among NDVI and soil macronutrients
Pearson correlation co-efficient among NDVI values and macronutrient contents are presented in Table 4. It was found that NDVI values of 16-June-2015 was showing the best relationship with soil fertility status, while the relation is lost with the NDVI values of image beyond this period, because it was the sowing period just after the sampling. It was found that K, P, NO3 and CaCO3 were having significant positive correlation with NDVI values. Similar results has been described by Ma et al. [15] higher the nitrogen contents increase the chlorophyll content and leading to increased NDVI values. Whereas SO4 was having non-significant positive correlation.
NDVI values of 20-September 2015 were having significant negative correlation with soil macronutrients in case of K, NO3 and CaCO3 because at that time most of the crops were going toward maturity leading in lower values of NDVI. NDVI values of 6-October 2015 and 22-October 2015 were showing significant negative correlation with macronutrients because green color of crops was detached. Obtained values of NDVI of 10-Janruary when correlated with soil fertility status it was observed that CaCO3 was having significant positive correlation with crop growth because most of the crops were on their initial stages at that time. Landsat NDVI of 27-Februaury 2016 showed significant positive correlation with K and CaCO3. Whereas NDVI values of 30- March 2016 were having significant positive correlation with CaCO3 content. Zhao et al. [29] showed almost similar result when he was working on Corn crop. According to his result deficiency of N reduced the NDVI values by reducing the reflectance. Masoni et al. [30] evaluated that decrease in sulfur concentration decrease the NDVI values by inhibiting the physiological process in plants. Belay et al. [31] exclaimed that soil fertility status and use of inorganic amendments are positively correlated with NDVI values by affecting the spectral properties of pants. Verhulst et al., [14] demonstrated that the spatial variability of soil properties influence the crop performance and is correlated with the NDVI values by affecting the spectral characteristics of vegetation.
Conclusion
Nitrogen and Phosphorus were strongly spatial dependent while Potassium, sulfure and Lime content were moderately spatial dependent. N and P was deficient in 95% and 78% samples respectively while K and S were in satisfactory ranges in 86% and 95% samples respectively. Most of the samples were moderately calcareous. Soil macronutrients were significantly positive correlated with NDVI values of studied area.
Recommendation
Spatial variability of soil macronutrients should be taken into account during decision making related to the farm interventions like application of fertilizer/soil amendments and other farming operations. More studies on different spatial scales are required for further recommendations and use of such techniques in profitable and sustainable site-specific agriculture.
References
- Gaston LA, Locke MA, Zablotowicz RM, Reddy KN (2001) Spatial variability of soil properties and weed populations in the Westfall Mississippi delta. Soil SciSoc Am J 65: 449-459.
- Fraisse CW, Sudduth KA, Kitchen NR (2001) Delineation of site-specific management zones by unsupervised classification of topographic attributes and soil electrical conductivity. Transactions of the ASABE, Saint Joseph 44: 155-166.
- Khosla R, Fleming K, Delgado JA, Shaver T, Westfall DG (2002) Use of site-specific management zones to improve nitrogen management for precision agriculture. J Soil Water Conserv. 57: 513-518.
- Robert PC, Rust RH, Larson WE (1996) Precision Agriculture. ASA, CSSA, SSSA, Madison, WI.
- Matheron G (1963) Principles of Geostatistics. Econ Geol 58: 1246-1266.
- Yanai J, MishimaAS, Funakawa K, Akshalov K, Kosaki T (2005) Spatial variability of organic matter dynamics in the semi-arid croplands of northern Kazakhastan. Soil Sci Plant Nutr 51: 261-269.
- Matsui N, Suekuni J, Havanond S, Nishimiya A, Yanai J, et al. (2008) Determination of soil-related factors controlling initial mangrove (Rhizophoraapiculata BL) grown in an abandoned shrimp pond. Soil Sci Plant Nutr 54: 301-309.
- Takata Y, Funakawa S, Akshalov K, Ishida N, Kosaki T (2007) Spatial prediction of soil organic matter in northern Kazakhastan based on topographic and vegetation information. Soil Sci Plant Nutr 53: 289-299.
- Goovaerts P (1999) Geostatistics in soil science: state-of-the-art and perspectives. Geoderma 89: 1-45.
- Bhatti A (2002) Geostatistical techniques and applications for managing degraded soil for sustainable production Quarterly Sci Vis 8.
- Kravchenko A, Bullock DG (1999) A Comparative Study of Interpolation Methods for Mapping Soil Properties. Agron J 91: 393-400.
- Noor Y, Shah Z (2013) Spatial variability of micronutrients in citrus orchard of north western Pakistan. Sarhad J Agric 29: 387-394.
- Burgan RE, Hartford RA,Eidenshink JC (1996) Using NDVI to assess departure from average greenness and its relation to fire business. Gen Tech Rep INT-GTR-333.
- Verhulst N, Govaerts B, Sayre KD, Deckers J, Francois IM, et al. (2008) Using NDVI and soil quality analysis to assess influence of agronomic management on withinplot spatial variability and factors limiting production. Plant Soil J 317: 41-59.
- Ma BL, Morrison MJ, Dwyer LM (1996) Canopy light reflectance and field greenness to assess nitrogen fertilization and yield of corn. Agron J 88: 915-920.
- Vendrell PF, Zupanacic J (1990) Determination of soil nitrate by transnitration of salicylic acid. Commun Soil Sci plant Anal 21: 1705-1713.
- Olsen SR, Sommers LE (1982) Phosphorus. In: Page AL, et al. (eds) Methods of Soil Analysis, Part 2, AgronMonogr 9. ASA and ASSA, Madison: WI, pp: 403-430.
- Rhoades JD (1982) Cation exchange capacity In: Page AL, Miller RH, Keeney DR (eds.) Method of soil analysis. Part-2 Chemical and microbiological properties. Am SocAgron Madison, Wisconsin: USA pp: 149-158.
- Tandon HLS (1991) Sulphur research and agricultural production in India. (3rd ed) The Sulphur Institute: Washington DC.
- Drouineau G (1942) Rapid determination of the soil calcireagent. Domestic news on the reputation of the nature of calcareous fractions. Ann Agron 12: 411-415.
- Attar A, Jafarnejadi A, Sayyad G, Gholami A (2012) Spatial variability of iron and zinc concentrations in the soils of wheat farms. Advances in Environmental Biology 6: 1620-1625.
- Wilding LP (1985) Spatial variability: It's documentation,accommodation and implication to soil surveys. In: Soil Spatial Variablility. Nielsen DR, Bouma J (editors),Pudoc, Wageningen: Netherland pp: 166-194.
- Chaudhury BJ (1987) Relationships between vegetation indices, radiation absorption, and net photosynthesis evaluated by a sensitivity analysis. Remot Sens.22: 209-233.
- Rizwan M, Siddique MT, Ahmed H, Iqbal M, Ziad T (2016) Spatial variability of selected physico-chemical properties and macronutrients in the shale and sandstone derived soils. Soil Environ 35: 12-21.
- Ahmad N, Khan AA (2006) Nutrient management for sustainable agriculture in Pakistan. In: Poster Session. IFA Conference Optimizing Resource Use Efficiency for Sustainable Intensification of Agriculture. Kunming, China.
- Khalid R, Mahmood T, Bibi R, Siddique MT, Alvi S, et al. (2012) Distribution and indexation of plant available nutrients of rainfed calcareous soils of Pakistan. Soil Environ 31: 146-151.
- Ahmad N, Saleem MT, Rashid M, Jalil A (1994) Sulfur status and crop response in Pakistan soils. National Fertilizer Development Center (NFDC). Publication No.7/94. Planning and Development Division GOP, Islamabad.
- Shaheen A, Shafiq M, Naeem MA, Jilani G (2010) Soil characteristics and plant nutrient status in the eroded lands of Fatehjang in the Pothwar plateau of Pakistan. Soil Environ 27: 208-214.
- Zhao D, Reddy KR, Kakani VG, Read JJ, Carter GA (2003) Corn (Zea mays L.) growth, leaf pigment concentrations, photosynthesis and leaf hyperspectral reflectance properties as affected by nitrogen supply. Plant Soil 257: 205-217.
- Masoni A, Ercoli L, Mariotti M (1996) Spectral properties of leaves deficient in iron, sulfur, magnesium, and manganese. Agro. J 88: 937-943.
- Belay A, Claassens AS, Wehner FC (2002) Effect of direct nitrogen and potassium and residual phosphorous fertilizers on soil chemical properties, microbial components and corn yield under long-term crop rotation. BiolFert Soils 35: 420-427.
Relevant Topics
- Basmati Rice
- Drought Tolerence
- Golden Rice
- Leaf Diseases
- Long Grain Rice
- Par Boiled Rice
- Raw Rice
- Rice
- Rice and Aquaculture
- Rice and Nutrition
- Rice Blast
- Rice Bran
- Rice Diseases
- Rice Economics
- Rice Genome
- Rice husk
- Rice production
- Rice research
- Rice Yield
- Sticky Rice
- Stress Resistant Rice
- Unpolished Rice
- White Rice
Recommended Journals
Article Tools
Article Usage
- Total views: 4508
- [From(publication date):
June-2017 - Jul 11, 2025] - Breakdown by view type
- HTML page views : 3410
- PDF downloads : 1098
