Correlation of Sonographic Fetal Weight in Term Pregnancies with Weight at Birth in a Semi-Urban Tertiary Hospital in Southern Nigeria
Received: 21-Feb-2023 / Manuscript No. roa-23-89744 / Editor assigned: 23-Feb-2023 / PreQC No. roa-23-89744 (PQ) / Reviewed: 09-Mar-2023 / QC No. roa-23-89744 / Revised: 15-Mar-2023 / Manuscript No. roa-23-89744 (R) / Published Date: 22-Mar-2023 DOI: 10.4172/2167-7964.1000430
Abstract
Introduction: Sonographic measurement of fetal weight is a precise method of assessing fetal size and growth. Abnormal fetal weights are associated with increased risk of complications during pregnancy and delivery, hence the importance of sonographic fetal weight estimation in aiding the planning of delivery. This study aims to determine its reliability and accuracy.
Materials and Methods: Two hundred women with singleton term pregnancies between 37-42weeks were evaluated using a B-mode ultrasound machine with a 3.5 MHz curvilinear array transducer. The sonographic fetal weight estimates were correlated with actual birth weights.
Data was analyzed using the statistical package for social sciences (SPSS) version 21.0. Confidence level of 95% was used and the level of statistical significance was set at p≤ 0.05.
Results: There was strong positive correlation between the actual birth weight and Sonographically estimated fetal weight (r=0.906) and the mean difference was not statistically significant (p=0.229). Seventy-four percent (74%) of sonographic fetal weight estimates fell within 10% of the actual birth weights.
Conclusion: Sonographically estimated fetal weight at term had a strong positive correlation with the actual birth weight, thus making ultrasound a reliable tool for predicting birth weight.
Keywords
Sonography; Estimated fetal weight; Birth weight
Introduction
Sonographic fetal weight estimation is an important component of antenatal care [1]. It is a common obstetric practice which provides valuable information for planning the mode of delivery [2]. The primary aim of ultrasonography in pregnancy is to limit the risk of obstetric complications by early detection of abnormalities such as intrauterine growth restriction and macrosomia [3]. Both low birth weight and fetal macrosomia are associated with increased risk of complications during pregnancy and delivery [4]. Maternal risk associated with the delivery of an excessively large fetus includes pelvic floor injuries and postpartum hemorrhage [1,5] Shoulder dystocia and brachial plexus injuries may also complicate the birth of macrosomic babies [6]. The incidence of operative vaginal delivery or caesarean section is higher among pregnant mothers with macrosomic babies due to cephalopelvic disproportion (CPD) [5].
Sonographic fetal weight estimation can be achieved by the measurement of several fetal biometric parameters such as the biparietal diameter (BPD), abdominal circumference (AC), femoral length (FL), head circumference (HC) and Occipitofrontal Diameter (OFD) [1,7] However, some authors believe that a combination of multiple fetal parameters as listed above yield more accurate result of the estimated fetal weight in the third trimester [7,8].
By the end of the first trimester the average singleton fetus weighs about 80grams, and subsequently, grows increasingly faster to reach a maximum growth rate of almost 220g per week by 35weeks. Thereafter, the growth rate then slows down to about 185g per week till about 40 weeks [9].
The Royal College of Obstetricians and Gynaecologists (RCOG) defined small-for-gestational age (SGA) fetus as a newborn whose birth weight is less than the 10th percentile for gestational age, whereas large- for-gestational age (LGA) is generally used to describe a birth weight equal to, or greater than the 90th percentile for a given gestational age [10,11].
Studies done by Fuchs et al [12] and Gardosi et al [13] highlighted the birth weight as an important parameter which determines the outcome of pregnancy and neonatal survival in the first year of life. Birth weights are broadly classified into three major groups; the low birth weight (<2.5kg), normal birth weight (2.5-3.9kg) and the macrosomic babies (≥4kg). However underweight newborns may be further subclassified into low birth weight (1.5-2.49 kg), very low birth weight (1-1.49kg), extremely low birth weight (0.5-0.99kg) [14].
Macrosomia implies growth beyond a specific weight usually 4000grams regardless of the gestational age [15].
Some studies have suggested that ultrasonographic fetal weight may be adversely affected by maternal factors such as age, weight, oligohydramnios, maternal diseases like diabetes mellitus, fetal chromosomal abnormalities and racial factors [15].
Ethnicity is believed to play an important role in causing variations in the estimated fetal weight [16].
Term pregnancies are pregnancies within 37 to 42 weeks of gestation. Less than 37weeks of gestation and above 42 weeks of gestation are designated pre-term and post-term pregnancies respectively [17].
The two main methods for predicting the birth weight in current obstetric practice are; (i) Clinical method; by obtaining the product of the maternal abdominal girth and the symphysio-fundal height measured in centimetres, and the result expressed in grammes.
(ii) Ultrasonographic method; Which involves measurement of multiple fetal biometric parameters like the Biparietal Diameter (BPD), Femoral Length (FL), Abdominal Circumference (AC), Occipito-Frontal Diameter (OFD) and Head Circumference (HC). By computation using a regression algorithm, the ultrasound scanner is able to generate the estimated fetal weight [18,19].
Different ultrasound machines have software packages with equations for fetal weight estimation. The commonest of them are the Hadlock and Shepard algorithm.
Magnetic Resonance Imaging may be used in estimating the weight of a fetus. This, it does by means of an equation developed by Baker et al. [20] in which the fetal body volume is multiplied by fetal density, and the fetal weight is then generated. Magnetic Resonance Imaging (MRI) is safe in pregnancy, as it does not use ionizing radiation. However, its usage has some significant drawbacks which includes; (i) not being readily available in our local environment, partly due to its high cost of purchase and maintenance, (ii) expensive for subjects/ patients, (iii) contraindicated in patients with ferromagnetic implants such as metal prosthetic devices, (iv) patient’s fear of an enclosed gantry (claustrophobia), (v) negative impact of fetal motion on the accuracy of results [20,21].
Although the use of Magnetic Resonance Imaging (MRI) is promising, ultrasonography is still the dominant screening method for estimation of fetal weight. It has the advantage of it being relatively simple to use, readily available, reliable, non-ionizing and also has a high sensitivity in estimating fetal weight, hence ultrasonography was chosen as the imaging modality in this study. However, it is operator dependent.
The aim of this study was to sonographically estimate the fetal weight in term singleton pregnancies and compare same with actual birth weight, to determine the accuracy of ultrasonography in predicting weight at birth.
Materials and Methods
Study design
This was a prospective comparative cross sectional study of sonographic fetal weight estimation in term pregnancies with weight at birth. This study was conducted and its data collected over a one year period between 21st September 2019 to 20th September 2020 in the Departments of Radiology and Obstetrics and Gynecology of Irrua Specialist Teaching Hospital (ISTH), Irrua.
Study population
The study was carried out amongst pregnant women who were already at term and have been attending regular antenatal clinic at Irrua Specialist Teaching Hospital and were admitted in the labour ward for spontaneous vaginal delivery, induction of labour or elective caesarean section.
Study setting
Irrua is situated in Esan land, about 87Km North of Benin City. It is the headquarter of Esan Central local Government area in Edo State. Irrua Specialist Teaching Hospital is one of the tertiary health care centres in Edo State which caters for patients in Edo, as well as those referred from Delta, Ondo, Ekiti and other neighbouring states. The Obstetrics and the Gynaecology Department of the Hospital has about thirteen (13) specialists (consultants).
An average of about eighty (80) to a hundred and ten (110) deliveries is taken in the labour ward monthly.
Equipments
The ultrasound scanner used for this study were Mindray diagnostic ultrasonic scanners; DC-6 model (Shenzhen Mindray Biomedical Electronics Company Ltd, China 2016) B-mode ultrasound machines. The ultrasound machines were in the Departments of Radiology and Labour ward of Irrua Specialist Teaching Hospital. Both machines were of same model. Each scanner had a 3-5MHz convex transducer, and uses the Hadlock 4 fetal weight estimation algorithm.
Actual birth weights of the babies were measured in the labour ward using DOCbel Braun (DOCBEL Industries Inc, India 2017) weighing scale.
Maternal weights and heights were also measured and their respective body mass index calculated.
Sample size determination
The sample size formula used is that for comparing 2 Mean of a paired observation comprising of a before and after measurement and it is stated thus:
N = (Zα+Zβ)2 /(δ/s)2 [22 ].
Where N-Minimum sample size to be studied Zα- 1.96 This is the standard deviation value corresponding to a α-0.05
Zβ- 0.84 This is the standard deviation value corresponding to a power of 80%
δ- (μ0-μ1) – is the magnitude of the clinical difference of interest to be detected in the mean weight of babies estimated by ultrasound scan and the actual mean weight of the same babies measured at delivery by using a Weighing Scale.
s- is the standard deviation of the difference within pairs of means of baby weight estimated by ultrasound scan and by actual weight measurement at delivery.
NB: The measure (δ/s) is the standardized clinical difference to be detected or the EFFECT SIZE and this can be estimated into small, moderate or large (0.2, 0.5, 0.8) respectively [23].
Assuming a clinical Effect size of 0.2 for this study,
N = (1.96 + 0.84)2=/(0.21)2
N = (2.8)2 =/0.0441
N (minimum sample size) = 7.84/ 0.0441 = 178
Giving room for a 10% loss to follow up (attrition), N = 178/ 0.9= 198
Therefore, a total of 200 pregnant women with viable singleton fetuses at 37 to 42 weeks gestation were enrolled in the study. Inclusion criteria
1. Booked women with singleton pregnancies at term (37 weeks to 42 weeks) admitted for spontaneous vaginal delivery, induction of labour or elective caesarean section.
2. Known last menstrual period (LMP).
3. Consenting to the study haven fulfilled the above two criteria. Exclusion criteria
1. Women with pre/post-term pregnancies
2. Sonographically detected fetal anomaly during the antenatal period e.g. omphalocele, gastroschisis, anencephaly, Amelia etc.
3. Still births (Intrauterine fetal demise).
4. Unbooked patients.
5. Multiple gestations.
6. Women with co-morbidity e.g. hypertension, diabetes mellitus, renal disease etc.
7. Women who decline consent to the study after counselling despite satisfying other inclusion criteria.
Technique
All sonograms were carried out by the researcher. The examination was performed using a 3-5MHz curvilinear array transducer of a Mindray Ultrasound machine (DC-6, Shenzen Mindray Biomedical electronic company, Shenzen China, 2016) and a weighing scale (DOCbel Braun weighing scale manufactured in the year 2017 by DOCBEL Industries Ltd in India).
All sonograms were carried out within 24 hours prior to delivery. The procedure was thoroughly explained to each subject, after which written informed consent was obtained.
The maternal demographic parameters such as age, weight, height, ethnicity, level of education, menstrual age, parity, gravidity as well as maternal medical history were obtained and recorded.
The Ultrasound examination was performed in the presence of a Chaperon, with the subject lying in the supine position on the examination couch. The abdomen was exposed from the xiphisternum to the pubic symphysis and the patient’s arms placed by her sides.
Coupling gel was then applied over the abdomen. The ultrasound transducer was lightly placed over the abdomen and manipulated in various (longitudinal, transverse and oblique) planes to visualize the gravid uterus and its content (the fetus, placenta, umbilical cord and amniotic fluid). The image was frozen on the screen and using the electronic callipers, the measurements of Biparietal Diameter (BPD), Head Circumference (HC), Abdominal Circumference (AC) and Femoral Length (FL) was obtained as described in the section below. The composite gestational age was derived by the ultrasound scanner using the aforementioned fetal biometric parameters. The estimated fetal weight was also calculated by the machine’s Hadlock EFW algorithm which used all four fetal biometric parameters (BPD, HC, AC and FL).
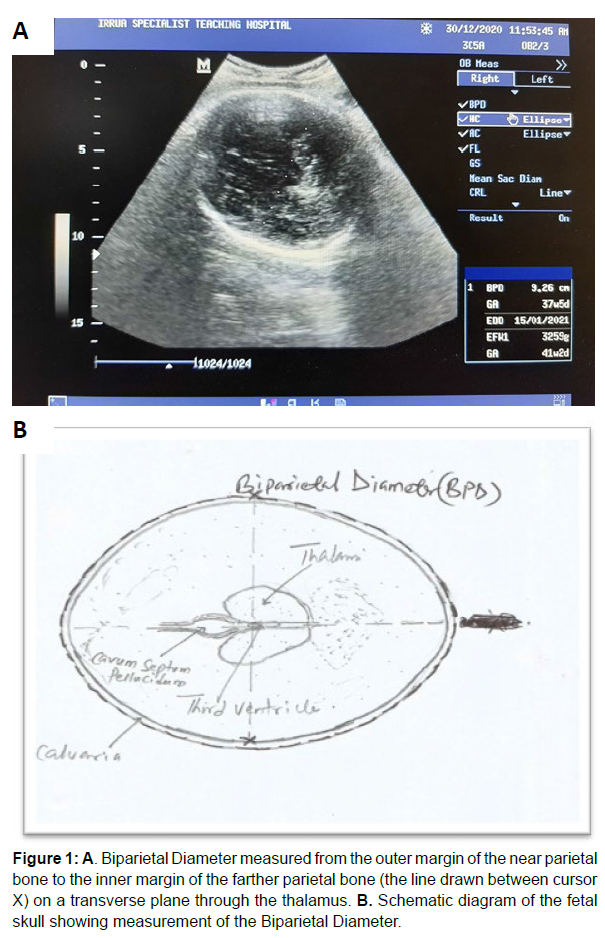
Measurement of biparietal diameter (bpd) The Biparietal Diameter (BPD) was determined on a transverse sonogram of the fetal head which showed the midline linear echogenic reflection of the falx cerebri, and the cavum septum pellucidum located anterior to the thalamus on either side without seeing much of the cerebellum on this plane.
The thalami appeared as diamond-shaped hypoechoic structures and the third ventricle was seen between them.
The image was frozen, and the BPD was then measured by placing the crossed-end of the electronic calliper (cursor) on the outer edge of the parietal bone closer to the transducer (probe) and then drawn to the inner edge of the parietal bone farther from the transducer [24,25]. This line is perpendicular to the linear echo of the falx cerebri. See figure 1 A and B for sonogram and the corresponding schematic diagram (Figure 1A & 1B).
Figure 1: A. Biparietal Diameter measured from the outer margin of the near parietal bone to the inner margin of the farther parietal bone (the line drawn between cursor X) on a transverse plane through the thalamus. B. Schematic diagram of the fetal skull showing measurement of the Biparietal Diameter.
Measurement of head circumference (HC)
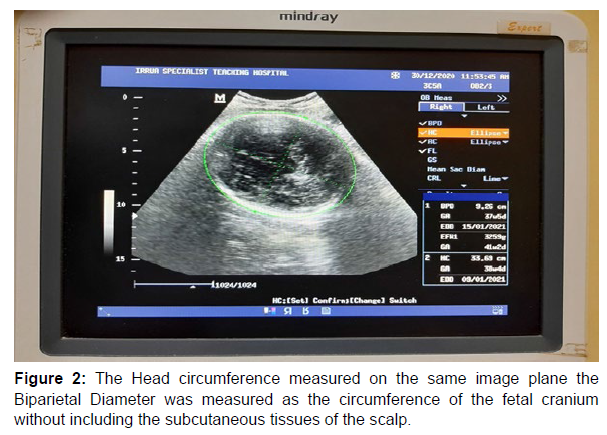
The Head Circumference (HC) was measured using the same frozen transverse image of the fetal head from which the BPD was measured; the cursor was placed on the outer margin of the parietal bone nearer the ultrasound transducer (probe) from where the perimeter of the skull is traced as an ellipse using the trackball. The cursor was also placed on the outer margin of any part of the fetal skull bones and the perimeter of the fetal skull traced with the ellipse. Changing the maternal position during the image acquisition process also improved visualization [24- 26] See figure 2 for sonogram (Figure 2).
Measurement of the abdominal circumference (AC)
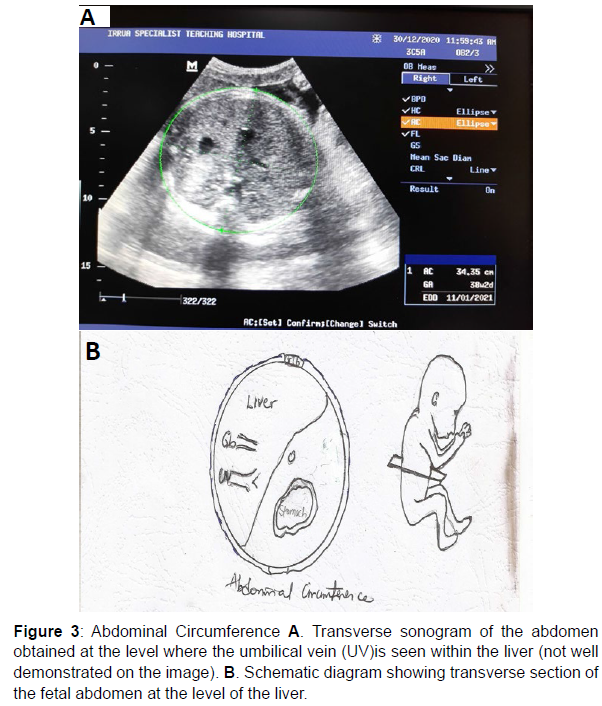
Measurement of the Abdominal Circumference (AC), was taken in the axial plane, at the level of the junction of the umbilical vein with the left portal vein which gives a “hockey stick” appearance. At this level, the abdomen appears round and the fluid-filled stomach is also routinely seen on this plane.
The abdominal circumference (AC) was measured by placing the cursor on the outer margin of the fetal abdomen and then using the ellipse facility to trace the perimeter (circumference) of the fetal abdomen with the fetal subcutaneous tissue inclusive [24-26] (Figure 3).
Measurement of the femoral length (FL)
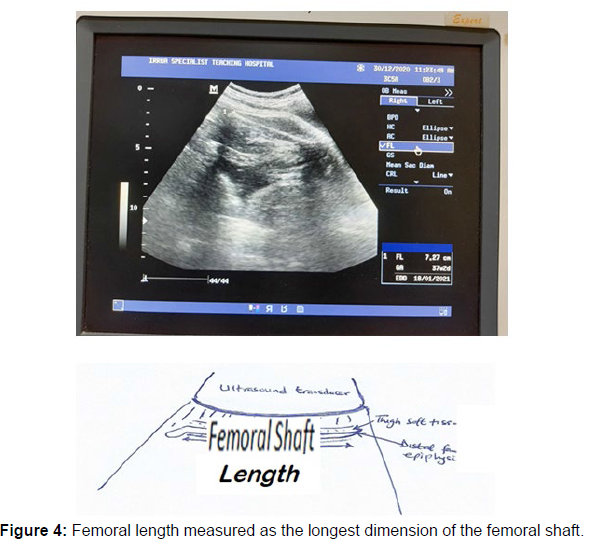
The Femoral Length was assessed by measuring the length of the femoral shaft in its longest dimension while disregarding the curvature of the medial border and also the distal femoral epiphysis which is usually seen as an echogenic spike (hook) on the distal end of the femoral shaft. The femoral shaft should be horizontal and perpendicular to the direction of the sound waves for accurate measurement of the femoral length.
The femoral shaft appears as a dense band-like echogenic structure casting acoustic shadow [26] (Figure 4).
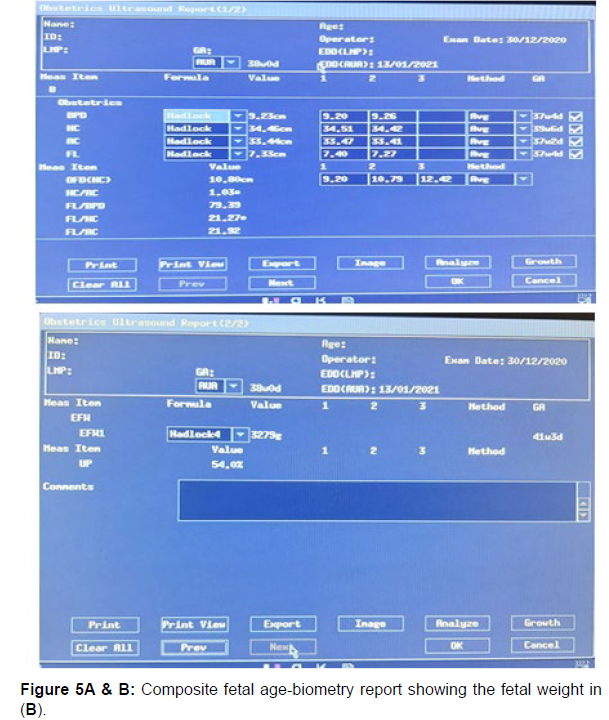
Using the Hadlock IV algorithm incorporated in the computer software on the ultrasound scanner, the composite gestational age and the estimated fetal weight (EFW) were generated for each fetus scanned (Figure 5).
At the end of the procedure, the maternal abdomen was wiped with a clean tissue paper, thereafter the patient was assisted down from the examination couch.
Measurement of actual birth weight (ABW)
This was done by trained and experienced midwives on duty in the labour ward, usually numbering about three (3) in any given shift duty, with each having more than three (3) years experience in midwifery. Measurements were taken within fifteen (15) to twenty (20) minutes of delivery, using the weighing scale, (DOCBel Industries Ltd, India, 2017). The recorded birth weights were subsequently retrieved from labour ward records after the delivery.
Measurement of maternal body mass index (BMI)
Each of the subjects were made to stand upright while backing the wall, and their heights were measured by means of a measuring tape stretched from the heel of their foot to the vertex of their head. This was measured in centimetre and then converted to metre, before being recorded on the questionnaire. Each subject was also made to pull off her shoes, and stand on a weighing scale. The weight in kilograms was then read off and recorded. This was done for all 200 subjects. The body mass index was then calculated for each subject by dividing the weight by the square of the height in metres.
Body Mass Index (BMI) = Weight (kg) / Height2 (m2)
Ethical approval
Ethical approval was obtained from the Health Research and Ethics Committee of Irrua Specialist Teaching Hospital. Informed consent for each participant (Subject) was also obtained before each sonographic examination.
Method of data analysis
Data obtained from questionnaires were coded and entered into International Business Machines Statistical Package for Social Sciences (IBM/SPSS) Version 21.0 spreadsheet for analysis. Descriptive statistics was then represented in frequency tables, percentages and charts. Inferential statistics was used to show associations between sociodemographic variables and other determinants of primary outcome using the chi-square, t-test and Pearson’s correlation co-efficient where appropriate and Analysis of Variance. Statistical significance was set at p≤0.05.
Limitation of Study
Ultrasonography is operator-dependent, hence most of the sonographic estimates were crosschecked by colleagues and the supervising consultants. Intra observer error was also minimized by taking average of three measurements of each fetal biometric parameter.
There might have been errors from the actual weight measurement by different nurses on duty. This was minimized by correcting the weighing scale to zero before each measurement was made.
Results
A total of two hundred (200) pregnant subjects with singleton gestation at term, were recruited for this study.
Sociodemographic characteristics
The mean age of the subjects was 29.73±5.36 years, while the range was 20 to 49 years. This is clearly depicted in Table 1 above which shows the socio-demographic characteristics of the study population. 99 (49.5%) of the subjects were in the 30-39 years age range, followed by those in the 20-29 years age range constituting 95 (47.5%) in total study population. Only about 6 (3%) were above 40 years (Table 1).
| Variables | Frequency (N = 200) | Percent |
|---|---|---|
| Age(years) | ||
| 20-29 | 95 | 47.5 |
| 30-39 | 99 | 49.5 |
| 40-49 | 6 | 3 |
| Mean Age±SD | 29.73±5.36 | |
| Level of Education | ||
| Primary | 2 | 1 |
| Secondary | 64 | 32 |
| Tertiary | 134 | 67 |
| Occupation | ||
| Applicants | 12 | 6 |
| Artisans | 27 | 13.5 |
| Civil servants | 36 | 18 |
| Health workers | 9 | 4.5 |
| Full House wives | 19 | 9.5 |
| Students | 27 | 13.5 |
| Teachers | 21 | 10.5 |
| Traders | 49 | 24.5 |
| Ethnicity | ||
| Akoko Edo | 2 | 1 |
| Bini | 21 | 10.5 |
| Calabar | 3 | 1.5 |
| Delta-Ibo/Ibo | 19 | 9.5 |
| Esan | 99 | 49.5 |
| Etsako | 14 | 7 |
| Hausa/Fulani | 4 | 2 |
| Ijaw | 3 | 1.5 |
| Kogi (Igala, Idoma, Ibira) | 6 | 3 |
| Owan | 11 | 5.5 |
| Urhobo | 8 | 4 |
| Yoruba | 10 | 5 |
Table 1: Socio-demographic characteristics of respondents.
Majority of the women (about 67% of the total population) had formal education up to tertiary level. Only 2(1%) had primary education. Those with secondary level of education accounted for 64 (32%) of the population.
In terms of occupation, almost a quarter of the women were traders; both large scale business entrepreneurs and petty traders, constituting about 24.5% of the population. The others were regular civil servants, students, teachers, artisans, applicants and full house wives etc. However, there were overlaps in terms of occupation as some of the women had multiple job types. The least were the health workers.
In terms of ethnicity, the subjects were predominantly of Esan ethnic group, constituting about 49.5% of the population, while the Akoko Edo speaking tribe were the least represented, constituting about 1% of the total study population. The ethnic distributions of the various tribes are also shown in Table 1 (Table 2).
Table 2 above shows the obstetric characteristics of the subjects of the 200 subjects recruited for this study, 76 (38%) were multiparous, another 75 ( 37.5%) were nulliparous, 24% were primiparous, while the grand multiparous subjects (those who have carried more than 5 pregnancies to term) were the least, making 0.5% of the population. It was observed that there was a gradual decline in the number of subjects as parity and gravidity increased.
| Variables | Frequency (N=200) | Percentage |
|---|---|---|
| Parity | ||
| 0 (nulliparous) | 75 | 37.5 |
| 1 (primiparous) | 48 | 24 |
| 2 | 41 | 20.5 |
| 3 (multiparous) | 22 | 11 |
| 4 | 13 | 6.5 |
| 5 (grandmultiparous) | 1 | 0.5 |
| Gravidity | ||
| 1 | 58 | 29 |
| 2 | 46 | 23 |
| 3 | 46 | 23 |
| 4 | 31 | 15.5 |
| 5 | 16 | 8 |
| 6 | 3 | 1.5 |
Table 2: Obstetrics characteristics of the study population.
The weight range of the subjects was between 64kg and 140kg, with a mean value of 87.3± 15.08kg. The mean height was about 1.68±0.06m.
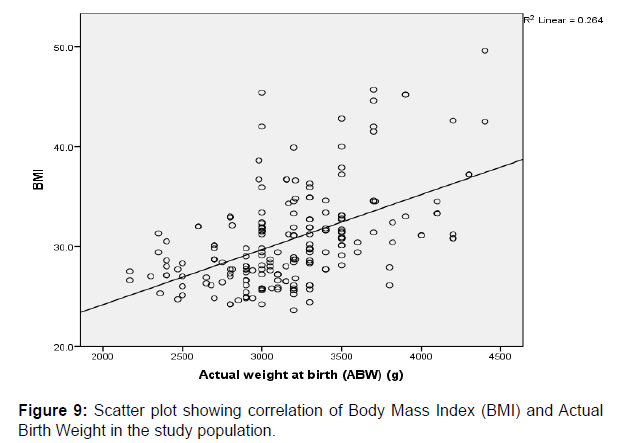
The body mass index (BMI) for the subjects ranged between 23.6kg/ m2 to 49.6kg/m2, with a mean value of about 30.64±4.85 kg/m2. The distribution of the data for height, weight and Body Mass Index (BMI) is shown in (Table 3).
| Variables | Range | Mean | Std. Deviation | |
|---|---|---|---|---|
| Minimum | Maximum | |||
| Weight (kg) | 64 | 140 | 87.3 | 15.08 |
| Height (m) | 1.55 | 1.8 | 1.68 | 0.06 |
| BMI (kg/m2) | 23.6 | 49.6 | 30.64 | 4.85 |
| BMI = Body Mass Index, Kg = Kilogram, m =meter | ||||
Table 3: Anthropometric characteristics of the study population.
Table 4 shows the relationship between the menstrual age
(gestational age calculated from the first day of the last menstrual period) and sonographic gestational age, as well as between sonographically estimated fetal weight (g) and Actual weight at birth (g). The mean menstrual age was 38.49±1.14 weeks, while the corresponding mean sonographically estimated gestational age was 38.54±1.12 weeks (Table 4).
| Parameters | Mean±SD | t-test | P-value |
|---|---|---|---|
| Menstrual Age | 38.49±1.14 | -0.442 | 0.659 |
| Sonographic Gestational Age | 38.54±1.12 | ||
| Sonographic Estimated fetal weight | 3124.44±392.30 | -1.204 | 0.229 |
| Actual weight at birth | 3175.39±451.81 | ||
| The P-values are not statistically significant. | |||
Table 4: Relationship between Menstrual age and Sonographic Gestational Age, as well as Sonographically Estimated fetal weight (g) and Actual weight at birth (g).
Both the menstrual age and sonographically estimated gestational age correlated positively, and the difference between the mean of the parameters was not statistically significant (p=0.659).
The mean sonographically estimated fetal weight (EFW) of the fetuses was 3124.44±392.3g, while the mean actual birth weight (ABW) of the fetuses was 3175.39±451.81g. The difference between both mean was not statistically significant (p=0.229).
In table 5 above, the mean actual birth weight (ABW) of fetuses of mothers with normal weight (BMI range of 18.5-24.9kg/m2), overweight (BMI range of 25.0-29. 9kg/m2) and those in the obese group (BMI above 30kg/m2) were 2896.67±215.08g, 2971.57±340.10g and 3405.56±455.92g respectively. The mean actual birth weight was observed to be increasing as the maternal body mass index (BMI) increases. There was also statistically significant difference in mean actual birth weight between the various categories of maternal BMI (p<0.001)
| Maternal BMI Categories | Mean Actual birth weight of fetuses ±SD | F(Anova) | P-value |
|---|---|---|---|
| Normal weight (18.5-24.9kg/m2) | 2896.67±215.08 | 31.488 | <0.001* |
| Overweight (25.0-29.9kg/m2) | 2971.57±340.10 | ||
| Obese (30kg/m2 and above) | 3405.56±455.92 | ||
| Mean | 3175.39±451.81 | ||
| *There is a Statistically Significant difference between the mean actual birth weights of babies born by mothers in the various BMI categories (p<0.001). | |||
Table 5: Comparison between the Mean actual birth weights of fetuses born by mothers in the differentcategories of BodyMass Index (BMI).
Table 6 illustrates that the sonographically estimated low weights, normal weights and large weight fetuses were 8(4%), 184(92%) and 8(4%) respectively (Table 6).
| Weight Categories | Estimated Fetal Weight (n) | Actual Birth Weight | p-value |
|---|---|---|---|
| <2500g | 8 (4%) | 13 (6.5%) | 0.091 |
| 2500-3999g | 184 (92%) | 173 (86.5%) | |
| ≥4000g | 8 (4%) | 14 (7%) | |
| There is no statistically significant difference between the number of sonographic estimates and the actual birth weight fetuses in each fetal weight category (p=0.091). | |||
Table 6: Number of sonographic estimates in each weight category and the corresponding numbers with actual birth weights.
Babies actually born with low, normal and large birth weights were 13(6.5%), 173(86.5%), and 14(7%) respectively. These are represented in both groups (EFW vs ABW), and majority of the fetuses had normal birth weights.
In both the microsomic and macrosomic group of fetuses, the fetal weight was underestimated on ultrasonography, while it overestimated the weight in the normal fetal weight category. However, the difference is not statistically significant p=0.091.
Table 7 compares the sonographically estimated fetal weight and the actual birth weight within the different fetal weight categories (Table 7).
| Weight Category(g) | EFW(Gram) | ABW(Gram) | Coefficient of correlation (r) |
P value |
|---|---|---|---|---|
| Microsomia: <2500 | 2399±20 | 2357±95 | 0.578 | 0.232 |
| Normal weight: 2500-3999 | 3114±319 | 3155±316 | 0.879 | 0.218 |
| Macrosomia:≥4000 | 4100±131 | 4186±129 | 0.833 | 0.152 |
| Overall | 3124±392 | 3175±452 | 0.906 | 0.229 |
| There were no statistically significant differences between the mean EFW and ABW of fetuses in each fetal weight category. | ||||
Table 7: Comparison of estimated fetal weight (EFW) with actual birth weight (ABW).
The sonographically estimated fetal (EFW) and actual birth weight (ABW) showed as strong positive correlation within each fetal weight category. The result also showed no statistically significant difference between the mean estimated and actual birth weight of fetuses for each weight category (p>0.05) (Table 8).
| Birth – weight Stratum | Estimated Fetal weight Mean±SD | P value |
|---|---|---|
| Overall | ||
| Mean error | 30.96±22.46 | |
| Mean absolute error | 145.74±135.29 | |
| Mean percentage error | 0.54±0.048 | |
| Mean absolute percentage error | 4.52±3.94 | |
| Estimate within ABW± 10% | 74.00% | |
| Pearson’s correlation coefficient | 0.906 | 0.229 |
| Microsomia: <2500g | ||
| Mean error | 24.41±13.02 | |
| Mean absolute error | 132.00±90.53 | |
| Mean percentage error | 0.51±0.044 | |
| Mean absolute percentage error | 5.64±3.92 | |
| Estimate within ABW± 10% | 79.80% | |
| Pearson’s correlation coefficient | 0.578 | 0.232 |
| Normal weight: 2500-3999g | ||
| Mean error | 25.98±14.32 | |
| Mean absolute error | 134.55±132.29 | |
| Mean percentage error | 0.52±0.039 | |
| Mean absolute percentage error | 4.23±3.94 | |
| Estimate within ABW± 10% | 72.30% | |
| Pearson’s correlation coefficient | 0.879 | 0.218 |
| Macrosomia: ≥4000g | ||
| Mean error | 48.38±33.41 | |
| Mean absolute error | 296.71±121.09 | |
| Mean percentage error | 2.31±0.954 | |
| Mean absolute percentage error | 7.08±2.93 | |
| Estimate within ABW± 10% | 80.90% | |
| Pearson’s correlation coefficient | 0.833 | 0.152 |
| There is no statistically significant difference between the EFW and ABW of fetuses within each fetal weight class. Also percentage of estimates within 10% of ABW was high. | ||
Table 8: Accuracy and percentage difference between actual birth weight and estimated fetal weight.
Table 8 above shows the overall mean errors, absolute errors in whole values and their percentages in estimating the fetal weight using ultrasound. It also shows the percentage of estimates that fell within 10% of the actual birth weight in each weight category. The mean actual error in estimating macrosomic babies was 48.38±33.41 while for microsomic babies, it was 24.41±13.02. The mean absolute errors in both weight classes were 296.71±121.09 and 132.00±90.53 respectively. The percentage of sonographic estimates within 10% of the actual birth weight in both the macrosomic and microsomic categories were 80.9% and 79.8% respectively.
The mean error in estimating normal weight fetuses was 25.98±14.32, and an absolute error of 134.55±132.99. The percentage of estimate within 10% of the actual birth weight in this category was 72.3%.
Overall, the mean actual error for all fetuses was 30.96±22.46, while the mean absolute error was 145.74±135.29. The mean absolute percentage error in estimating fetal weight using ultrasonography was 4.52±3.94, signifying minimal difference between the actual and estimated fetal weight. Also, the percentage of estimates within 10% of actual birth weight was 74.0%. This has a high positive correlation (r=0.906).
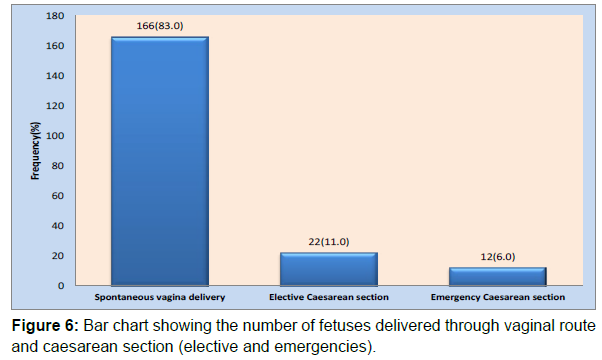
The various modes of delivery of the fetuses are pictorially represented in a bar chart Figure 6. Of the 200 fetuses, 166 (83%) were born vaginally, while the remaining 34 (17%) were delivered through caesarean section. Of the caesarean deliveries, 11% were elective, while 6% were emergencies (Table 9) (Figure 6).
| Mode of Delivery | Number of macrosomic fetuses | Number of microsomic fetuses | P-value |
|---|---|---|---|
| Spontaneous vaginaldelivery[SVD] following induction of labour | 10(71.4) | 11(84.6) | <0.001* |
| Delivery through Caesarean section (CS) | 4(28.6) | 2(15.4) | |
| Total | 14(100.0) | 13(100.0) | |
| *There is a Statistically Significant difference between the number of macrosonomic fetuses delivered vaginally and those delivered through caesarean section. | |||
Table 9: Mode of delivery of Macrosomic and Microsomicfetuses.
Table 9 further showed an analysis of the number of macrosomic and low birth weight fetuses delivered through the various routes. Ten (71.4%) of the macrosomic fetuses (fetal weight > 4000g), were delivered vaginally, while the remaining 4 were delivered through caesarean section. This difference between the number of macrosomic fetuses born through spontaneous vagina delivery and those delivered through caesarean section was statistically significant (p<0.001). Similarly eleven (84.6%) of the microsomic fetuses (fetal weight < 2500g) were delivered vaginally, while two (15.4%) were delivered via Caesarean section. The difference between both values was also statistically significant (p<0.001) (Table 10)
| Parity Group | Mean sonographic fetal weight (g) ±SD | Comparison of mean fetal weights between parity groups | P-value |
|---|---|---|---|
| Nulliparous | 3052±313 | Primipara versus Nullipara | 0.496 |
| Primiparous | 3011±352 | Multipara versus Nullipara | 0.001* |
| Multiparous | 3266±446 | Multipara versus Primipara | 0.001* |
| Grandmultiparous | 3120±00 | Grandmultipara versus Nullipara | 0.832 |
| *There is a Statistically Significant difference in the mean fetal weights between multiparas versus nulliparas, as well as between multiparas and primiparas (p= 0.001). Between Primiparas versus Nulliparas, and Grandmultiparas versus Nulliparas, there was no statistically significant difference. | |||
Table 10: Comparison of mean sonographic estimated fetal weights between parity groups.
Table 10 shows the mean sonographically estimated fetal weight between the various parity groups. The multiparous subjects had the highest mean fetal weight (3266±446)g. This was followed by the grand multiparous subjects with a mean sonographic fetal weight of 3120±00g. Conversely, the primiparous subjects had the least mean sonographic fetal weight (3011±352)g. Comparing the mean sonographically estimated fetal weights of babies born by subject in the different parity categories, it was observed that there was statistically significant difference in the mean sonographic fetal weights between multiparous and primiparous categories (p=0.001). However, there was no statistically significant difference between mean sonographic fetal weights of babies of primiparas and nulliparous mothers (p=0.496), as well as between grand multiparas and nulliparous subjects (p=0.852) (Table 11).
Table 11 above is a correlation matrix showing the relationship between the actual birth weight of the fetuses (ABW), with maternal age, gravidity, parity, body mass index (BMI), sonographic gestational age, and Estimated Fetal Weight in the study population.
| Correlations | ||||||||
|---|---|---|---|---|---|---|---|---|
| Actual weight at birth (g) | Age | Gravidity | Parity | BMI | Gestational Age | Estimated Fetal Weight (g) | ||
| Actual weight at birth (g) | r | 1 | .200** | .305** | .274** | .513** | .612** | .906** |
| p | 0.004 | 0 | 0 | 0 | 0 | 0 | ||
| Age | r | .200** | 1 | .624** | .586** | 0.071 | 0.068 | .168* |
| p | 0.004 | 0 | 0 | 0.316 | 0.339 | 0.018 | ||
| Gravidity | r | .305** | .624** | 1 | .766** | .145* | .228** | .332** |
| p | 0 | 0 | 0 | 0.041 | 0.001 | 0 | ||
| Parity | r | .274** | .586** | .766** | 1 | .166* | .149* | .303** |
| p | 0 | 0 | 0 | 0.019 | 0.036 | 0 | ||
| BMI | r | .513** | 0.071 | .145* | .166* | 1 | .349** | .485** |
| p | 0 | 0.316 | 0.041 | 0.019 | 0 | 0 | ||
| Gestational Age | r | .612** | 0.068 | .228** | .149* | .349** | 1 | .656** |
| p | 0 | 0.339 | 0.001 | 0.036 | 0 | 0 | ||
| Estimated Fetal Weight (g) | r | .906** | .168* | .332** | .303** | .485** | .656** | 1 |
| p | 0 | 0.018 | 0 | 0 | 0 | 0 | ||
| *.Correlation is significant at the 0.05 level (2-tailed); r = Pearson correlation, and p = significant/p-value. | ||||||||
Table 11: Correlation matrix showing relationship between Actual weight at birth (ABW), Age, Gravidity, Parity, BMI, Sonographic Gestational Age, and Estimated Fetal Weight in study population.
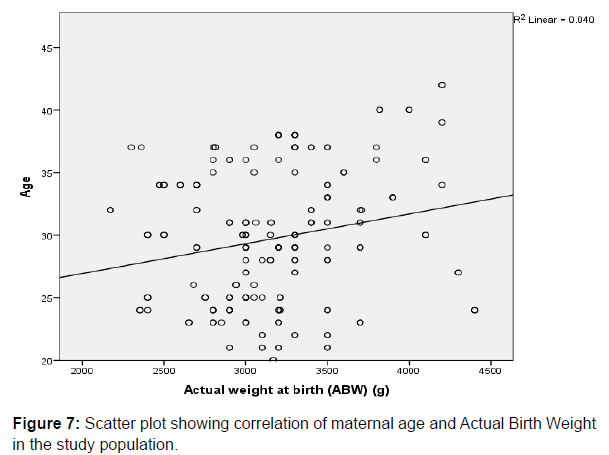
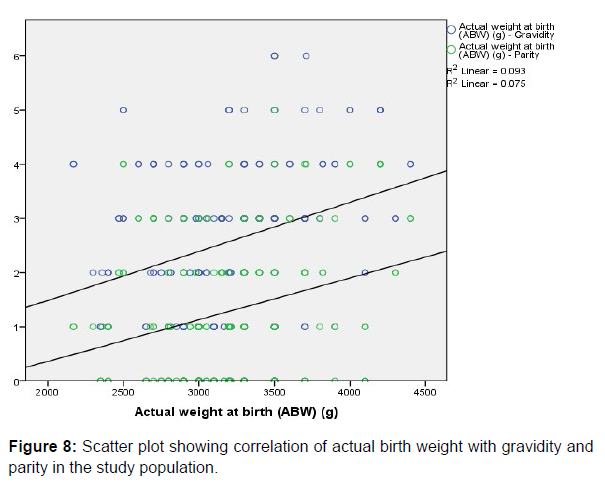
There was weak positive correlation between Actual Birth Weight and Maternal age (r=0.200, p=0.004), gravidity (r=0.305, p=0.000) and parity (r=0.274, p=0.000) respectively, and all the parameters were statistically significant. This is depicted in the respective scatter plots comparing the aforementioned variables in (Figure 7 & 8).
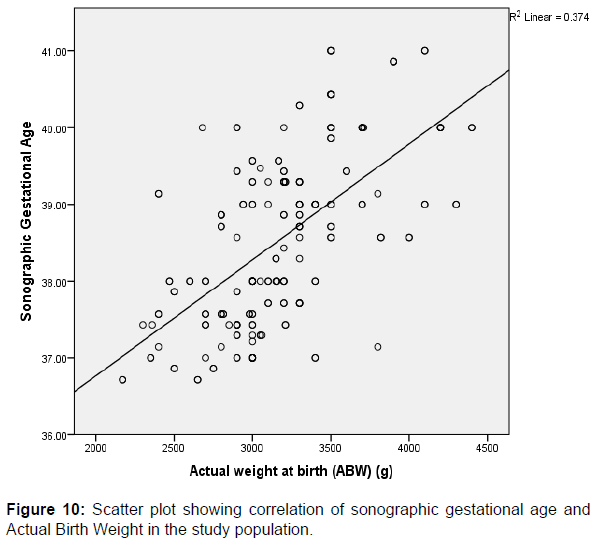
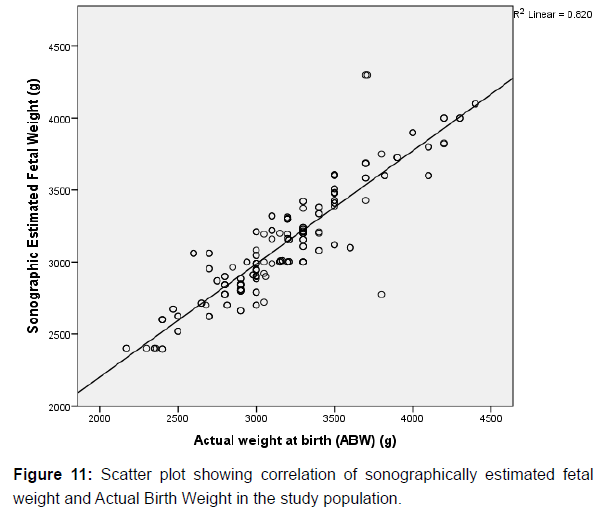
A strong positive correlation was also observed between the actual birth weights (ABW) and BMI (r=0.513, p=0.000), gestational age (r=0.612, p=0.000) and Estimated Fetal Weight (EFW) (r=0.906, p=0.000) respectively, and these were found to be significant among the study participants. These comparisons between variables are also graphically represented in scatter plots shown above in (Figures 9-11) respectively.
Discussion
A total of 200 pregnant women at term who met the inclusion criteria were randomly recruited for this study. This was similar to the number of participants recruited in a similar study done in South Eastern Nigeria by Njoku et al. [4]. Although both studies employed similar techniques, sonographic estimation of the fetal weight in this study was done within 24 hours prior to the delivery of the fetuses in order to improve accuracy of fetal weight estimation, as against the study by Njoku et al. [4], which had a longer interval (72hours) between the time of scanning and the delivery of the fetuses.
The mean maternal age in this study was 29.73±5.36 years, while the range was 20-49 years. The Mean maternal age in our study is similar to that observed in the research done by Njoku et al. [4] which had a mean value of 28.86±6.355 years, and a range of 16- 44 years, although, Njoku et al. [4] did not give any reason why the mean value was high. However, a reason that could possibly be adduced for the high mean maternal age in both studies is that, both studies were conducted in tertiary health institutions located in urban areas whose antenatal clinics usually have a large patronage predominantly by the elite and educated class of pregnant subjects. Such class of subjects usually do not begin child birth early enough, as they usually postpone child bearing to a later age after completing their education. The high percentage of subjects with both secondary and tertiary education constituting about 32% and 67% respectively in this current study clearly supports this assumption.
In this study a sharp decline in the number of recruited subjects above forty years of age was also observed. This is also similar to the findings by Uche et al. [24]. It is believed that after forty years of age, most women would have either completed their family size or are less inclined to conceive as previously suggested by Uche et al. [24].
The educational status of the subjects has an association with their social class and economic status. This may also have an influence on the maternal Body Mass Index (BMI), as well as the weight of the fetuses. In this current study, most of the women (67%) were educated up to the tertiary level. This may be attributable to the presence of 3 higher institutions of learning in the senatorial geopolitical zone of the State where this study was conducted. The high level of education that the mothers had could be the reason why they chose a tertiary health institution for their antenatal care and delivery, as against the use of traditional birth attendants and secondary level health care. However, other local studies did not elaborate on the educational status of their study participants.
Similar to an earlier study done by Uche et al. [1] in Lagos, Nigeria; in terms of parity distribution of subjects where the number of multiparous subjects were more (55.3%), it was also noticed in this current study that more subjects were multiparous (38.0%), compared to other parity groups, although, the percentage of multiparous subjects in the former was more. This larger proportion of multiparous subjects is possibly dependent on the total number of the recruited subjects in the study by Uche et al. [1] as they recruited more subjects (282), as against the 200 subjects recruited in this current study.
In this study, a significant number of the fetuses (92%) had Sonographically estimated fetal weight within the normal range (2500g to 3999g), and a mean actual birth weight (ABW) of 3175.39g±451.81. This corroborates the range of normal fetal weights which has previously been reported locally and internationally [19,27] although, the mean actual birth weight in this study was marginally lower than the values observed in previous local studies conducted by Uche et al. [1] Njoku et al. [4] Shittu et al. [19] and Tawe et al. [28], who reported the average fetal weight in their respective studies as 3242±508g, 3393±60g, 3254±622g & 3209.3±497.52g respectively.
Glen [27] in a similar study done in the United States of America noticed that the newborns of Africans and Asian decent were somewhat smaller than their American counterparts. The average birth weight of Caucasians was about 3.405g [27].
Also, a study done in the United Kingdom by Richard et al. [29] documented the mean actual birth weight of Caucasians to be about 3568±496g, a value which is higher than the mean sonographic and actual birth weight in this current study. Findings of a relatively lower mean sonographically estimated fetal weight and actual birth weight in this current study also corroborated findings in few other local studies [19].
Factors such as age and size of the parents, health status of the mothers, short interval between pregnancies and low socio-economic class have been adduced as some of the possible reasons for lower birth weights amongst newborns of African mothers [27]. Although this study did not critically investigate the above reasons, it is also possible that racial differences may have contributed, as previously reported by Hadlock et al. [30].
In this study, there was a strong positive correlation between estimated fetal weight and actual birth weight of the fetuses (r=0.906). Although, the mean values of the actual weight at birth (ABW) was higher than that of sonographically estimated fetal weight, there was no statistically significant difference between both values (p=0.229).This is an important observation which corroborated findings in a similar study done by Uche et al. [1] in Western Nigeria. In that study, a strong positive correlation was also observed between estimated fetal weight and actual birth weight with no statistically significant difference between the overall mean estimated fetal weight and actual birth weight. In addition, in this study, there was no statistically significant difference between the EFW and ABW in each of the fetal weight categories (p>0.05). These observations are also similar to the findings documented by Uche et. al. [1] other previous similar studies done in Nigeria, Europe and Asia also show positive correlation between EFW and ABW [1,4,19,23,24,27].
In this study, Bland and Altman plot (scatter plot) of the sonographically estimated fetal weight (EFW) against the actual birth weight (ABW) show that majority of the sonographic estimates fell within the 95% confidence interval with only a few which fell out of the line. These findings also suggests the positive correlation between the sonographically estimated fetal weight (EFW), and the actual birth weight (ABW), and as such, findings in this study are in consonance with the opinion of previous researchers that sonography is a good predictor of the actual birth weight [1,4, 19,26,28].
Accuracy of ultrasound estimated fetal weight was assessed using the mean actual error, absolute percentage error and sonographically estimated fetal weights which fell within 10% of the actual birth weight (ABW). A smaller mean absolute error (145.74±135.29) was observed in this study when compared to a similar study done in Nepal by Bajracharya et al. [31]. They recruited 150 pregnant women in their study, and noticed significant mean absolute error when using ultrasonography to estimate fetal weight (290±250g).
Overall, in this study, correlation between ultrasound estimated fetal weight and actual birth weight was strong (r= 0.906), with a mean percentage error of 0.54±0.048%. Also, the mean absolute percentage error in this study was 4.52±3.94%, a value which is low, and suggests minimal variability and difference between the estimated fetal weight and actual birth weight. These values are slightly lower than that documented by Tawe et al. [28] and Njoku et al. [4] who reported values of 7.48±5.35% and 9.04±7.61% respectively for the overall mean absolute percentage errors in their respective studies.
In this study, 74% of fetal weight estimations were within 10% of the actual birth weight. This clearly shows that ultrasonography had good accuracy, and it is thus reliable to use ultrasonography in estimating fetal weight at term. This implies that almost three quarter of the fetuses had their sonographic EFW within 10% of the actual birth weight (ABW), while the remaining one-fourth of the fetuses had their weight estimates more than 10% of the actual birth weights. This finding is comparatively similar to the findings documented by Tawe et al. [28] in Jos, Nigeria, where 75% of the ultrasonographically estimated fetal weights fell within 10% of the actual birth weights of the babies. Similarities in the inclusion and exclusion criteria for recruited subjects, as well as the use of similar fetal weight estimation models in the machines used might have accounted for this similarity in results.
Some authors in the past have studied the relationship between the maternal weight and its influence on the actual weight of the fetuses at birth [19,32,33]. Similarly, this study also evaluated the Body Mass Index (BMI), and its relationship with the actual birth weight of the fetuses. The mean BMI in this study was 30.64±4.85kg/m2 and the range was 23.6 to 49.6kg/m2.
A strong positive correlation was also observed between the actual birth weights and the maternal BMI in pregnancy (r=0.513, p=0.000). The parameters were statistically significant among the study participants. This is contrary to the observations noted in a previous study done by Sebastian et al. [34] in which they noticed a poor correlation between maternal BMI and fetal birth weight in normal and obese mothers. They therefore concluded that maternal obesity had no influence on the accuracy of sonographically estimated fetal weight, and regardless of the maternal or fetal size, ultrasonography is an accurate method for predicting fetal weight in both obese and normal pregnant subjects.
Previous studies have shown positive correlation between fetal weight and the parity. Studies done by Uche et al. [24] Pederson et al. [35] and Shah [36] showed that the birth weight of fetuses increased with increasing parity. Although, this current study corroborated their observations, it also noticed that the correlation between ABW, and parity was weak (r=0.0274, p=0.000).
In this study, ultrasonography under estimated the number of fetuses in both the microsomic and macrosomic group of fetuses, while it over estimated the numbers in the normal fetal weight category. However, the differences were not statistically significant (p=0.091). These findings are at variance with the findings from the study done by Shittu et al. [19], where ultrasonography underestimated all fetal weight categories, while clinical method overestimated the weight of macrosomic fetuses. With these aforementioned shortcomings of ultrasonography observed in this current study, the clinical method of fetal weight estimation may be helpful in cross checking sonographically measured weights particularly in cases of borderline sonographically low and large weight fetuses. Overestimation and underestimation of fetal weight may necessitate unnecessary obstetric operative intervention; hence borderline weights should be handled with utmost care. In this study, overestimation of the sonographic fetal weight amongst supposedly normal birth weight foetuses is partly responsible for some of the caesarean section deliveries. Although, both methods (clinical versus sonographic method) have been shown to be accurate in estimating the weight of fetuses, several researches have proven that the sonographic method is more accurate with lesser errors [4,19,32].
The weight of the fetuses may also influence the mode of delivery. Findings on the percentage of fetuses delivered through spontaneous vaginal route and caesarean section, mirrored the findings in previous studies especially that done by Njoku et al. [4] In this current study, majority of the fetuses (83%) were delivered vaginally (SVD), while the remaining 17%, were delivered through caesarean section. Njoku et al. [4] had documented 82% and 18% for vaginal and caesarean section deliveries respectively.
Also, in this study, four (4), and two (2) of the macrosomic and microsomic fetuses respectively were delivered through caesarean section. Although, subjects with obvious maternal comorbidities were excluded from this study, sonographically predicted large fetal weight, abnormal fetal presentation and lie, obstructed labour and previous caesarean sections were some of the major indications for caesarean sections amongst the study population.
The higher number of vagina births in mothers with macrosomic fetuses compared to Caesarean deliveries in this study may be partly due to the observation that a slightly larger population of the subjects were multiparous (38%), and as such, they are less prone to pregnancy related complications which may necessitate operative deliveries. Also, most patients regardless of their educational background, are not too inclined to undergoing caesarean section due to our African traditional and religious beliefs that women are supposed to give birth by themselves, hence, most would prefer to give vaginal delivery a try even in the presence of obvious contraindications.
Generally, vaginal delivery is still the safest mode of delivery for mothers in the absence of any contraindication [18]. In this study, the proportion of macrosomic fetuses delivered through vaginal route (71.4%) far outnumbered those delivered through caesarean section (28.6%). This is very similar to the observations by Ezegwui et al [18] who recorded 72.7% and 27.3% for vaginal and caesarean section deliveries of macrosomic fetuses in their study conducted at Enugu. Therefore, vaginal should be attempted in suspected cases of fetal macrosomia especially those with borderline values, provided there are no other serious indications for caesarean section. This would be of particular importance in women who have had previous uncomplicated vaginal deliveries for macrosomic fetuses, thus reducing the high prevalence of caesarean delivery and its attendant risks in future pregnancies and deliveries. In this study all delivered fetuses had good APGAR score, without any immediate complications after birth.
Co-morbidities like pregnancy induced hypertension, eclampsia, Chronic hypertension in pregnancy, Diabetes Mellitus and renal diseases in pregnancy etc, predisposes to obstetric complications which may necessitate operative deliveries. In this study, women with obvious co-morbidities were excluded. This presumably might have also contributed to the wide difference in the number of recorded births via Caesarean section compared to vagina deliveries in this study; a difference which was statistically significant amongst the study participants who delivered macrosomic fetuses (p<0.001).
Conclusion
This study has shown that there is a strong positive correlation(r=0.906) between the sonographically estimated fetal weight (EFW) at term, and the actual birth weight (ABW), with mean values of 3124±392, and 3175±452 respectively, and the difference between both mean was not statistically significant (p=0.229). Also, 74.0% of sonographic estimates fell within 10% of the actual birth weight measurements, thus making ultrasonography a very reliable and accurate tool for evaluating fetal weight and predicting the actual birth weight of fetuses. There was a strong positive correlation between the actual birth weight and the maternal body mass index (BMI), and a weak positive correlation between the actual birth weight (ABW) and parity.
Normal weight fetuses were overestimated, while low and higher birth weight fetuses were underestimated, with 12 (6%) of the total number of fetuses being delivered through emergency caesarean section. Therefore, it is advisable for borderline sonographically estimated fetal weights to be handled with care, and also carefully reassessed using the clinical methods of fetal weight assessment before making clinical decisions pertaining to the mode of delivery, so as to reduce the incidence of emergency operative delivery and its related complications.
Conclusion
This study has shown that there is a strong positive correlation(r=0.906) between the sonographically estimated fetal weight (EFW) at term, and the actual birth weight (ABW), with mean values of 3124±392, and 3175±452 respectively, and the difference between both mean was not statistically significant (p=0.229). Also, 74.0% of sonographic estimates fell within 10% of the actual birth weight measurements, thus making ultrasonography a very reliable and accurate tool for evaluating fetal weight and predicting the actual birth weight of fetuses. There was a strong positive correlation between the actual birth weight and the maternal body mass index (BMI), and a weak positive correlation between the actual birth weight (ABW) and parity.
Normal weight fetuses were overestimated, while low and higher birth weight fetuses were underestimated, with 12 (6%) of the total number of fetuses being delivered through emergency caesarean section. Therefore, it is advisable for borderline sonographically estimated fetal weights to be handled with care, and also carefully reassessed using the clinical methods of fetal weight assessment before making clinical decisions pertaining to the mode of delivery, so as to reduce the incidence of emergency operative delivery and its related complications
. Recommendations
1. The fetal weight should be sonographically estimated for all term pregnancies before delivery.
2. Studies to determine the accuracy of ultrasonography in estimating fetal weight in multiple gestations should also be encouraged.
3. Clinical method of fetal weight estimation should be used by Obstetricians as an adjunct in corroborating borderline fetal weights recorded during pre-delivery sonographic weight assessment, before taking decisions on mode of delivery in order to reduce the incidence of operative delivery and its attendant complications.
References
- Eze CU, Abonyi LC, Njoku J, Okorie U, Owonifari O (2015) Correlation of Ultrasonographic estimated fetal weight with actual birth weight in a Tertiary Hospital in Lagos, Nigeria. Afri Health Sci 15: 1112-1122.
- Mohammed Ma’aji, S, Odunko DD (2015) Accuracy of ultrasound in fetal birth weight estimation and sex determination in singleton term pregnancy from two tertiary institutions of North Western Nigeria. Sub-Saharan Afr J Med 2: 14-18.
- Warska A, Maliszewska A, Wnuk A, Szyska B, Sawicki W, et al. (2018) Current knowledge on the use of ultrasound measurement of fetal soft tissues for assessment of pregnancy development. J Ultrason 18: 50-55.
- Njoku C, Emechebe C, Odusola P, Sylvester A, Chukwu C, et al. (2014) Determination of Accuracy of Fetal Weight Using Ultrasound and Clinical Fetal Weight Estimations in Calabar South, South Nigeria. Int Sch Res Notices 2014: 970973.
- American Pregnancy Association (2012) Cephalo-Pelvic Disproportion (CPD). Complied using information from Scott et al, Danforth’s Obstetrics and Gynaecology, 9th edn.
- Shoulder dystocia (Green-top guideline, No. 42) (2012) Royal College of Obstet Gynecol. 2nd edn.
- Predanic M (2005) Sonographic assessment of the umbilical cord. ultrasound review of obstet gynecol 5: 105-110.
- Hendrix NW, Grady CS, Chauhan SP (2000) Clinical vs. sonographic estimates of birth weight in term of Parturients: a randomized clinical trial. J Reprod Med 45: 317-322.
- Hadlock FP (1991) In utero analysis of fetal growth: a sonographic weight standard. Radiology 181: 129-133.
- RCOG (2013) The investigation and management of the small-for-gestational age fetus Green – Top Guideline No. 31 Royal College Obstet and Gynecol 2nd edn.
- ACOG (2013) ACOG Practice bulletin no. 134: fetal growth restriction. Obstet Gynecol 121: 1122-1133.
- Fuchs F, Bouyer J, Rozenberg P, Senat MV (2013) Adverse maternal outcomes associated with fetal macrosomia: What are the risk factors beyond birth weight?. BMC Pregnancy Childbirth 13.
- Gardosi J, Madurasinghe V, Williams M, Malik A, Francis A (2013) Maternal and fetal risk factors for still birth: Population based Study. British Med J 346: f108.
- Gerald GN, Carl VS, Francisco T, Richard SL (2022) Estimation of fetal weight. Medscape J.
- American College of Obstetricians and gynaecologist Committee on Practice Bulletins-Obstetrics (2016) Practice Bulletin No. 173: Fetal Macrosomia. Obstet Gynecol 128: e195-e209.
- Firoozabi RD, Ghasemi N, Firoozabi MD (2007) Sonographic fetal weight estimation using femoral length: Honorvar equation. Ann Saudi Med 27: 179-182.
- Fleischman AR, Oinuma M, Clark SL (2010) Rethinking the definition of “term pregnancy”. Obstet Gynecol 116: 136-139.
- Ezegwui HU, Ikeako LC, Egbuji C (2011) Fetal macrosomia: Obstetric outcome of 311 cases in UNTH, Enugu, Nigeria. Niger J Clin Pract 14: 322-326.
- Shittu AS, Kuti O, Orji EO, Makinde NO, Ogunniyi SO, et al. (2007) Clinical versus sonographic estimation of fetal weight in Southwest Nigeria. J Health Popul Nutr 25: 14-23.
- Baker PN, Johnson IR, Gowland PA, Hykin J, Harvey PR, et al. (1994) Fetal Weight estimation by echo-planer magnetic resonance imaging. Lancet 343: 644-645.
- Yasmine K, Cannie MM, Kadji C, Dobrescu O, Zito LL, et al. (2013) Fetal weight estimation: Comparison of two-dimension ultrasound and magnetic resonance imaging assessments. Radiology 267: 902-910.
- Johannes S, Adams P, Michael B, Anne G, Bernd G (2018) Accuracy of immediate antepartum ultrasound estimated fetal weight and its impact on mode of delivery and outcome-a cohort analysis. BMC pregnancy childbirth 18: 118.
- Hulley SB, Cummings SR, Browner SB, Grady DG, Newman TB (2001) Designing Clinical Research. 4th edn; Lippincott Williams & Wilkins 6: 57-84.
- Eze CU, Ohagwu CC, Abonyi LC, Irurhe NK, Ibitoye ZA (2017) Reliability of sonographic estimation of fetal weight: A study of three tertiary hospital in Nigeria. Saudi J Med Med Sci 5: 38-44.
- Venkat A, Chinnaiya A, Gopal M, Monglli JM (2001) Sonographic estimation in South East Asian Population. J Obst Gynecol Res 27: 275-279.
- William EB (2001) The Core Curriculum: Ultrasound. 1st edn Lippincott Williams and Wilkins 431-435.
- https://hypertextbook.com/facts/2002/LeahOpphenheim1.shtml
- Tawe GS, Igoh EO, Ani CC, Pam SD, Multihid JT (2018) Correlation between ultrasound estimated fetal weight and in term pregnancy and actual birth weight amongst pregnant women in Jos. Jos J Med 12: 22-31.
- David RJ, Collins jr. JW (1997) Differing Birth Weight among infants of U.S Born Blacks, African-Born blacks, and U.S Born Whites. N Engl J Med 337: 1209-1214.
- Hadlock F., Harrist R., Sharman R (1985) Estimation of Fetal Weight with the use of head, body and femur measurements. A prospective study. Am J Obstet Gynecol; 151: 333-337.
- Bajracharya J, Shrestha NS, Karki C (2012) Accuracy of prediction of birth weight by fetal ultrasound. Kathmandu Univ Med J 10: 74-76.
- Ugwu EO, Udealor PC, Dim CC, Obi SN, Ozumba BC, et al. (2014) Accuracy of clinical and ultrasound estimation of fetal weight in predicting actual birth weight in Enugu, South Eastern Nigeria. Niger J Clin Pract 17: 270-275.
- Ohagwa CC, Onoduagu HI, Eze CU, Ochie K, Ohagwu CI (2015) Intra and Inter observer reproducibility study of gestational age estimation, using three common fetal biometric parameters: Experienced versus Inexperienced sonographer. Radiography 21: 54-60.
- Sebastian M, Gonzalez-Escudero A, Gonzalez-Peran E, Lopez-Griado M, Pineda A (2020) Influence of Maternal Obesity on the accuracy of ultrasonographic birth weight prediction. J Matern Fetal Neonatal Med 33: 3056-3061.
- Pederson CB, Sun Y, Vestergaard M, Olsen J, Basso O (2007) Assessing fetal growth impairments based on family data as a tool for identifying high-risk babies. An example with neonatal mortality. BMC pregnancy and childbirth 7: 28.
- Shah PS (2010) Parity and low birth weight and preterm birth; a systematic review and meta-analyses. Acta Obstet Gynecol Scand 89: 862-875.
Indexed at, Google Scholar, Crossref
Indexed at, Google Scholar, Crossref
Indexed at, Google Scholar, Crossref
Indexed at, Google Scholar, Crossref
Indexed at, Google Scholar, Crossref
Indexed at, Google Scholar, Crossref
Indexed at, Google Scholar, Crossref
Indexed at, Google Scholar, Crossref
Indexed at, Google Scholar, Crossref
Indexed at, Google Scholar, Crossref
Indexed at, Google Scholar, Crossref
Indexed at, Google Scholar, Crossref
Indexed at, Google Scholar, Crossref
Indexed at, Google Scholar, Crossref
Indexed at, Google Scholar, Crossref
Indexed at, Google Scholar, Crossref
Indexed at, Google Scholar, Crossref
Indexed at, Google Scholar, Crossref
Indexed at, Google Scholar, Crossref
Indexed at, Google Scholar, Crossref
Indexed at, Google Scholar, Crossref
Citation: Izevbekhai OS, Irabor P, Akhigbe A, Eluehike SU, Owolabi A, et al. (2023) Correlation of Sonographic Fetal weight in term Pregnancies with Weight at Birth in a Semi-Urban Tertiary Hospital in Southern Nigeria. OMICS J Radiol 12: 430. DOI: 10.4172/2167-7964.1000430
Copyright: © 2023 Izevbekhai OS, et al. This is an open-access article distributed under the terms of the Creative Commons Attribution License, which permits unrestricted use, distribution, and reproduction in any medium, provided the original author and source are credited.
Share This Article
Open Access Journals
Article Tools
Article Usage
- Total views: 2543
- [From(publication date): 0-2023 - Mar 29, 2025]
- Breakdown by view type
- HTML page views: 2264
- PDF downloads: 279
