Research Article Open Access
Correlation and Path Coefficient Analysis of Hot Pepper (Capsicum annuum L.) Genotypes for Yield and its Components in Ethiopia
Abrham Shumbulo1*, Mandefro Nigussie2, and Sentayehu Alamerew31Department of Horticulture, College of Agriculture, Wolaita Sodo University, Ethiopia
2Oxfam America, Horn of Africa Regional Office, Addis Ababa, Ethiopia
3Jimma University College of Agriculture and Veterinary Medicine, Jimma, Ethiopia
- *Corresponding Author:
- Abrham Shumbulo
Department of Horticulture, College of Agriculture, Wolaita Sodo University
Ethiopia
Tel: 251911396041
E-mail: shumbuloabrham@yahoo.com
Received date: April 11, 2017; Accepted date: April 22, 2017; Published date: April 22, 2017
Citation: Shumbulo A, Nigussie M, Alamerew S (2017) Correlation and Path Coefficient Analysis of Hot Pepper (Capsicum annuum L.) Genotypes for Yield and its Components in Ethiopia. Adv Crop Sci Tech 5: 277. doi: 10.4172/2329-8863.1000277
Copyright: © 2017 Shumbulo A, et al. This is an open-access article distributed under the terms of the Creative Commons Attribution License, which permits unrestricted use, distribution, and reproduction in any medium, provided the original author and source are credited.
Visit for more related articles at Advances in Crop Science and Technology
Abstract
Character correlation and path coefficient analysis study was conducted using 55 hot pepper genotypes with the objectives to assess the nature of character correlation at phenotypic and genotypic levels and direct and indirect effects of traits on yield and yield components. The experiment was conducted during 2015-20116 at six environments in Southern Ethiopia using RCBD with three replications. The result revealed that, in most cases, the genotypic correlation coefficients were higher than their respective phenotypic correlation coefficients indicating their inherent association of traits and hence more advantageous for breeding purposes. Phenotypic and genotypic correlation further confirmed that branch number per plant, fruit number per plant, fruit length, fruit diameter and fruit weight were the most important traits for improving the genotypes for higher fruit yield and may be applied for selection in hot pepper productivity. Path analysis revealed that the maximum direct effect on fresh fruit yield was exerted by dry weight (0.6686), average fruit length (0.2185), fruit diameter (0.2085) and average fruit number per plant (0.1444), Thus, on the basis of current result, fruit length, diameter and fruit number per plant could be the most important yield component characters which might be selected for yield improvement while the converse was true with plant height and stem girth (diameter) at phenotypic level.
Keywords
Hot pepper; Correlation; Fruit yield; Path coefficient
Introduction
Hot pepper (Capsicum annuum L.), in the family Solonaceae (2n=24), is an important spice and vegetable crop [1] which covers 67.98% of all the area under vegetables produced in Ethiopia [2]. The country have been producing paprika and capsicum oleoresins for export market. Because of its wide use in Ethiopian diet, the hot pepper is an important traditional crop mainly valued for its pungency and color. The crop serves as the source of income particularly for smallholder producers and also contributes significantly to house hold food security in many parts of rural Ethiopia [3]. When breeders attempt to improve plants, they are generally interested in upgrading several attributes of the phenotype simultaneously. The extent to which these characters are correlated will, therefore, influence the breeder’s success [4]. Moreover, development of high yielding cultivars requires knowledge of the existing genetic variation and the extent of association among yield contributing characters (Table 1). Since yield is a complex trait governed by a large number of component traits it is imperative to know the interrelationship between yield and its component traits to arrive at an optimal selection index for improvement of yield [5]. Therefore, selection should be done based on these component characters after assessing their association with the yield.
| SNo. | Genotype | Origin | Code |
|---|---|---|---|
| 1 | Melka awaze | Ethiopia | G1 |
| 2 | Marako fana | Ethiopia | G2 |
| 3 | Melka shote | Ethiopia | G3 |
| 4 | Melka zala | Ethiopia | G4 |
| 5 | AVPP9813 | Asian | G5 |
| 6 | AVPP0206 | Asian | G6 |
| 7 | AVPP0514 | Asian | G7 |
| 8 | AVPP0512 | Asian | G8 |
| 9 | AVPP0105 | Asian | G9 |
| 10 | AVPP59328 | Asian | G10 |
| 11-55 | F1-Hybrids | Cross | G11-G55 |
Table 1: Hot pepper genotypes used in the study.
The correlation between two variables indicates only that the variables are associated; it does not imply a cause and effect relationship [6]. To describe the phenotypic correlation values further, path coefficient analysis was done to identify characters having significant direct and indirect effects on fruit yield [7]. In such situation, the correlation coefficient may be confounded with indirect effect due to common association inherent in trait interrelationships. Path coefficient analysis has proven useful in providing additional information that describes a priori cause-and-effect relationships, such as yield and yield components [8]. Further, path analysis permits the separation of direct effect from indirect effect through other related characters by portioning the correlation coefficients [4,9]. Some researcher argue that Ethiopia is believed to be one of the center of diversity of hot pepper due to diversity of the existing germplasm in diverse growing agroecological zones in the country. Moreover, the crop is becoming high value cash crop since its demand is extremely growing locally and internationally. Despite its potential, existing variability for improvement works and current demand, the research conducted under Ethiopian condition is almost nil regarding traits association and yield component traits (Table 2). Therefore, the objectives of this study was to assess the nature of character correlation at phenotypic and genotypic level and direct and indirect effects of traits on yield and yield components.
| Source of variation | Degree of freedom | Mean square of cross product | Expected mean square of product |
|---|---|---|---|
| Location | L-1 | MSCPLxy | бexy+r бgLxy+g бrxy+rg бLxy |
| Replication /Loc | L(r-1) | MSCPrxy | бexy+g бrxy+r бgLxy |
| Genotypes | g-1 | MSCPgxy | бexy+rбgLxy+rL бgxy |
| Geno X Loc | (g-1) (L-1) | MSCPgLxy | бexy+rбgLxy |
| Error | (r-1)(g-1) | MSCPexy | бexy |
Table 2: Analysis of covariance.
Materials and Methods
Description of the study areas
The field experiment was conducted at six different environments (Wolaita Soddo, Alaba, and Humbo locations) that represent major pepper growing areas in the South Ethiopia for two cropping seasons in 2015 and 2016.
Treatments, experimental design and field management
The experiment consisted of 10 parents (six introduced from AVRDC (Asia) and four Ethiopian released varieties obtained from Melkasa Agricultural Research Center). These parents were crossed in half diallel mating design to give 45 F1 hybrids. Thus, parents and hybrids with a total of 55 genotypes were used in the study. The experiment was laid out using RCBD with three replications. Field planting was done using plant spacing of 70 × 30 cm between rows and plants, respectively. Each plot had 2 rows and 10 plants per row. The total plot area was 1.4 m × 3.0 m=4.2 m2. All other recommended agronomic practices were employed during field management as recommended by Melkasa Agricultural Research Center (MARC).
Data collected
Data were collected from randomly taken ten plants from each plot for yield, quality and other related traits. Plant height [cm], Plant canopy width [cm], Stem diameter [cm], Branch number per plant, Number of fruits per plant, Fruit length [cm], Fruit width [cm], Fruit weight [g], Fruit wall thickness [mm], Number of seeds per fruit, Total Fruit yield [kg/ha], Total fruit dry weight [kg/ha], and Oleoresin content [w/w%].
Statistical analysis
Correlation among traits: Correlation was calculated to investigate the degree of relationship between phenotypic and genotypic variances and also to test the degree of character association between parameters or traits studied.
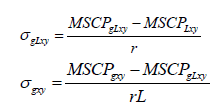
Where, r=Number of replications, g=Number of genotypes,
MSCPrxy=replication mean square of cross product for traits x and y,
MSCPgxy=genotypic mean square of cross product for traits x and y,
MSCPexy=environmental mean square of cross product for traits x and y,
бexy=MSCPexy;
According to Hartl and Jones, to test significance of phenotypic correlation coefficient, a quantity t can be calculated: 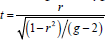
Where ‘r’ is the absolute value of the correlation coefficient and ‘g’ is number of genotypes.
If t is greater than the value given on the table using g-2 degrees of freedom, r can be considered significantly different from zero. The significance of genotypic correlation coefficient (rg), can be tested by t-value calculated
as: where, SEg-Standard error of rg

Where, h2 × and h2y-heritability of traits X and Y, respectively.
The calculated t value for each genotypic correlation coefficient was tested against tabulated t-value at (g-2) degrees of freedom.
Path coefficient analysis: The advantage of path analysis is that it provides information on the direct and indirect contribution of causal factors to the effect if the cause and effect relationship is well defined. Path coefficient can be defined as the ratio of standard deviation of the effect due to a given cause to the total standard deviation of the effects. If Y is the effect and X1 is the cause, the path coefficient for the path from cause X1 to effect Y is σx/σy [10].
It is computed by the following general formula:
rij=pij+Σ rij pkj
Where, rij–is the mutual association between the independent variable (i) and the dependent variable (j) as measured by correlation coefficient.
pij-is component of direct effect of the independent variable(i) on the dependent variable (j) as measured by correlation coefficient.
Σ rij pkj-is the summation of components of indirect effects of a given independent variable(i) on the dependent variable (j) via all other independent variables (k).
The residual effect (U) implies the unexplained variation of the dependent variable that is not accounted by path coefficient, was calculated using the formula:
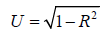
Where, R2=Σrikpkj
Results and Discussion
Phenotypic and genotypic correlation coefficients
The phenotypic and genotypic correlation coefficients of traits studied for 55 hot pepper genotypes at 6 different environments were presented in Table 3.1. The result revealed that in most cases the genotypic correlation coefficients were higher than their respective phenotypic correlation coefficients indicating their inherent association of traits and hence more advantageous for breeding purposes. Similarly, refs. [5,11,12] reported that magnitude of genotypic correlation coefficients in general was higher than the phenotypic correlation coefficients for traits studied on Chilli genotypes. Again ref. [13] noted the higher genotypic correlation coefficient than the phenotypic ones, which showed the inherent associations between various characters in Ethiopian Capsicums. The current result illustrated correlation coefficient range of -0.211 to 0.86 and -0.119 to 0.863 at genotypic and phenotypic levels, respectively. The result further illustrated that plant height was non-significantly correlated with most of the traits at phenotypic level except branch number (0.353) while at genotypic level it was positively and significantly correlated with canopy width (0.735), branch number per plant (0.369) and seed number per pod (0.321). However, plant height had non significant correlation with both fresh and dry pod yield at genotypic and phenotypic levels (Table 3.1).
| Traits | Ph | CW | BN | SD | FN | FL | FD | Tic | SN | yld | Dw |
|---|---|---|---|---|---|---|---|---|---|---|---|
| Ph | 1.00 | 0.735** | 0.369** | 0.216ns | 0.045ns | 0.027ns | 0.195ns | 0.089ns | 0.321** | 0.146ns | 0.171ns |
| CW | 0.672ns | 1.00 | 0.479** | 0.187ns | 0.086ns | 0.214ns | 0.327** | 0.330** | 0.281** | 0.250* | 0.147ns |
| BN | 0.353** | 0.476** | 1.00 | 0.638** | 0.468** | 0.140ns | 0.125ns | 0.120ns | 0.116ns | 0.354** | 0.405** |
| SD | 0.229ns | 0.200ns | 0.599ns | 1.00 | 0.434** | 0.358** | 0.052ns | 0.217ns | 0.019ns | 0.374** | 0.451** |
| FN | 0.113ns | 0.118ns | 0.445** | 0.424** | 1.00 | 0.040ns | -0.211ns | -0.15ns | -0.011ns | 0.482** | 0.649** |
| FL | 0.036ns | 0.203ns | 0.133ns | 0.338** | 0.045ns | 1.00 | 0.322** | 0.417** | -0.099ns | 0.544ns | 0.325** |
| FD | 0.121ns | 0.277* | 0.095ns | 0.048ns | -0.184ns | 0.311* | 1.00 | 0.706** | 0.545ns | 0.566** | 0.294* |
| Tic | 0.012ns | 0.239* | 0.087ns | 0.195ns | -0.119ns | 0.388** | 0.654ns | 1.00 | 0.287* | 0.525ns | 0.243ns |
| SN | 0.219ns | 0.207ns | 0.083ns | 0.002ns | -0.005ns | -0.090ns | 0.504ns | 0.238* | 1.00 | 0.239ns | 0.081ns |
| yld | 0.139ns | 0.249* | 0.335** | 0.369** | 0.497** | 0.496** | 0.512ns | 0.438** | 0.180ns | 1.00 | 0.860** |
| DW | 0.146ns | 0.145ns | 0.372** | 0.430** | 0.641ns | 0.288* | 0.247* | 0.183ns | 0.033ns | 0.863** | 1.00 |
Table 3.1: Genotypic (above) and phenotypic (below diagonal) correlation coefficient of selected traits for 55 hot pepper genotypes tested at 6 environments, 2015 to 2016.
The study confirmed the association of branch number and canopy width was significant at phenotypic (0.476) level. Furthermore, branch number had positively significant association with fruit yield (0.335) and dry weight (0.372) at phenotypic level and 0.354 and 0.405 at genotypic, respectively. Again branch number was significantly correlated with fruit number at both phenotypically (0.445) and genotypically (0.468). Fruit length depicted positive significant correlation at both phenotypic and genotypic levels with fruit width but it had positively significant association only at phenotypic level with fresh fruit yield. Some of earlier reports also show the same findings. Singh [5] reported highest phenotypic correlation between fruit length and fruit girth. Zhani [14] observed positive correlation between fruit weight and length.
Although non significant, fruit number showed negative association with fruit diameter and fruit thickness at both levels that might indicate antagonistic effects of gene actions which could not be bred simultaneously. This agrees with finding reported [7], where Fruit length had significant negative correlation with fruit width. Fruit number and fruit yield were associated significantly and positively at phenotypic (0.497) and at genotypic (0.482) level. Fruit number again genotypically positively associated with dry fruit weight. Generally, the current result exhibited that fresh pod yield had significant positive genotypic and phenotypic correlations with canopy width, branch number, stem diameter and fruit number while only at genotypic level with fruit diameter and phenotypically with fruit length. Dry weight also had almost similar association. Hence, these traits were found to be yield contributing characters towards increased fruit yield and dry weight. This also might indicate complementary gene actions for the traits which could be selected simultaneously. Therefore, branch number per plant, number of fruit per plant, fruit length, fruit diameter and fruit weight were the most important traits for improving the genotypes for higher fruit yield and may be applied for selection in hot pepper productivity. More of the same result was reported in ref. [13] who found high positive genotypic correlation of fruit yield with the number of fruits per plant and pericarp thickness. Usman [11] reported positive and highly significant phenotypic and genotypic associations of fruit length, fruit weight and number of fruits on pepper. Rohini and Lakshmanan [15] found positive and significant correlation of fresh fruit yield per plant with number of branches per plant, fruit length, fruit girth, individual fruit weight and number of fruits per plant. Earlier workers [16-18] also reported more or less same conclusion. Lavinia [19] confirmed the existence of strong correlation between fruit weight to fruit length and diameter and also number and weight of fruits per plant. They further concluded selection made towards increasing length and diameter can be used as indirect selection to obtain higher values of fruit weight.
Path coefficient analysis
The results of phenotypic and genotypic path coefficient analysis was presented in Table 3.2. and 3.3, respectively. Path analysis revealed that the maximum direct effect on fresh fruit yield was exerted by dry weight (0.6686), average fruit length (0.2185), fruit diameter (0.2085) and average fruit number per plant (0.1444) whereas plant height (-0.0173) and stem diameter (-0.0932) depicted negative direct effect and also negative indirect effects though the magnitude is relatively low (Table 3.2). Thus, on the basis of current result, fruit length, diameter and fruit number per plant could be the most important yield component characters which might be selected for yield improvement while the converse was true with plant height and stem girth (diameter) at phenotypic level. This result was consolidated in ref. [15] who reported the direct effect of number of fruits per plant and number of branches per plant on yield and, which could be considered as major yield components and selection indices for improvement. Kumar et al. [18,20,21] indicated that more fruits per plant were highly reliable component on fruit yield. Yatung et al. [22] found number of fruit per plant, fruit weight and number of seed per fruit were the most important traits affecting fruit yield per plant. This investigation also illustrated seed number per fruit and fruit pericarp thickness had positive direct effect but their indirect effect was more magnified through fruit diameter phenotypically indicating fruit diameter was important character both directly and indirectly for improvement and selection of pod yield in hot pepper. Sarkar et al. [7] noticed characters like seeds/fruit, fruit length and fruit width showed direct positive effect on fruit yield with low magnitudes but plant canopy width had negative direct effect on yield. Shimelis et al. [13] also confirmed similar finding.
| PH | Cw | BN | SD | FN | FL | FD | TIC | SN | DW | rP(yld) | |
|---|---|---|---|---|---|---|---|---|---|---|---|
| PH | -0.0173 | 0.0148 | 0.0038 | -0.0213 | 0.0164 | 0.0079 | 0.0252 | 0.0014 | 0.0099 | 0.0977 | 0.1385 |
| CW | -0.0116 | 0.022 | 0.0052 | -0.0186 | 0.017 | 0.0443 | 0.0578 | 0.0271 | 0.0094 | 0.0967 | 0.2493 |
| BN | -0.0061 | 0.0105 | 0.0109 | -0.0558 | 0.0643 | 0.0291 | 0.0199 | 0.0098 | 0.0038 | 0.2486 | 0.335 |
| SD | -0.004 | 0.0044 | 0.0065 | -0.0932 | 0.0613 | 0.0738 | 0.0101 | 0.0221 | 0.0001 | 0.2875 | 0.3686 |
| FN | -0.002 | 0.0026 | 0.0048 | -0.0395 | 0.1444 | 0.0098 | -0.0384 | -0.0135 | -0.0002 | 0.4288 | 0.4968 |
| FL | -0.0006 | 0.0044 | 0.0014 | -0.0314 | 0.0064 | 0.2185 | 0.0648 | 0.0439 | -0.0041 | 0.1929 | 0.4962 |
| FD | -0.0021 | 0.0061 | 0.001 | -0.0045 | -0.0266 | 0.0679 | 0.2085 | 0.0742 | 0.0228 | 0.165 | 0.5123 |
| TIC | -0.0002 | 0.0052 | 0.0009 | -0.0182 | -0.0172 | 0.0847 | 0.1364 | 0.1133 | 0.0108 | 0.1223 | 0.438 |
| SN | -0.0038 | 0.0045 | 0.0009 | -0.0002 | -0.0006 | -0.0198 | 0.1051 | 0.027 | 0.0453 | 0.0218 | 0.1802 |
| DW | -0.0025 | 0.0032 | 0.004 | -0.0401 | 0.0926 | 0.063 | 0.0515 | 0.0207 | 0.0015 | 0.6686 | 0.8625 |
|
Residual=0.325 |
|||||||||||
Table 3.2: Estimates of phenotypic direct effects (bold and diagonal) and indirect effects (off-diagonal) of traits via other independent traits on fresh pod yield of 55 hot pepper genotypes grown at six environments, 2015 to 2016.
| PH | Cw | BN | SD | FN | FL | FD | TIC | SN | DW | rg(yld) | |
|---|---|---|---|---|---|---|---|---|---|---|---|
| PH | 0.0186 | -0.0488 | 0.0157 | -0.0323 | 0.0103 | 0.0072 | 0.0418 | 0.0168 | 0.0198 | 0.0974 | 0.1465 |
| CW | 0.0136 | -0.0664 | 0.0204 | -0.028 | 0.0194 | 0.0576 | 0.0701 | 0.0622 | 0.0174 | 0.0837 | 0.2500 |
| BN | 0.0068 | -0.0318 | 0.0425 | -0.0954 | 0.1064 | 0.0379 | 0.0269 | 0.0226 | 0.0072 | 0.2305 | 0.3536 |
| SD | 0.004 | -0.0124 | 0.0271 | -0.1494 | 0.0986 | 0.0965 | 0.0114 | 0.0408 | 0.0012 | 0.2566 | 0.3744 |
| FN | 0.0008 | -0.0057 | 0.0199 | -0.0649 | 0.2272 | 0.0107 | -0.0451 | -0.0289 | -0.0007 | 0.3687 | 0.4820 |
| FL | 0.0005 | -0.0142 | 0.0059 | -0.0535 | 0.009 | 0.2697 | 0.0689 | 0.0786 | -0.0061 | 0.1846 | 0.5434 |
| FD | 0.0036 | -0.0217 | 0.0053 | -0.0078 | -0.0479 | 0.0868 | 0.2141 | 0.1331 | 0.0336 | 0.167 | 0.5661 |
| TIC | 0.0017 | -0.0219 | 0.0051 | -0.0324 | -0.0349 | 0.1125 | 0.1513 | 0.1884 | 0.0177 | 0.138 | 0.5255 |
| SN | 0.0059 | -0.0187 | 0.0049 | -0.0029 | -0.0026 | -0.0267 | 0.1167 | 0.054 | 0.0617 | 0.0463 | 0.2386 |
| DW | 0.0031 | -0.0098 | 0.0172 | -0.0674 | 0.1474 | 0.0875 | 0.0629 | 0.0457 | 0.005 | 0.5685 | 0.8601 |
| Residual = 0.273 | |||||||||||
Table 3.3: Estimates of genotypic direct effects (bold and diagonal) and indirect effects (off-diagonal) of traits via other independent traits on fresh pod yield of 55 hot pepper genotypes grown at six environments, 2015 to 2016.
The results of genotypic path analysis substantiated more of similar effects to that of phenotypic path analysis (Table 3.3). The analysis revealed the existence of positive direct effect of dry weight (0.5685), fruit length (0.2697), fruit number per plant (0.2272) and fruit diameter (0.2141) on fresh fruit yield. Moreover, the magnitude of genotypic direct effects exerted by these yield component characters were relatively higher than their respective phenotypic effects further substantiated the importance and close association of characters to improve yield or to use as selection indices. The result also illustrated that canopy width and stem diameter had exerted negative effects directly and indirectly through other characters that might lead to conclude in such a way that these traits could not be used for yield improvement in hot pepper production. The earlier worker [23] reported the high direct genotypic effect of fruit number per plant on fruit yield whereas plant spread had negative direct effect.
Fruit pericarp thickness showed positive direct effect on fruit yield but its indirect is exerted more by dry weight, fruit length and width. Hence, fruit length and diameter could be considered as characters of indirect selection genotypically to improve yield on hot pepper. In another scenario, both fruit diameter and length exerted their indirect effect via fruit thickness on fruit yield indicating the importance of fruit thickness for indirect selection. Patil [23] found at both phenotypic and genotypic level, the number of fruits per plant recorded positive direct effects. High direct and positive effect of number of fruit per plant [24] again number of fruit per plant and fruit diameter [25,26] on fruit yield had been reported. Kadwey [27] also investigated number of fruits per plant, number of primary branches per plant had positive direct Whereas, negative direct effect was recorded by plant height on fruit yield at genotypic level and fruit width positive indirect effect on green fruit yield via number of fruits per plant.
Conclusion
The phenotypic and genotypic correlation coefficients of traits revealed that, in most, cases the genotypic correlation coefficients were higher than their respective phenotypic correlation coefficients indicating their inherent association of traits and hence more advantageous for breeding purposes. Fruit number and fruit yield were associated significantly and positively at phenotypic (0.497) and genotypic (0.482) level. Fruit number again genotypically positively associated with dry fruit weight. Generally, the current result exhibited that fresh pod yield had significant positive genotypic and phenotypic correlations with canopy width, branch number, stem diameter and fruit number while only at genotypic level with fruit diameter and phenotypically with fruit length. Dry weight also had almost similar association. Therefore, branch number per plant, number of fruit per plant, fruit length, fruit diameter and fruit weight were the most important traits for improving the genotypes for higher fruit yield and may be applied for selection in hot pepper productivity.
Path analysis revealed that the maximum direct effect on fresh fruit yield was exerted by dry weight (0.6686), average fruit length (0.2185), fruit diameter (0.2085) and average fruit number per plant (0.1444). Thus, on the basis of current result, fruit length, diameter and fruit number per plant could be the most important yield component characters which might be selected for yield improvement while the converse was true with plant height and stem girth (diameter) at phenotypic level. The results of genotypic path analysis substantiated more of similar effects to that of phenotypic path analysis.
Acknowledgements
The authors like to thank Wolaita Sodo University and Jimma University College of Agriculture and veterinary medicine for their valuable contribution in both facilitation and financial support. Our recognition also extends to Melkasa Agricultural research center specially vegetable program staff for their cooperation in providing planting materials and AVRDAC for the same. Moreover, our special thanks goes to Prof. Derbew Belew for his unreserved contribution for material transfer from AVRDC.
References
- Gogula KR (2015) Development of Hybrids and their Stability in Chilli (Capsicum Annuum L.). PhD Dissertation, Department of Vegetable Science, Horticultural College and Research Institute, Dr. YSR Horticultural University.
- CSA (Central Statistical Authority) (2011/2012) Agricultural Sample Survey, Ethiopia.
- Shiferaw M, Alemayehu CH (2014) Assessment of Hot Pepper (Capsicum species) Diseases in Southern Ethiopia. International Journal of Science and Research (IJSR) 3:91-95.
- Vijaya HM, Gowda APM, Nehru SD (2014) Genetic variability, correlation coefficient and path analysis in chilli (Capsicum annuum L.) genotypes. Research in Environment and Life Science 7: 175-178.
- Singh PK, Kumar A, Ahad I (2014) Correlation and path coefficient analysis in yield contributing characters in Chilli, Capsicum annum L. International Journal of Farm Sciences 4: 104-111.
- Pierce BA (2003) Genetics: A Conceptual Approach. WH Freeman and Company, New York, USA.
- Sarkar S, Murmu D, Chattopadhyay A, Hazra P (2009) Genetic variability, correlation and path analysis of some morphological characters in Chilli. Journal of Crop and Weed 5:157-161.
- Gravois KA, Helms RS (1992) Path Analysis of Rice Yield and Yield Components as Affected by Seeding Rate. Agronomy Journal 84:1-4.
- Sharon T (1982) Path analysis in Pigeon pea. Indian Journal of Genetics 42:319-332.
- Singh RK, Chaudhary BD (1979) Biometrical Methods in Quantitative Genetic Analysis. Kalyani, New Delhi, India, p: 304.
- Usman MG, Rafii MY, Martini MY, Oladosua Y, Kashianic P (2017) Genotypic character relationship and phenotypic path coefficient analysis in chili pepper genotypes grown under tropical condition. Journal of Science Food and Agriculture97: 1164-1171.
- Pandit MK, Adhikary S (2014) Variability and Heritability Estimates in Some Reproductive Characters and Yield in Chilli (Capsicum annuum L.). International Journal of Plant & Soil Science 3: 845-853.
- Shimelis A, Bekele A, Dagne W, Adeferis TW (2016) Genetic Variability and Association of Characters in Ethiopian Hot Pepper (Capsicum annum L.) Landraces. Journal of Agricultural Sciences 61: 19-36.
- Zhani K, Hamdi W, Sedraoui S, Fendri R, Lajimi O, et al. (2015) Agronomic evaluation of Tunisian accessions of chili pepper (Capsicum frutescens L.). International Research Journal of Engineering and Technology (IRJET)2: 28-34.
- Rohini N, Lakshmanan V (2015) Correlation and Path Coefficient Analysis in Chilli for Yield and Yield Attributing Traits. Journal of Applied and Natural Sciences 4:25-32.
- Munshi AD, Behra TK, Gyanedra S (2002) Correlation and path coefficient analysis in chilli. Indian Journal of Horticulture57:157-159.
- Leaya J, KhaderKMA (2002) Correlation and path coefficient analysis in chilli (Capsicum annuum L.). Capsicum and Eggplant Newsletter21:56-59.
- Ullah MZ, Hasan MJ, Saki AI, Rahman AHMA, Biswas PL (2011) Association of correlation and cause-effect analysis among morphological traits in chilli (Capsicum frutescens L.). International Journal of Biological Research 10: 19-24.
- Lavinia S, Mado�?�? E, Giancarla V, Ciulca S, Av�?danei C, et al. (2013) Studies regarding correlations between the main morphological traits in a collection of bell pepper (Capsicum annuum var, grossum) local landraces. Journal of Horticulture, Forestry and Biotechnology 17:285-289.
- Kumar BK, Munshi AD, Joshi S, Kaur C (2003) Correlation and path coefficient analysis for yield and biochemical characters in chilli (Capsicum annuum L.).Capsicum and Eggplant Newsletter 22: 67-70.
- Yadwad A (2005) Genetic studies in chilli (Capsicum annuum L.) with particular reference to leaf curl complex. MSc Thesis, University of Agricultural Sciences, Dharwad, India, p:144.
- Yatung T, Dubey R, Singh V, Upadhyay G, Pandey AK (2014) Selection Parameters for Fruit Yield and Related Traits in Chilli (Capsicum annuum L.). Bangladesh J Bot 43: 283-291.
- Patil CA (2007) Genetic Studies in Capsicum (Capsicum annuum L.).MSc Thesis, University of Agricultural Sciences, Dharwad.
- Mishra AC, Singh RV, Ram HH (2002) Path coefficient Analysis in Sweet Peppers (Capsicum annuum L.) genotypes under mid hills of Uttaranchal. Veg Sci 20: 71-74.
- Vani SK, Sridevi O, Salimath PM (2007) Studies on Genetic Variability, Correlation and Path Analysis in Chilli (Capsicum annum L.). Annu Biol23: 117-121.
- Sharma VK, Semwal CS, Uniyal SP (2010) Genetic variability and character association analysis in bell pepper (Capsicum annuum L.). Journal of Horticulture and Forestry 2: 58-65.
- Kadwey S (2014) Genetic Variability, Correlation and Path Coefficient Analysis in chilli (Capsicum annuum L.).MScThesis. Department of Horticulture, College of Agriculture, Jawaharlal Nehru Krishi Vishwa Vidyalaya, Jabalpur, Madhya Pradesh, India.
Relevant Topics
- Agricultural science
- Agronomy
- Climate impact on crops
- Crop Productivity
- Crop Sciences
- Crop Technology
- Field Crops Research
- Hybrid Seed Technology
- Irrigation Technology
- Organic Cover Crops
- Organic Crops
- Pest Management
- Plant Genetics
- Plant Breeding
- Plant Nutrition
- Seed Production
- Seed Science and Technology
- Soil Fertility
- Weed Control
Recommended Journals
Article Tools
Article Usage
- Total views: 5285
- [From(publication date):
June-2017 - Jul 11, 2025] - Breakdown by view type
- HTML page views : 4131
- PDF downloads : 1154