Research Article Open Access
Correlating Core Analysis and Well Logging: The Stezyca Oil and Gas Field
Ardo BU*
Department of Geology, Modibbo Adama University of Technology, Yola, Nigeria.
- *Corresponding Author:
- Ardo BU
Department of Geology
Modibbo Adama University of Technology
Yola, Nigeria
E-mail: 85233mail@gmail.com
Received Date: May 29, 2016; Accepted Date: June 20, 2016; Published Date: June 27, 2016
Citation: Ardo BU (2016) Correlating Core Analysis and Well Logging: The Stezyca Oil and Gas Field. Oil Gas Res 2:113. doi: 10.4172/2472-0518.1000113
Copyright: © 2016 Ardo BU. This is an open-access article distributed under the terms of the Creative Commons Attribution License, which permits unrestricted use, distribution, and reproduction in any medium, provided the original author and source are credited.
Visit for more related articles at Oil & Gas Research
Abstract
Core analysis and Well logging are two essential procedures undertaken as part of the formation evaluation process which, when used alongside each other can help to determine fundamental properties of a reservoir and how these properties can affect hydrocarbon production. This report aims to provide an overview of these two procedures by considering the numerous properties which can be measured using data provided as well as considering the various types and methods of coring and well logging. The relationship between core and well log data has also been analysed using a case study (STEZYCA OIL AND GAS FIELD, located in Poland). By studying core and well log data acquired from this field, analysing and correlating both sets of data, it is possible to determine important properties such as porosity, permeability, lithlogy and saturation while also reducing uncertainty within the formation. The analysis was performed was on the basis of well log interpretation and core sample description (micro-photographs and cross-sectional view made available). The well logs analysed consisted of data from a Gamma Ray log, Neutron log, Density log, Sonic log and Resistivity log. Three samples have been analysed from the same well. Using the core samples, performing the required laboratory tests to obtain key parameters such as permeability, porosity, saturation, capillary pressure etc., are essential to fully evaluate the formation, but are not always sufficient. Correlation of core and well log data, is an essential process as is analysing and comparing data for calibration to characterise lithology. This is important in order to calibrate the data, reduce uncertainty and as a result, gain a more complete understanding of what to expect within the formation.
Keywords
Sonic log; Gamma ray log; Neutron log; Density log; Sonic log; Resistivity log; Steyzca oil
Introduction
Over the years, complexity of reservoirs has increased, therefore the necessity for reduced uncertainty and inefficiency has become crucial in order to ensure that important information about the reservoir is obtained.
This information, which includes the measurement of fundamental parameters and how these parameters affect hydrocarbon production, can answer key questions when analysing a reservoir, such as:
� The lithology of the reservoir
� Which fluids are contained in the reservoir
� The location and volumes of the fluids
With answers to these questions amongst others, it is possible to determine the productivity of a reservoir In terms of its ability to produce hydrocarbons (Halliburton). Core analysis and Well logging are two essential procedures undertaken as part of the formation evaluation process which can help to provide the above information. This report focuses on providing an overview of Core analysis and Well logging by considering the various parameters which can be measured using data provided as well as looking at the different types and methods of coring and well logging. The relationship between core and well log data has also been analysed using a case study (Stezyca Oil and Gas Field), by studying core data acquired, tests performed and well logs made available in order to correlate both sets of data to define the lithlogy, porosity, permeability and saturation
Coring and Core Analysis
During the exploration of a field, coring and core analysis is a very important part of the formation evaluation process, enabling the study of samples of reservoir rock to determine well conditions and as a result, the ability of the formation to produce hydrocarbons. Coring is also a means of obtaining additional information about the reservoir, unavailable from other sources such as well logs [1]. On the other hand, as well as being an additional source of information, coring can also be used to calibrate well log data in order to determine important reservoir properties. The process involves obtaining cylindrical samples of rock (cores) from a drilled well and analysing these cores in the laboratory to determine fundamental rock properties such as lithology, porosity, permeability and saturation of the various fluids in the formation. Knowledge of these properties can help to give an idea of whether a formation contains commercial amounts of recoverable hydrocarbons. In the past, core analysis was predominantly undertaken at the well site. However, nowadays, as technologies have become more complex, the process is almost entirely carried out in the laboratory.
Core samples can, however be analysed in the field, and this method has clear advantages:
� Core samples are analysed soon after removal from the reservoir, therefore changes in fluid saturation are minimised
� Data is obtained quickly as core samples are analysed on site
� Core analysis measurements can be combined with well logs and other data to enable decisions to be made based on a larger quantity of available data.
However, field analysis of cores can be highly expensive due to the requirement of portable equipment and skilled operators at the well site. For this reason, many companies decide against undertaking analysis at the well site, opting to transport core samples to the laboratory instead, Ubani et al. [2].
Types of Coring
Due to the large variety of formation types and environments for analysing samples, there are many different techniques for obtaining core samples from the well. Some of the main methods are described below:
Exploration diamond drilling
The well is drilled using a diamond coated drill bit which surrounds a hollow centre for storage of the core sample. This hollow centre is called a core barrel. Once the core sample is in the barrel, it is raised to the surface and retrieved, enabling drilling to continue. When raising the core sample to the surface, it is important to limit the amount of contact with the drilling fluid to minimise changes in rock properties. The dimensions of core samples retrieved using diamond drilling varies, ranging from a few millimetres to 150mm in diameter and from less than one metre to approximately 100m in length. A cheaper and quicker method of retrieving core samples is sidewall coring which involves obtaining smaller samples with a diameter of 1 inch and length of 1.75 inches. Sidewall cores are obtained extensively from soft sand areas, however it is also possible to analyse cores taken from harder formations. There are two different types of sidewall coring used to retrieve these samples:
Percussion sidewall coring
A process of obtaining core samples in which a sidewall coring tool containing explosives is lowered into the well. The explosives are used to propel a number of small, hollow, cylindrical tubes into the sides of the well to retrieve samples of the rock. As the coring tool is raised to the surface, the tubes, which are connected to the tool by wires, are pulled up as well. The samples recovered by this method are often shattered due to impact fracturing caused by the explosives, resulting in erroneous measurements of rock properties, however they are usually excellent for indication of lithology and interpretation of potential productivity.
Rotary sidewall coring
Small core samples are retrieved from the side of the well using a rotary sidewall coring drill. The rotary drill does not cause as much damage to core samples as percussion coring equipment, therefore reliable, accurate measurements of various rock properties can be made (Rigzone).
Types of Core Analysis
Core analysis is the process of studying core samples retrieved from the reservoir to determine important rock properties and how these properties affect the potential productivity of the reservoir. A number of different properties are of interest when analysing core samples. Some of the basic but essential properties such as porosity, absolute permeability and saturation can be measured using Conventional core analysis while Special core analysis is required to determine other, more complex parameters including capillary Pressure, relative permeability and wettability. Special core analysis provides vital, additional information about the pore structure and fluid mechanics of the reservoir, supplementing data obtained from conventional analysis to give a more complete understanding of reservoir performance.
Porosity measurement
Porosity is defined as a measure of the reservoir’s storage capacity. Mathematically, it is the pore volume divided by the bulk volume (Equation 1). Normally porosity ranges from 10% to 40.
Pore Vol (%)=(Vp/VB) × 100% (1)
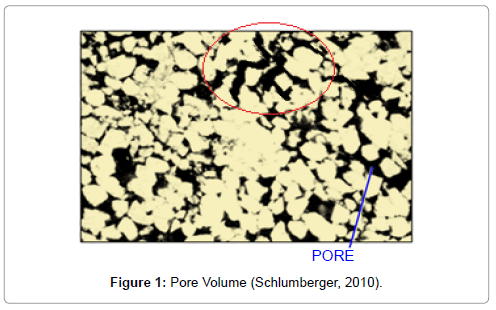
Note that when calculating the pore volume, one must consider whether the pore volume is interconnected or is isolated due to a secondary cementation. As for the effective pore volume, this refers to the interconnected pore space within the rock (Figure 1).
Different types of techniques being used to measure porosity of a rock sample are defined below:
• Boyles Law Technique
• Summation of Fluids
• Restorations Technique
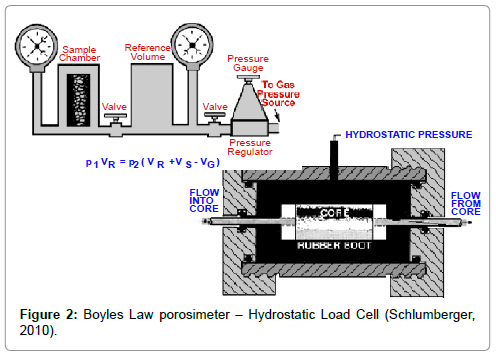
Considering the conditions from which the core sample was retrieved, it is necessary to consider the overburden pressure effects (Figure 2). Rocks analysed under laboratory conditions do not behave the same way as in a reservoir. Conditions change, as the rock at the surface is relieved from down hole confining pressures. Considering well packed, highly cemented rocks, the environment might change but the rock does not undergo major changes in volume when it is transported from reservoir conditions to surface conditions. As for unconsolidated or poorly consolidated rocks, expansion takes place. In order to accurately measure the porosity, the rock sample should be under the same pressure as the initial reservoir condition.
Permeability measurement
Permeability refers to the capability of a formation to convey or transmit fluids It can be calculated using the most important formula in the realm of petroleum engineering (Darcy’s Law), and is given as:
Incompressible fluid flow (Liquid)
 (2)
(2)
Compressible Fluid Flow (Gas)
 (3)
(3)
Permeability can be measured under laboratory conditions but in this case, the textural characteristics of the rock must be considered.
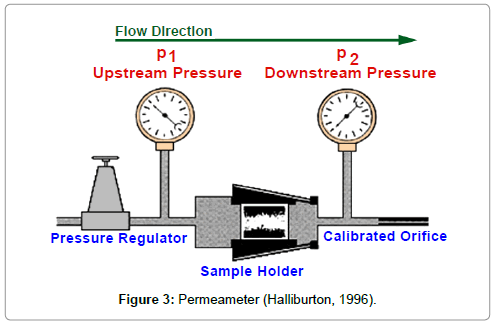
The permeameter, shown in Figure 3 is an apparatus used to measure permeability.
Saturation measurement
Saturation of a fluid is given by the ratio of the fluid volume to the pore volume in a given sample. It can be illustrated by equations 4, 5 and 6:
 (4)
(4)
 (5)
(5)
 (6)
(6)
Sw+So+Sg=1 (7)
Where:
Vw: Volume of water
Vo: Volume of oil
Vg: Volume of gas
Vp: Volume of pores
Sw: Water saturation
So: Oil saturation
Sg: Gas saturation
Core sample saturation can be measured in any of the following six ways:
� Direct Solvent Injection
� Centrifuge Flushing/Solvent Extraction
� Gas Driven Solvent Extraction
� Soxhlet Extraction
� Dean-Stark Distillation Extraction
� Vacuum Distillation
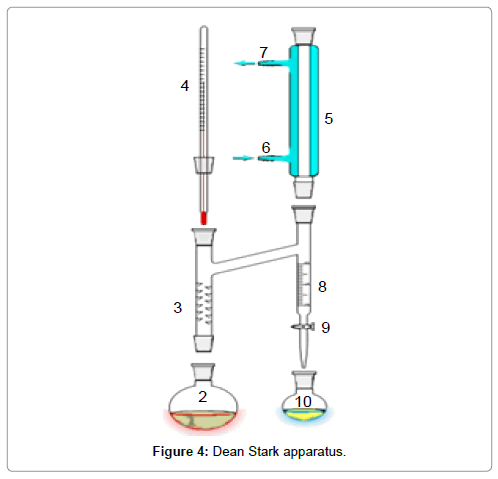
Let’s consider the Dean-Stark Distillation Extraction method. It is used to determine the water content of a core sample. To achieve this method, both water/solvent are made to vaporize, then re-condensed in a tube at the top of the Dean-Stark apparatus (Figure 4) and then the water is finally received in the chamber that is calibrated. As a result, the solvent undergoes an overflow and it seeps back into the sample. But the oil that was taken out of the sample remains in the solution. One can then calculate the oil content by determining the difference between the weight of water regained and the total weight of water lost through the processes of extraction and drying (Figure 4).
Well Logging
Well logging is the process of creating written record data which are gathered during the drilling of a borehole. The importance of well logging is that the records enable information about any characteristics of a reservoir in subsurface layers to be determined. Therefore, properties of a formation such as porosity, permeability, thickness and fluid saturation distribution can be evaluated. Additionally, physical properties including temperature, electrical current, radioactivity and sonic reflection can be detected by running tools into the wellbore. Although, local information about properties of a reservoir can be determined by collected cores from the well, electrical logging is the only source that gives continuous information or data about subsurface layers. The problem with the analysis data is that although the cores obtained during drilling can give very important information about the subsurface layers, when they are exposed to expansion and compression, the physical property of a rock sample can be changed significantly. Moreover, vibration during drilling can change their properties too. The saturation of the core can be changed due to contact with mud resulting in measurements of parameters such as porosity, permeability and saturation to be unreliable. As a result well logging plays a significant role in obtaining more reliable data..
There are 2 main methods of well logging:
Wire line logging
In this type, the tools are lowered into the well by a cable. The obtained data are transmitted to the surface recording system via the cable. In this method Well logging is performed after interruption or termination of drilling. Therefore, drilling must be stopped and therefore the well must be empty. This is a main disadvantage of this method.
Logging while drilling (LWD)
In this type, the logging device is attached on the drill and collected data are memorised in the tool. The data are downloaded to the surface record system when drilling is terminated or interrupted. LWD is efficient in horizontal drilling where wire line method cannot be applied.
Logging is classified by the type of well completion:
Open hole logging: Electrical, electromagnetic, nuclear or sonic tools can be introduced into open hole completed well to obtain required data.
Cased hole logging: This type is used after well completion. The main cased hole logs are Cement bound logging (CBL) and Variable density logs (VDL). Both logs are used to consider the process of well completion.
Different types of logs are required to determine various properties of rocks
Some of them are explained below.
1. Lithology logs
� Gamma Ray Logs
� Spontaneous Potential Logs
� Sonic logs
2. Porosity logs
� Density logs
� Acoustic logs
� Neutron logs
� Sonic logs
3. Resistivity logs
� Electrode logs
� Induction logs
4. Other logs
� Photoelectric logs
� Dipmeter logs and borehole imaging
� LWD (Logging While Drilling)
Gamma ray log
Gamma ray (GR) logs measure the natural gamma ray emissions from subsurface formations. It can be used in both open and cased holes as it can pass through steel casing. Gamma ray logs are mainly used for the following purposes:
� Correlation between wells
� Determination of bed boundaries
� Evaluation of shale content within a formation
� Mineral analysis
A high gamma ray response implies the presence of shale, while a low response implies the presence of clean sands or carbonates. There can be no standard gamma ray activity for shale, since shale is a mixture of clay minerals, sand, silts, and other inessential materials. GR logs are almost unaffected by porosity and are an excellent indicator of shale. Equation 8 can be used in order to calculate the volume of shale (Vsh.).
Vsh=GRzone – GRclean/GRSh – GRclean (8)
Where:
GRzone: GR in zone of interest
GRclean: GR at clean sand point
GRSh: GR at shale point
Gamma rays originate from three main sources in nature: the radioactive elements in the uranium and thorium groups, and potassium. Gamma ray is typically presented in track 1 on a linear grid. It is scaled in API units and its activity increases from left to right. Gamma ray tools are combination of a detector and the associated electronics which transfer the gamma ray count rate to the surface.
Density log
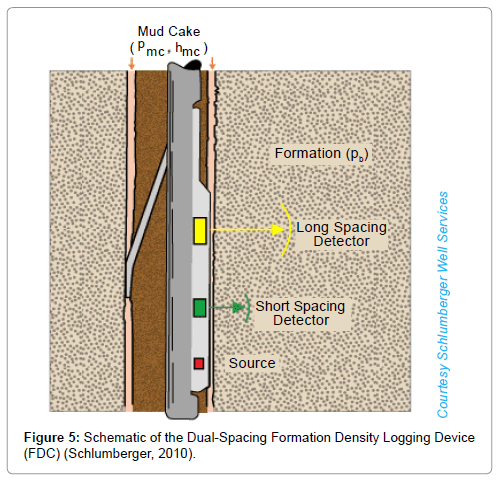
Generally, density logs are the key indicator of porosity in most wells by providing a value of formation bulk density (ρb). This is obtained using a density logging tool shown in Figure 5. The dual spacing formation logging device carries a gamma ray source and two detectors. Dense formations absorb many gamma rays, while lowdensity formations absorb fewer. Consequently, high-count rates at the detectors illustrate low-density formations, while low count rates identify high-density formations.
Neutron logs
Neutron logging is undertaken in combination with the density porosity reading in order to identify and correct effects of shale and gas. The neutron log curve will provide a good measure of formation porosity if liquid-filled pore spaces contain hydrogen, as is the case when pores are filled with oil or water. A small response illustrates a low hydrogen concentration which can be interpreted as gas presence, while oil and water have higher and almost the same concentration of hydrogen than gas.
Neutron tools are used mainly for:
� Porosity determination, usually in combination with density log data
� Gas detection, usually in combination with the density and sonic tool
� Shale volume determination, in combination with the density tool
� Lithology indication, in combination with the density log and/ or sonic log
� Formation fluid type.
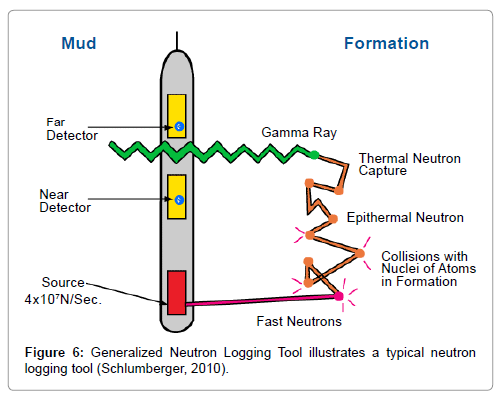
This information can be gathered in either open or cased holes, because neutrons are able to penetrate steel casing and cement. Neutron logging devices include one or more detectors and a neutron source that continuously emits energetic (fast) neutrons. There are two types of neutron porosity detectors, named for the energy levels of the neutrons they identify. One is the epithermal detector which counts neutrons with energies from a few tenths of an eV to approximately 10 eV. Another detector is a thermal detector that counts neutrons with energies around 0.025 eV.
Some principles of neutron logging are summarized below:
� A neutron source emits a continuous flux of high-energy
� Collisions with formation nuclei reduce the neutron energy -thereby slowing it down.
� At thermal energy levels (approximately 0.025 eV), neutrons are captured
� Neutron capture results in an emission of gamma rays
� Depending on the type of tool, the detector measures the slowed down neutrons and/or emitted gamma rays (Figure 6). Compensated and sidewall logs use corrections from their electronic panels to account for some variables, while neutron - GR logs require departure curves (provided in chart books) to make corrections. The following formula can be used for correction:
ΦNcor=ΦN - (Vsh × ΦNsh) (9)
Where:
ΦNcor: Corrected neutron porosity
ΦN: Apparent neutron porosity read from the neutron log
Vsh: Shale volume (correction required if > 5%)
ΦNsh: Apparent neutron porosity at the shale point
Resistivity logs
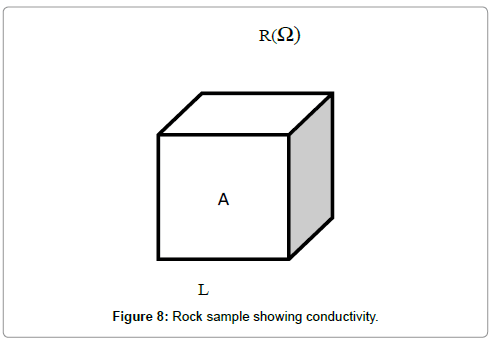
The resistivity of a substance is a measure of its opposition to the passage of electrical current. It is expressed in the units of Ω cm2/m or Ω.m
Re=Rc.L/A (10)
Where:
Rc: Electrical conductivity
Re: Resistance of the whole system
The resistivity of the electrolyte depends on concentration, type of dissolved salts and temperature. The concentration of dissolved salts is a measure of salinity which is expressed by ppm. All these factors affect the level of resistivity. For instance, resistivity decreases as salinity increases up to a maximum and dissolved salt impedes the passage of current carrying onions. Also, the resistivity of a solution is inversely proportional to the temperature (Figure 7). As a result, dry sedimentary formations have an extremely high resistivity and its conductive property is due to presence of saline water and mixture of hydrocarbon and saline water in the pore spaces.
Resistivity of rocks also depends on the following factors:
� Resistivity of water in pores: Rw
â�? Quantity of water present (Φ and Sw )
� Lithology, i.e nature, percentage of clay present and conductive materials.
� Texture of rock such as distribution of pores, clays and conductive materials
� Temperature
Sonic log
Sonic logs are mainly used in combination with other logs for the following purposes:
� Determination of porosity
� To improve interpretation of seismic records
� identifying lithology
� Estimating secondary pore space
� Estimating permeability
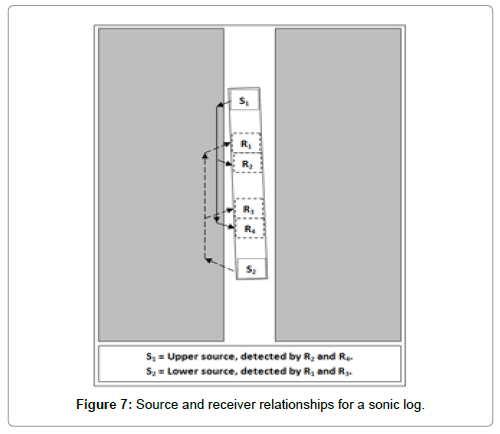
Sonic log tools consist of one transmitter and two or three receivers and all of these are located in single unit called a “sonde” as is shown in Figure 8. The receivers are placed various distances apart and the velocity is calculated by measuring the travel time from the transmitter to the receivers as shown in equation 11:
ΔT=Tfar - Tnear (11)
• Tfar: travel time to far receiver
• Tnear: travel time to near receiver.
Sound waves travel faster in high density formations than in low density ones (Figure 8).
Well log interpretation
Well logs can be used to determine important petro physical properties in a drilled borehole such as porosity, permeability and saturation. These parameters are not measured directly by well logging tools, they are derived by interpreting data provided by these tools.
Determination of Porosity from Well Logs
Porosity can be determined from one or a combination of well logs including:
� Density
� Neutron
� Sonic
Porosity values can be derived from a single log in clean, water bearing formations, where properties including lithology are known and this value can be corrected for various environmental effects.
Other factors such as the presence of hydrocarbons and shale influence the value of porosity obtained by well logs.
Determination of porosity from sonic log
The velocity of sound in sedimentary rocks varies depending on a number of factors including lithology and porosity distribution. Porosity reduces the velocity of sound in rock formations and therefore increases the transit time
The following equation provides a relationship between porosity and transit time for formations with uniform pore distribution:
 (12)
(12)
Where:
tlog: transit time reading from sonic log
tm: transit time of rock matrix
tf: transit time of fluid in pores
The value of porosity determined using this relationship is independent of the type of fluid present in the pore space of the rock. However in some formations which have high porosity and high saturation of hydrocarbons, the transit time is often greater than for highly water saturated formations. The presence of shale in the formation causes the value of porosity obtained from the sonic log to increase. This increase is due to the fact that transit time for shale is usually greater than that of sandstone. Pressure also has an effect on porosity obtained from the sonic log. The transit time decreases with increasing depth due to greater compaction of the formation. This results in a lower porosity value.
Determining porosity from Density log
Density logs respond to the electron density of formations. For single element substances, the relationship between electron density index and bulk density is:
 (13)
(13)
Where:
ρe: Electron density index
ρb: Bulk density of formation
Z: Atomic number
A: Atomic weight
The relationship for molecules is:
 (14)
(14)
Where:
ΣZ: Sum of atomic numbers
Mol Wt: Molecular Weight
The porosity of a formation can be calculated using the following equation:
 (15)
(15)
Where:
Ρm: Rock matrix density
Ρf: Density of fluid in pores of formation
Ρb: Bulk density from density log (only influenced by matrix and fluid density)
The presence of hydrocarbons in a formation can affect the density log reading. When low pressure gas occurs in the pore space, the apparent bulk density recorded on the log is lowered, resulting in a decrease in true bulk density. The effect of oil in the formation is much less as fluid density remains fairly similar.
Determination of porosity from neutron log
The readings obtained by the neutron log depend on the hydrogen index of the formation. This is proportional to the amount of hydrogen in the formation. It reflects the liquid filled pore space because oil and water contain similar amounts of hydrogen. The neutron log takes into account all the hydrogen in the formation, including hydrogen occurring in minerals in the formation. Porosity can be determined directly from the neutron log. However this value is very uncertain and needs to be corrected if other information such as lithology and presence of hydrocarbons are known from density and sonic logs.
As oil and water contain similar amounts of hydrogen, their hydrogen indexes are very close. Gas on the other hand, has much lower hydrogen content. This means that the neutron log provides a lower value of porosity when gas is present, close to the well. Gas regions can therefore be identified using results of other well logs alongside the neutron log.
The hydrogen index is dependent on the density of the hydrocarbon. The following equation can be used to give an approximate value of hydrogen index for light hydrocarbons with density less than 0.25:
Hh=2.2ρh (16)
Where:
Hh: Hydrogen index of hydrocarbon
ρh: Density of hydrocarbon
For heavy hydrocarbons, the following expression is used:
Hh=ρh + 0.3 (17)
The presence of shale in the formation gives a higher value of porosity because shale contains a reasonably large amount of hydrogen, and consequently a large hydrogen index.
Determining porosity in complex formations
If the matrix lithology is unknown, or contains many different types of minerals in varying proportions, accurate determination of porosity becomes more difficult using single well logs. It’s even more difficult if the response of the pore fluids in the region of formation investigated is very different from that of water, for example, gas. In these complex situations, it is necessary to cross plot the measurements from two different types of well logs in order to determine porosity. By combining results of different well logs, properties of complex formations can be identified to give a more precise value of porosity. Deciding which logs to combine often depends on the complexity of the lithology or proportions of minerals present.
Neutron/density cross plots
This combination of logs can be used to determine lithology and porosity in clean, liquid filled formations, but not when gas is present. The value of porosity provided by this combination is usually fairly accurate and does not vary much when incorrect matrix lithology is chosen to determine porosity from the cross plot.
Sonic/neutron cross plots
This combination of logs also provides good values of porosity with little error. The presence of evaporates however changes this and results in different porosity values when incorrect matrix lithology is chosen from the cross plot.
Sonic/density cross plots
Sonic/density cross plots are not so good for determining porosity but can be used to identify certain minerals.
If incorrect matrix lithology is chosen from the chart to determine porosity, this can result in a large error in the value of porosity. Error in the measurement of either sonic transit time or bulk density can also result in inaccurate readings of porosity and lithology.
Density/photoelectric cross plots
The photoelectric index and density log can be cross plotted to determine porosity and also to identify mineral types.
Determination of saturation from well logs
Water saturation can be determined using data from resistivity logs. It is assumed that all pore space not filled with water is occupied by hydrocarbons.
Clean Formations
In clean formations, the water saturation (Sw) can be determined using Archie’s water saturation equation:
 (18)
(18)
Where:
Rw: Resistivity of Water in the formation
Rt: True formation resistivity
F: Formation resistivity factor
In this equation, n is a constant and is usually assumed to be 2.
The formation resistivity factor (F) can be found using the following equation:
 (19)
(19)
Where:
a: Constant
m: Cementation factor
The accuracy of the measurements determined from the Archie equation depends on the three values put into the equation.
When equations 18 and 19 are combined, the following equation is formed:
 (20)
(20)
If: n=2, m=2, a=1, then:
 (21)
(21)
Therefore, when Rw is constant, porosity is proportional to 1/Rt0.5.
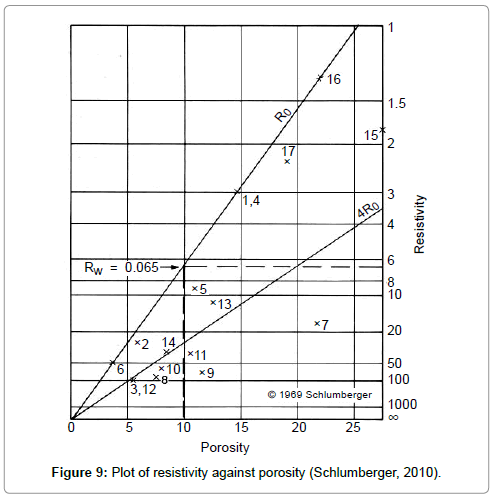
In a formation with 100% water saturation, Rt=Ro. Plotting Ro (when Sw=1) on an inverse square root scale against porosity generates a straight line on which all points should fall. The equation of this line is:
 (22)
(22)
Figure 9 shows an example of this plot where the upper line is for 100% water saturation. The value of Rw corresponds to the gradient of the line. In this case, Rw=0.065 ohm-m. The other line on the plot is for a formation water saturation of 50% (Sw=0.5). For any values of Sw other than 1, the relationship between Rt and Ro is given by:
 (23)
(23)
These plots of porosity against resistivity rely on certain assumptions and requirements which must be met:
• Water resistivity of the formation must be constant over the range plotted
• Lithology of the formation must be constant
• Invasion must not be deep
Shaly formations
The presence of shales in formations is very important when analysing well logs. They can affect electrical properties which in turn alter resistivity logs and therefore have a great impact on fluid saturations. It was found that the Archie equation, which provides a relationship between water saturation and resistivity, assumes that there is only one conductive material in the formation (water). This however is not the case if shale is present. In this case, the equation needs to be modified or developed to take into account the properties of shale in the formation.
Determination of Lithology from Well Logs
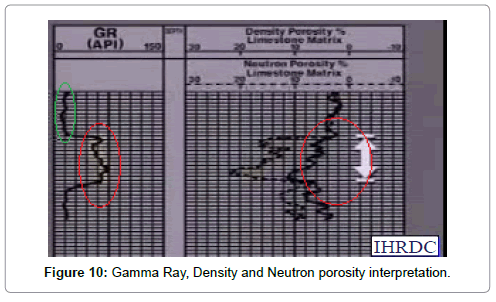
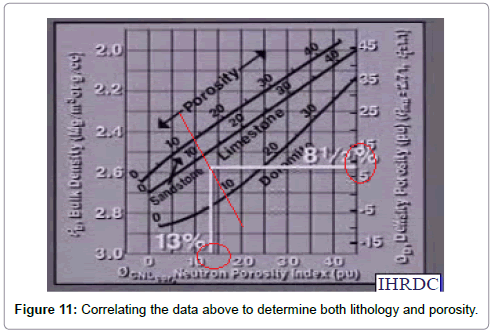
Being able to correctly identify the lithology can assist in well to well correlation. For example, the use of porosity logs for lithology identification is one of the steps. Considering the most simple case, say if the formation consists mainly of two minerals, reading from porosity logs used in correlation with cross-plots, can be useful when describing the lithology of a formation. Using the data acquired above, one can find both porosity and lithology of the rock (Figures 10 and 11). Core analysis was performed under laboratory conditions. The sample of core used was taken and examined to recover direct physical measurements to provide geological characteristics and engineering information, enabling better decision making in relation to other cored wells nearby. Furthermore, the data acquired from the core plugs to characterize the reservoir as a whole, on its own is never enough to validate and evaluate the formation. Here the use of well logs becomes extremely useful and a good engineer is able to use, capture and recognize this and use it to correlate both sets of data to better validate and evaluate the formation. In order to be able to analyse what was done on for the Stezyca oil and gas field in terms of analysis of cored samples and well logging data to better understand and evaluate the formation, we broke the analyses into two sections:
a) Core analysis of the cored samples S1,A1,A2
b) Correlation of well logging and core analysis
Core analysis
First, electrical measurements (Rt,RN,Ro) were recorded to obtain the cementation exponent m and saturation exponent n. Note that electrical properties are defined by the work done by Archie, which includes the Formation factor (F), presented below in equation 24, relating both the cementation and saturation exponents (equations 25 and 26) as referred above.
F= Ro/Rw (24)
Where:
Ro: Resistivity of the 100% saturated rock
Rw: Resistivity of the saturating Brine
m=logF/log Φ (25)
n=log (Rt/Ro)/(log sw) (26)
Knowing the cementation (m) and saturation (n) exponents is a fundamental step in core analysis as it provides better understanding of the digenetic alterations such as cementation itself, secondary porosity and mineralization.
Measuring Porosity (Φ) and Permeability (K)
Using the Helium porosity method, the porosity (Φ) was measured for the core plugs for wells S1, A1, A2, this in terms of vertical porosity (PORO-V), horizontal porosity (PORO-H) and average Porosity (ΔΦ) presented on the graph in Appendix 2 for the given depths. Permeability was also measured using gas as the standard fluid as it minimizes fluidrock reaction and is easy to use. For this, test gas was introduced into the sample, made to flow through the sample of measured length and diameter. The pressure drop across the sample was recorded and used to calculate the permeability using Darcy Law.
Darcy law
Because helium is a gas and it is compressible, permeability (K) is given as shown below, once Darcy’s law is rearranged.
Ka= Qa × Pa × u × L × 1000/(P1^2-P2^2) × A (27)
Permeability (Ka) calculated is referred to as the air permeability because this is the K resulting from use of a compressible fluid equation. There is a major factor that must be considered, which in turn affects the measured values for both horizontal and vertical permeability using gas and which is not considered based on the report analysis present for the Stezyca oil and gas field presented by the authors.This is defined as the Klimberg gas slippage effect - one of the main factors affecting the measurement of permeability when gas is used. At atmospheric pressure, the gas molecules are so far apart that they slip through the pore spaces with little or no friction loss and so yielding higher values of permeability (K). But, say if this occurs at atmospheric pressure, at higher pressure, 1000 psi or greater, the gas molecules will experience friction drag at the side of the pore, acting more like a liquid. This means that the measured values of K decrease as the test laboratory pressure used to measure permeability increases. This is a fact to consider, as it happens very often but it was discarded. Therefore the test performed to acquire permeability (K) leaves some discrepancy.
Mineralogy
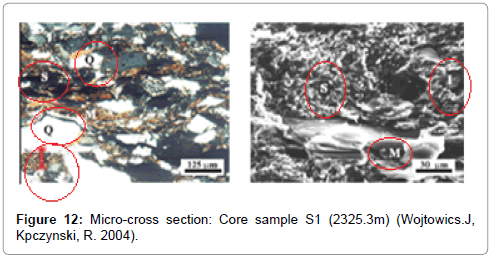
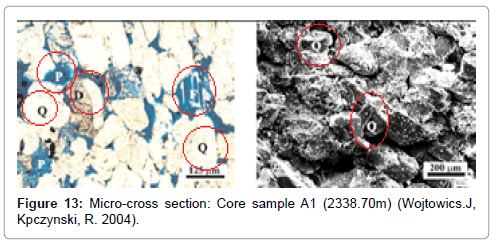
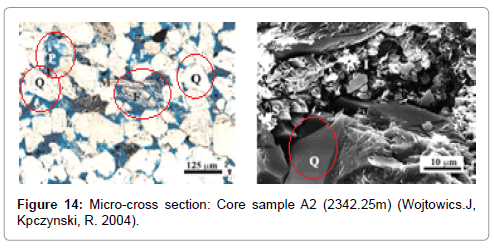
The mineralogy is a key parameter. One of the tests used to define the mineralogy of the formation is called X-Ray Diffraction Method. This technique is used to reveal information about the physical properties, characteristics of the material presented on well S-7 (Figures 12-14 and Appendix 1) - column 1,2 including core description and mineralogy where clays, carbonates, feldspars and quartz are predominant.
Analysis: Sample S1 shows laminated siltstones. Referring to geology, this shows that cyclic changes may have occurred in the deposition of sediments. This in turn affects the grain size, clay content (%) or mineral contents. This is pronounced by the difference of colour. At (Q), angularity of the grain sizes is pronounced, defining the sorting (poorly sorted, low permeability) of the quartz grains, (M) shows muscovite and (S) shows siderite. Clay content is shown by (I) (Figure 13).
Analysis: Sample A1 - Better sorting of grains. Mostly dolomite (D), visible pore spaces (P) with porosity of 15% and permeability at 100mD. Overall medium grained better rock properties.
Analysis: Sample A2 - Overall, compared with previous samples, it shows well sorted and even distribution of material with quartz (Q), Feldspars (F), muscovite (M). Pore spaces are also visible, indicating higher porosity (14% or more) (P) but low permeability.
Capillary pressure measurement
This is referred as one of the special core analysis test, where data obtained is used to define initial water saturation. The method used to measure capillary pressure is referred to as: Mercury Injection [3]. The injection of mercury provides maximum number of pore throat distribution data but with one disadvantage which is that at the end of the test, the sample is no longer of use [4].
Core Analysis and Well Logging Correlation
Lithology
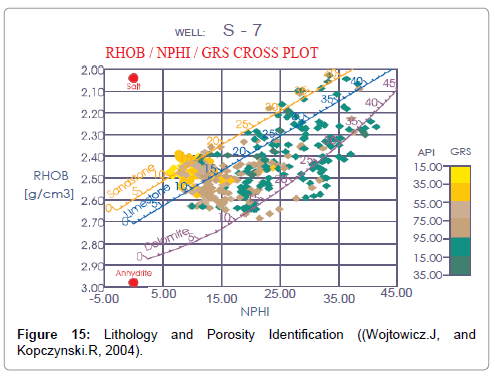
Starting by correlating the data to put together the lithology column, the microscopic description of core samples, XRD Analysis is used to define mineralogy and the OM,SEM photomicrographs of the main rocks (Figures 12-14, Appendix 1 and 2) and the diverse well logs available(GR, NPHI, RHOB, DT, exponent m -n), (Appendix 3), were used in combination to generate the lithology column in correlation to previous studies performed in the area. According to the author, the lithology column consists mostly of sandstones, siltstones, shale and coal, which is quite accurate compared with the mineralogy and volumetric analysis performed [5,6]. Appendix 1: column 2 and 3 show the predominance of Quartz within the sandstones. Overall to better validate the lithology, both core data acquired and well logs were used. Looking specifically at the core samples retrieved (S1- 2325m, A1-2338.7m, A2-2342m). Considering the cross-section micro-photographs (Figures 12-14) and the well log data (Appendix 1, 2, 3), (Table 1) was constructed. The data presented in Table 1 was measured using the well log provided and correlated with (Appendix 2 and 3). Table 1 shows low GR response (SAND), verified by the low % of shale, showing that the core samples retrieved, in terms of porosity match with the porosity data acquired from the laboratory analysis. However Neutron log response is low (Low hydrogen concentration– gas presence) and can be verified by the small response in density (High Hydrocarbon content). Looking also at the resistivity log for the core samples (S1-2325m) we can say that there is a low response in Gamma Ray and High response in Resistivity (This is an oil and gas bearing formation as stated previously). As for core sample (A1) and (A2), there is a low response in resistivity, this implies that at those sections we have oil and gas or water and gas contact. Using the crossplots presented in Figure 15, for the tested samples (S1, A1, and A2), the lithology column was constructed and correlated using the log and cross-section presented in Appendix 2 (Figure 15). By plotting the data presented on the well logs, one can find the lithology/porosity and correlate it with the data acquired during the laboratory tests to calibrate the well logs for better formation evaluation [7,8].
| Point | PEF | GR | ΦN | V.sh(%) | Φ(%) | Lith | Pb |
|---|---|---|---|---|---|---|---|
| S1 | 2.8 | 45 | 0.26 | 25 | 23 | Sand | 2.45 |
| A1 | 2.4 | 39 | 0.25 | 30 | 20 | Sand | 2.42 |
| A2 | 2.2 | 55 | 0.27 | 27 | 18 | Sand | 2.45 |
Table 1: Well log data-Verifying data presented by the author.
Correlation of Porosity and Saturation
Initially, during the laboratory tests, porosity and saturation parameters were recorded. The same data is now plotted against the calculated effective porosity (equation 28) acquired and the cementation (m=2) and saturation (n=2) exponent.
Effective=ΔФn × (1-Vshale) ( 28)
(Appendix 2), column 7, 8, 9, show the calculated effective porosity in comparison with the core measured average porosity, considering initial cementation exponent m=2, and saturation exponent n=2 (this was an assumption) and re-plotted using the calculated cementation exponent m=1.8 and n=2.35 and the permeability (equation 29). The core samples are mostly sandstones with very low presence of shale, with overall high response in effective/average porosity and Permeability, where cementation and saturation exponents have little effect.
Log K=aФ+b (29)
Where:
a=0.357, b=3.37
The correlation of these data parameters acquired from both core samples and well log data, considering the lithology, mineralogy, calculated and effective porosity with actual expected permeability, provides a better understanding of what to expect at those depths based on the material retrieved and correlations made and therefore reducing the uncertainty and providing better estimation [9].
Conclusion
Using the core samples, performing the required laboratory tests to obtain key parameters such as permeability, porosity, saturation, capillary pressure etc., are essential to better evaluate the formation, but are not always sufficient. Correlation of core and well log data, analysing and comparing data for calibration and to define the lithology, is an essential process, if one is looking to optimize the data, reduce uncertainty and ultimately gain a better understanding of what to expect within the formation.
References
- Darling T (2005) Well logging and formation evaluation Elsevier.
- Ubani CE, Adeboye YB, Oriji AB (2012) Advances in coring and core analysis for reservoir formation evaluation Petroleum & Coal. 54: 42-51.
- Purcell WR (1949) Capillary Pressures-Their Measurement Using Mercury and the Calculation of Permeabilities. There from Trans AIME, Vol-186, p: 39.
- Rafdal J (1996) Coring analysis to calibrate well log interpretation advances on core evaluation I reservoir appraisal. Gordan and Breach Science Publication.
- Shirer JA, Langston EP, Strong RB(1978) Application of Field-Wide Conventional Coring in the Jay-Little Escambia Creek Unit. Journal of Petroleum Technology,pp: 1774-1780.
- Slobod RL, Chambers A, Prehn WL(1951) Use of Centrifuge for Determining Connate Water Residual Oil and Capillary Pressure Curves of Small Core Samples. Trans AIME, Vol-192, p: 127.
- Torsaeter O, Abtahi M (2000) Experimental Reservoir Engineering Laboratory Workbook Department of Petroleum Engineering and Applied Geophysics. Norwegian University of Science and Technology.
- Yan J (2002) Reservoir parameters estimation from well log and core data: a case study from the North Sea Petroleum Geoscience. Vol-8, pp: 63-69.
- Society of Petroleum Engineers (1998).
Relevant Topics
Recommended Journals
- Oil & Gas Research Journal
- Renewable Energy and Applications Journal
- Oceanography Journal
- Industrial Pollution Control Journal
- Coastal Zone Management Journal
- Climatology & Weather Forecasting Journal
- Geoinformatics & Geostatistics Journal
- Engineering and Technology Journal
- Petroleum & Environmental Biotechnology Journal
- Polymer Sciences Journal
Article Tools
Article Usage
- Total views: 28866
- [From(publication date):
August-2016 - Jul 15, 2025] - Breakdown by view type
- HTML page views : 26877
- PDF downloads : 1989

