Research Article Open Access
Controlling the Output Error for Photo Catalytic Sensor (PCS) Using Fuzzy Logic
Whig P1* and Ahmad SN21Vivekananda Institute of Professional studies, New Delhi, India
2Department of Electronics and Communication Engineering, Jamia Millia Islamia, New Delhi, India
- *Corresponding Author:
- Whig P
Vivekananda Institute of Professional studies, New Delhi, India
Tel: 09811908699
E-mail: pawanwhig@gmail.com
Received date: March 21, 2017; Accepted date: March 31, 2017; Published date: April 07, 2017
Citation: Whig P, Ahmad SN (2017) Controlling the Output Error for Photo Catalytic Sensor (PCS) Using Fuzzy Logic. J Earth Sci Clim Change 8:394. doi:10.4172/2157-7617.1000394
Copyright: © 2017 Whig P, et al. This is an open-access article distributed under the terms of the Creative Commons Attribution License, which permits unrestricted use, distribution, and reproduction in any medium, provided the original author and source are credited.
Visit for more related articles at Journal of Earth Science & Climatic Change
Abstract
This paper presents novel method to control output error of the Photo Catalytic Sensor (PCS) using fuzzy interface. Whig and Ahmad in 2014, proposed the spice model of PCS which is a type of ion sensitive FET and very useful to estimate the parameter BOD (Biological Oxygen Demand) which is generally used to estimate quality of water. PCS can also be used to calculate the amount of concentration level of oxygen required to purify the polluted air and sanitization of surface. The purpose to control the output error due to variation in temperature is due to the fact that the fluctuation of O2 influence the threshold voltage, which is internal parameter of FET can manifest itself as a voltage signal at output but as a function of trans conductance gain. Hence, a system controlled by fuzzy logic which control the output error is proposed. This novel method is very useful because of their simplicity, robustness and successful practical applications. The proposed system is fast in operation which is further helpful for PCS which operates under sub-threshold conditions and reduced computation time. The system is user friendly and the outcomes of simulation are fairly in agreement with the theoretical estimation.
Keywords
Fuzzy rules; Fuzzy interface; Photo Catalytic Sensor (PCS); Field Effect Transistor (FET)
Introduction
Environment plays an important role on the outputs of electronic sensors and systems. Electronic sensors used for very precise measurements perform very well under lab environment [1]. Complementary metal oxide semiconductor (CMOS) technology is very popular and commonly used Now a days for sensor development as it provides an advantage of low power, high speed, small size integration and their signal processing capability. More often, Computre Aided Design (CAD) tools are used, which provide wide contribution in simulation and synthesis of semiconductor sensors. The Simulation Program for integrated circuit emphasis (SPICE) has built in models for most semiconductor devices but there is scarcity of suitable models for semiconductor sensors. Modeling of MOSFETs [2] requires a deep acquaintance of the code structure, subroutines and it is austerely linked to a particular version of SPICE. The simplest PCS is O2 sensitive in which the sensitive surface is made up of insulator layer like titanium oxide (TiO2) exposed to an electrolyte solution. A p-type semiconductor and TiO2 insulator are placed into aqueous electrolyte solution where the response of PCS to O2 can be described in terms of photo catalysis. In the submicron level the thickness of gate oxide is very minor in dimension. As the aspect of gate oxide decreases this result in tunnelling of charge carriers which significantly increases the leakage current of MOSFETS and results in the decrease of device reliability [3,4]. One way to remain tumbling dimensions is possible by using materials having much sophisticated permittivity than silicon dioxide.
In these Ion Sensitive types of sensors, the output change sometimes is deterministic in nature and sometimes random. The sensor output recorded is not consistent with the external parameter variations and it changes randomly. If the sensor output variation is linear or it is following some pattern then we can use the linear model which is able to fit to get the desired output but this does not happen most of the time, this will not work as the output behaviour is nonlinear and non-deterministic. Therefore, it is desirable to devise a model which can improve the performance based on mathematical or artificial intelligence techniques. The scope of this paper is to study the behaviour of sensor output signal variations to minimize the output error generated due to temperature variation. In this paper, fuzzy rule base approach has been implemented and it is compared with mathematical curve fitting technique. Fuzzy technique incorporated to solve this kind of engineering problem has produced good results. This approach for modelling random error drift added a new dimension to this kind of engineering problem.
Photo catalysis process
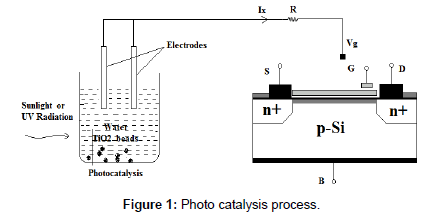
The photo catalysis process is one of the important methods, which is useful in degrading organic compounds. Varieties of literatures are available on the various methods, procedures mechanisms and equations involved in the process for gaining a better knowledge [5-7]. Semiconductor materials generally have two bands separated out by forbidden energy gaps which are valence band and conduction band. The energy gap between these two bands is denoted by Eg. The electrons from the valence band move to empty conduction band when a light of having energy higher than band gap energy falls on the semiconductor material. During this process, the positive chare carrier’s holes are left behind in the valence band of the semiconductor due to excitation of electrons to higher energy conduction band. These positive carrier’s holes left behind on reaching the surface of the organic molecule reacts with water to give OH- radicals for oxidizing the organic pollutants. The dissolved oxygen in the molecular form gets combined with photo electrons thus generated and forms a superoxide radical ion. Titanium oxide has the ability to cause photo-oxidative destruction of the organic pollutants and is non- corrosive in nature due to which it is used as a catalyst in the process [8-10]. In the process of Photo catalysis, the oxygen content in any given sample can be determined by observing the change in dissolved oxygen concentration.
A separate floating gate electrode is used during Photo catalysis. The titanium di-oxide due to its non-poisonous nature is used as catalyst to increase the speed of the photo catalysis process. Photo catalytic sensor senses the changes in the oxygen concentration and its voltage levels change as an indication. The complete Photo catalysis process is shown in Figure 1.
Photo catalysis sensor
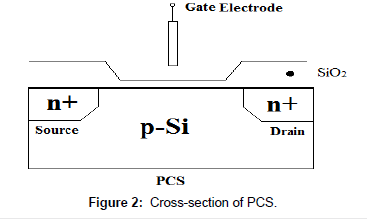
Whig and Ahmad propose the SPICE model for PCS in 2014 [2]. Photo catalysis sensor is similar to a Metal Oxide Semiconductor Field Effect Transistor, MOSFET having structural difference in which the gate terminal is kept floating and placed inside the solution and diffusion and quantum capacitances are added to astounded the effect of Helmholtz and diffusion layer [11-13]. The cross section view of Photo catalysis sensor is shown in Figure 2.
The threshold voltage equation for the PCS model is given as in equation 1:
 (1)
(1)
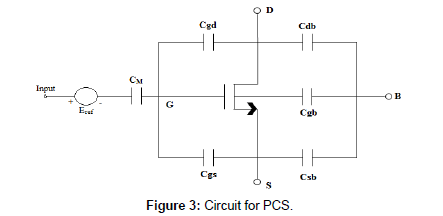
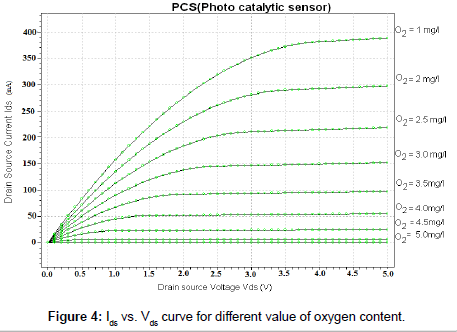
The concentration of O2 is measured in terms of ΨSol which is an input parameter of the equation and dependent on the O2 Cons. in the solution and surface dipole potential χsol. A reference electrode, ERef is used to measure constant reference electrode potential which further used to calculate the exact potential of electrode calibrated in terms of O2 Concentration [14-16]. For different concentrations of O2, different V-I curves for PCS can be plotted. ΨSol is a function of O2 and as the saturation cut-off current Ids increases the value of the oxygen concentration level decreases. The circuit for PCS as given in [17,18] is shown in Figure 3.
Here CM is the resultant of Cox and Cq which are oxide and quantum capacitances respectively. The equivalent capacitance CM is given as:
 (2)
(2)
The drain current equation in non-saturation mode for PCS is given as:
 (3)
(3)
Where
Cox = Oxide capacitance per unit area.
μ = Mobility of electrons in the channel.
W = Channel width.
L = Length of the channel.
Various process parameters including length of channel and channel width are chosen according to the 70 nm CMOS process model.
According to the characteristics of the MOSFET gate to source voltage, Vgs known as reference voltage drain current is allowed to vary with drain to source voltage keeping reference voltage constant. Comparing PCS with MOSFET keeping the concentration of O2 = 1mg/l it is found that the curve resembles with the characteristic Vds /Ids curve of MOSFET keeping Vgs constant [19-21]. Now keeping the reference voltage Vgs = 0 it is observed that for different concentration levels of O2, different Vds/Ids curves are obtained as shown in Figure 4. From the above it is observed that as the oxygen concentration level decreases saturation cut off current Ids increases hence it is concluded that PCS can be treated as MOSFET on the basis that the chemical input parameter Ψsol is a function of O2 (Ψsol = f (Oxygen)). For the different values of oxygen content the curves between Ids and Vds is shown in Figure 4.
Fuzzy implementations
Fuzzy approach is based upon IF-THEN fuzzy rules. Fuzzy systems can have multiple inputs and single output system. Fuzzy system consists of four major components i.e., fuzzifier, fuzzy rule base, fuzzy inference engine and at output defuzzifer [22]. Each component has its own role. For example, fuzzy rule base contains the fuzzy IF-THEN rules. Fuzzy inference engine (FIS) using inference method maps the fuzzy sets in the input space to the output space using fuzzy logic. Fuzzifier and defuzzifier transform the input variables to the fuzzy sets and vice versa respectively [23].
Fuzzy Rule Base implementation requires first defining the linguistic variables [9,10]. Based upon our acquired data of photo catalytic sensor, the declaration of fuzzy variables to the inputs and outputs is defined. Figure 2 shows plotted data in which red colour shows the varying temperature profile given to the sensor and blue data curve shows the sensor output variation with respect to temperature. It means that there are two input variables i.e., temperature and sensor output. Therefore, our first input to fuzzy inference system (FIS) is the temperature. It is clear from the Figure 2 that the temperature varies between 20°C to 60°C. Hence, we have defined the temperature range into three categories i.e., Low, Medium and High as given in Table 1. The second input to the fuzzy system is sensor output data in microvolts (μV) which act as the input to get the desired output or corrected output. Since the sensor data varies in between 5 to 20 μV range as depicted in the Figure 5. The third column in the Table 1 shows the fuzzy label for sensor output data range.
| Range | Temperature Range (°C) | Sensor Data Range (µV) |
|---|---|---|
| Low | Low (10-20) | L-SEN (5-10) |
| Medium | Medium (20-30) | M-SEN (7-17) |
| High | High (30-45) | H-SEN (10-20) |
Table 1: Fuzzy input labels.
The output from the fuzzy system as shown in Figure 5 will be the desired output or corrected output. Our aim is that sensor output does no change with respect to temperature variation rapidly. It should behave like at room temperature or at Low temperature range. So corrected output should lie in the “L-SEN” range i.e., 5 to 10 μV. We have defined the sensor output range in Low (L-SEN) and Medium(MSEN) for sensor data range as shown in Table 2.
| Range | Sensor Data Range (µV) |
|---|---|
| Low | Low Output (10-20) |
| Medium | Medium Output (20-30) |
Table 2: Fuzzy output labels.
Based upon these fuzzy label declarations, triangular membership function has been chosen and defined. The other membership functions like Gaussian and tepozodial can also be defined.
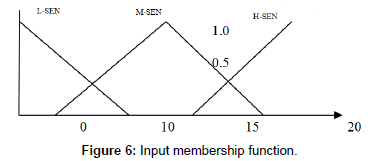
The input membership function of the Sensor input data is shown below in the Figure 6.
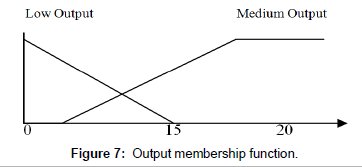
Similarly, output membership function is defined and it is shown in Figure 7 Based upon the input output membership functions, the fuzzy rules [7] which will give the desired output from the fuzzy system. Nine possible combinations have been considered at the input side because there are three membership functions for each input. These are listed below which are capable of producing the desired output. Since the two inputs occur simultaneously, so AND operator has been chosen in IF statements.
R1: If temperature is low [10-20] and sensor output is low [5-10].
THEN final output is low [5-10].
R2: If temperature is medium [20-30] and sensor output is low [5-10].
THEN final output is low [5-10].
R9: If temperature is high [30-45] and sensor output is medium [7-17].
THEN final output is medium [20-30].
Principle of fuzzy based PCS System
The performance specifications of the system can be improved by tuning value of various parameters. By self-tuning it means the characteristics of the controller to change or adjust its controlling parameters on-line automatically so as to have the most appropriate values of these parameters, which help system to get desired value. Fuzzy self-tuning works on the basis of control rules, which can be obtained by theoretical and experimental analysis of any system of expert. Thus, fuzzy logic can tune the internal parameters with the help of rule base on – line. This provide better performance than the conventional or simple fuzzy controller.
Design of self-tuning fuzzy PID controller
The self-tuning Fuzzy controller takes “error” (e) and “rate of change of error” (ec) as input to fuzzy logic controller and modify value of three parameters “L-SEN”, “M-SEN” and “H-SEN” online as output. Thus, we have total of five linguistic variables (e, ec, L-SEN, M-SEN, H-SEN). Total of seven fuzzy value NB, NM, NS, ZO, PS, PM, PB are chosen for each of the linguistic variable. The region “e” and “ec” are between -3 to 3 whereas by doing some interpolation region of L-SEN, M-SEN and H-SEN are kept between 0 and 1. Interpolation tries to keep the value of the variable within specified region.
The linguistic rule is important part of FIS. These rules are called the rule base. These rules are created with the help of human knowledge and expertise upon behaviour of the system under different condition. Any number of such rules can be formed to give the controller direction for action.
Result and Simulation
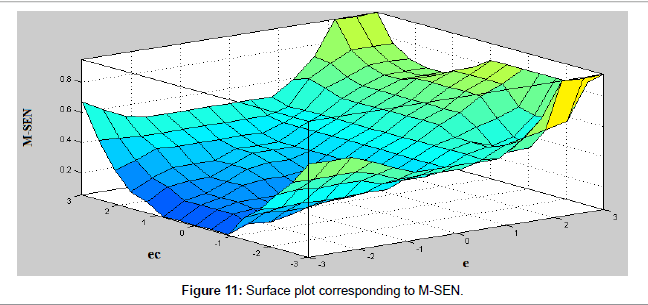
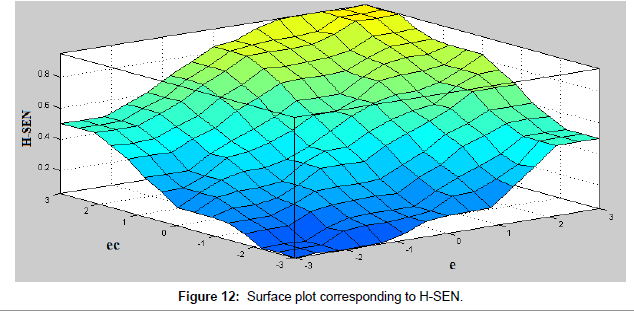
Rules for fuzzy interface system design for different values of L-SEN, M-SEN and H-SEN are shown in corresponding tables (Tables 3-5).
| e/ec | NB | NM | NS | ZO | PS | PM | PB |
|---|---|---|---|---|---|---|---|
| NB | PB | PB | PM | PM | PS | ZO | ZO |
| NM | PB | PB | PM | PS | PS | ZO | NS |
| NS | PM | PM | PM | PS | ZO | NS | NS |
| ZO | PM | PM | PS | ZO | NS | NM | NM |
| PS | PS | PS | ZO | NS | NS | NM | NM |
| PM | PS | ZO | NS | NM | NM | NM | NB |
| PB | ZO | ZO | NM | NM | NM | NB | NB |
Table 3: Rule base for L-SEN.
| e/ec | NB | NM | NS | ZO | PS | PM | PB |
|---|---|---|---|---|---|---|---|
| NB | NB | NB | NM | NM | NS | ZO | ZO |
| NM | NB | NB | NM | NS | NS | ZO | ZO |
| NS | NB | NM | NS | NS | ZO | PS | PS |
| ZO | NM | NM | NS | ZO | PS | PM | PM |
| PS | NM | NS | ZO | PS | PS | PM | PB |
| PM | ZO | ZO | PS | PS | PM | PB | PB |
| PB | ZO | ZO | PS | PM | PM | PB | PB |
Table 4: Rule base for M-SEN.
| e/ec | NB | NM | NS | ZO | PS | PM | PB |
|---|---|---|---|---|---|---|---|
| NB | PS | NS | NB | NB | NB | NM | PS |
| NM | PS | NS | NB | NM | NM | NS | ZO |
| NS | ZO | NS | NM | NM | NS | NS | ZO |
| ZO | ZO | NS | NS | NS | NS | NS | ZO |
| PS | ZO | ZO | ZO | ZO | ZO | ZO | ZO |
| PM | PB | NS | PS | PS | PS | PS | PB |
| PB | PB | PM | PM | PM | PS | PS | PB |
Table 5: Rule base for H-SEN.
Thus in a fuzzy interface system design there are total of two input as “e” and “ec” and three output as L-SEN, M-SEN and H-SEN as shown in Figure 8. Hence by these three tables total 49 rules are formed in FIS using MTable 3: Rule base for L-SEN.Table 3: Rule base for L-SEN.ATLAB.
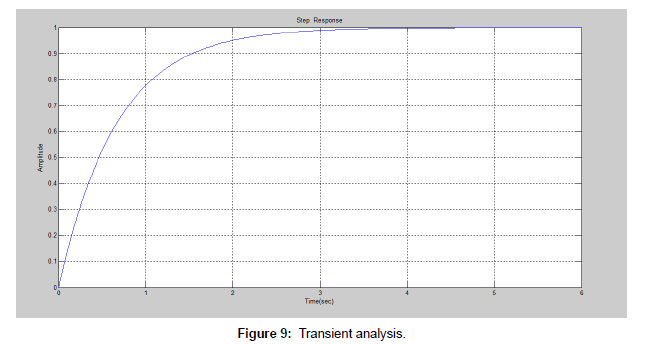
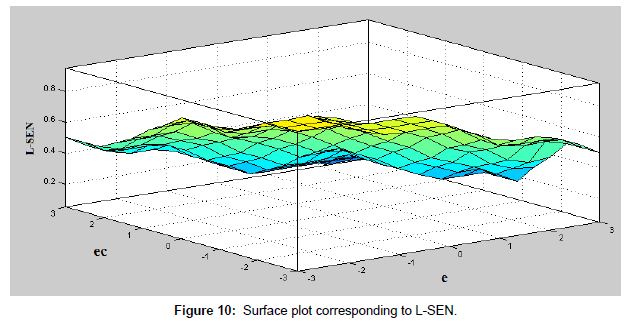
Two input three outputs Fuzzy inference system has been designed. Inputs are “error” and “rate of change of error “and outputs are three parameter L-SEN, M-SEN and H-SEN of controller. The transient analysis of Fuzzy system design is shown in Figure 9. The output of fuzzy interface is linear shows that the sensor system is stable and the system is independent from the impact of external parameters. The surface plots corresponding to L, M and H-SEN is plotted with respect to two parameters e and ec as shown in the Figures 10-12. It is observed for the figures that the L-SEN (sensor output range at low temperature) has a little effect of change in e and ec value.
Conclusion
The error control using fuzzy logic interface is presented in this paper. Temperature variation in the environment where these sensors installed degrades the performance due to change in the properties of material. Data has been acquired from sensor under temperature varying environment. The output of the sensor has shown nondeterministic and non-linear behaviour with respect to temperature change. We have developed the fuzzy based technique to model and minimize the output variation. Fuzzy approach has shown better results with sugeno model with Gaussian membership functions as compared to the Mamdani model. It means that fuzzy approach has ability to produce much better results as compared to other mathematical techniques. In future, Genetic Algorithm can also be implemented to check the results with fuzzy system as a comparison. Also, this study may be extended for further improvements in terms of power and size, besides the wiring and layout characteristics level.
References
- Whig P, Ahmad SN (2016) Simulation and performance analysis of low power quasi floating gate PCS model. Internat J Intel Engin and Sys 9: 8-13.
- Zhang Y, Du C, Zhou Y, Chen C (2010) Geomagnetic sensor random error modeling and compensation. Hangzhou pp: 6639-6641.
- Whig P, Ahmad SN (2013) Simulation of linear dynamic macro model of photo catalytic sensor in SPICE. COMPEL 33: 611-629.
- Duffy JA (1990) Bonding, energy levels, and bands in inorganic solids, Longman.
- Whig P, Ahmad SN (2016) Modelling and simulation of economical water quality monitoring device. J Aqua & Marine Biol 4: 1-6.
- Kim YC, Sasaki S, Yano K, Ikebukuro K, Hashimoto K, et al. (2001) Photocatalytic sensor for the determination of chemical oxygen demand using flow injection analysis. Analytica Chim Acta 432: 59-66.
- Whig P, Ahmad SN (2012) Performance analysis of various readout circuits for monitoring quality of water using analog integrated circuits. Internat J Intel Syst and Appl 4: 91-98.
- Chow LLW, Yuena MMF, Chanb PCH, Cheung AT (2001) Reactive sputtered TiO2 thin film humidity sensor with negative substrate bias. Sensors and Actuators B: Chemical 76: 310-315.
- Whig P, Ahmad SN (2013) A novel pseudo NMOS integrated ISFET device for water quality monitoring. Active and Passive Electr Comp 10: 1-6.
- Whig P, Ahmad SN (2014) Development of economical ASIC for PCS for water quality monitoring Journal of Circuits. Systems and Computers 23: 1-13.
- Kahng D, Sze SM (1967) A floating gate and its application to memory devices. The Bell System Technical Journal 46: 1288-1295.
- Berg Y, Lande TS, Naess S (1997) Low-voltage floating-gate current mirrors. In: Proceedings of the 10th Annual IEEE International ASIC Conference and Exhibit Portland. pp: 21-24.
- Whig P, Ahmad SN (2016) Ultraviolet Photo Catalytic Oxidation (UVPCO) sensor for air and surface sanitizers using CS amplifier. Global J Res Engine 16: 1-13.
- Lande TS, Wisland DT, Saether T, Berg Y (1996) FLOGIC-floating-gate logic for low-power operation. In: Proceedings of the 3rd IEEE International Conference on Electronics, Circuits, and Systems, Rodos pp: 1041-1044.
- Rodriguez-Villegas E (2006) Low power, and low voltage circuit design with the FGMOS transistor.
- Massobrio G, Antognetti P (1993) Semi-conductor device modeling with SPICE New York USA: McGraw-Hill.
- Whig P, Ahmad SN (2016) Simulation and performance analysis of multiple PCS sensor system. Electronics 20: 85-89.
- Peterson M, Turner J, Nozik A (1991) Mechanistic studies of the photo-catalytical behavior of TiO2 particles in photo electrochemical slurry and the relevance to photo detoxification reactions. J Physi Chem B 95: 221-225.
- Polycarpou MM, Uber JG, Zhong W, Feng S, Brdys M (2002) Feedback control of water quality. IEEE Control Systems Magazine 22: 68-87.
- Whig P, Ahmad SN (2011) On the performance of ISFET-based device for water quality monitoring. Internat J Commu Network Sys Sci 4: 709-719.
- Rashmi S, Whig P (2015) On the performance analysis of proportional integral derivative controller with VDR. Bilingual International Conference on Information Technology and Library science, DRDO, New Delhi.
- Rashmi S, Shweeta P, Pawan W (2015) Effect of output error on fuzzy interface for VDRC of second order systems. Internat J Comp Applic.
- Whig P, Ahmad SN (2012) DVCC based readout circuitry for water quality monitoring system. Internat J Comput Applic 49: 1-7.
Relevant Topics
- Atmosphere
- Atmospheric Chemistry
- Atmospheric inversions
- Biosphere
- Chemical Oceanography
- Climate Modeling
- Crystallography
- Disaster Science
- Earth Science
- Ecology
- Environmental Degradation
- Gemology
- Geochemistry
- Geochronology
- Geomicrobiology
- Geomorphology
- Geosciences
- Geostatistics
- Glaciology
- Microplastic Pollution
- Mineralogy
- Soil Erosion and Land Degradation
Recommended Journals
Article Tools
Article Usage
- Total views: 3326
- [From(publication date):
April-2017 - Apr 03, 2025] - Breakdown by view type
- HTML page views : 2503
- PDF downloads : 823

