Contribution of Sulphur Dioxide Emissions (SO2) in the Climate Change: Case of the Gulf of Gabes
Received: 13-Nov-2019 / Manuscript No. JESCC-19-4578 / Editor assigned: 18-Nov-2019 / PreQC No. JESCC-19-4578 (PQ) / Reviewed: 02-Dec-2019 / QC No. JESCC-19-4578 / Revised: 22-Jul-2022 / Manuscript No. JESCC-19-4578 (R) / Published Date: 19-Aug-2022 DOI: 10.4172/2157-7617.1000633 QI No. / JESCC-19-4578 (QI)
Abstract
The last report from the International Panel on Climate Change (IPPC) highlights the mediterranean as one of the most vulnerable regions in the world to the impacts of global warming. The models issued by IPCC cast different scenarios for the region, but all of them agreed on a clear trend in the pattern of some climatic parameters. In terms of the thermal regime, the base scenario from 1980-2000 was used to estimate an increase in average surface temperatures in the range of 2.2 and 5.1°C for the period 2080-2100.
Keywords: Climate change; Climatic parameters; Global warming; Thermal regime
Introduction
The last report from the International Panel on climate change highlights the mediterranean as one of the most vulnerable regions in the world to the impacts of global warming. The models issued by IPCC cast different scenarios for the Region, but all of them agreed on a clear trend in the pattern of some climatic parameters. In terms of the thermal regime, the base scenario from 1980-2000 was used to estimate an increase in average surface temperatures in the range of °2.2 C and 5.1° C for the period 2080-2100 [1].
Increasingly, air quality and climate change are seen as two issues that are inexorably linked. Any policy actions intended to mitigate one of these two issues must necessarily take into account the feedbacks with the other, to avoid that benefits to one sector, will worsen the situation in another sulphur compounds, are among the most ubiquitous atmospheric pollutants, playing a crucial role in the chemistry of the Earth’s atmosphere thus, they strongly affect the climate and weather inter alia the temperature. Sulphur dioxide is a widespread atmospheric air contaminant, emitted from a variety of sources, mainly from industrial plants, for example sulphuric production acid, some mineral ores, fossil fuels production and fossil fuel combustion. Several studies have evaluated the relation between sulphur dioxide and temperature. By using statistical analyzes, meteorological conditions associated with the top 10% of OMI-based high SO2 days are found in average to be controlled by slightly warmer, 1-2°C, temperatures. The correlation (rs) between SO2 concentration and the ambiant Temperature (T) in the vicinity of Olsztyn, only in the months of February, April and June. In his study in 2009, Ward note that temperature and anthropogenic sulphur evaluate at the same rate before and after 1950. In SO2 concentrations and temperature have moderate relation in November and December while having weaker relations during January-April.
However in balikesir, Turkey, SO2 was highly correlated with lower [2]. GABES is the unique coastal Mediterranean oasis. It’s essentially sources of great biological diversity and particular natural habitations, which altogether make an essential component of the agricultural identity of the region. Late 1970’s and early 1980’s, in addition to the acceleration of urbanization many industrials factory has settled in particular the Tunisian chemical group and the cement plant witch leading to an important emissions of SO2. Since, the environment has begun to change our oasis is no longer the paradise it was plain inhabitants [3].
No studies have been done on the effect of any pollutant on climate change in the gulf of GABES. Until now, many areas of both science and policy treated these two issues as if they were two separate environmental challenges in the Gulf of GABES, which pose another difficulty to simulate their climatic effects in regional scale. Where This study have been undertaken to analyze the evolution of temperature as a climate change index in 3 stations of the south east of Tunisia and relation with SO2 emission [4].
Case Study
Study area: Gabes region
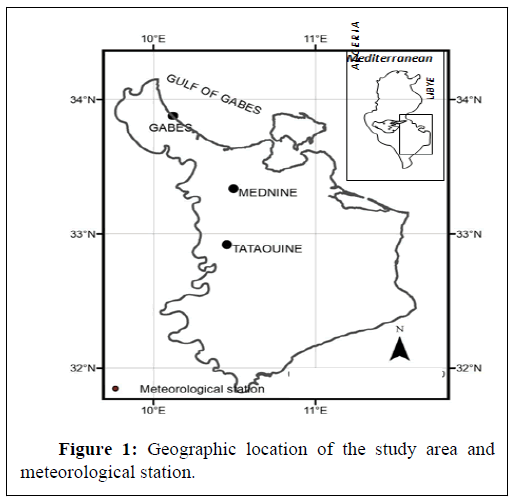
The governorate of Gabes is located in South East Tunisia on the coast of the Gulf of Gabes, which is part of the Mediterranean Sea (Latitude 33°53′ longitude 10°07′), 376 km south of the capital, Tunis. It is a governorate (provinces) with 350,000 inhabitants (2005 estimate) and an area of 7,175 km2. It has a warmsummer Mediterranean climate, characterized by a hot and dry season and a cool and arid season [1].
This region is one of the biggest industrial cities in Tunisia. Most industries are chemical oriented. The main industries are: Cement, chemical products, brick factories and oil refinery [2].
GABES has also one of the biggest ports in Tunisia; it is used usually to ship the mineral products from the city of GAFSA. The fast growing numbers of factories has resulted in fairly serious pollution of the area and gulf of GABES. A study menu by the Facility for Euro- Mediterranean Investment and Partnership (FEMIP) and the world bank, pinpointed the Gabes region as one of the most polluted in the mediterranean basin. For that, in recent years the government is working on new programmes and laws to decrease the amount of pollution (Figure 1).
Metreological data
To study evolution of temperature in Gabes, Medenine and Tataouine, we obtained the daily temperature data from 1976 to 2015 from the National Institute of metelorogie. The location of the meteorological stations is presented. For a statical treatement, we have used a SPSS statistical model [3].
Sulphur dioxide emission
Data of SO2 emission in GABES is available from 2008 with a very high rate of deficiencies from 2010 to 2012, which is why we have chosen to work with a completed modulated concentration of SO2 emission. Modeled data has the advantage of not being subject to measurement and recording errors. In this study, we have used the ARIA impact model, to obtain the hourly concentration of SO2 from 2010 to 2017 with National Air Quality Monitoring Network (RNSQA) in Tunisia [4].
The ARIA impact model is a Gaussian model provided by ARIA technologies. ARIA impact was used to elaborate statistical assessment of long-term impact of traffic and industrial emissions. Local climatic and topographic characteristics were taken into account in the numerical simulations of the atmospheric dispersion. Study of temperature evolution and the relation between SO2 and T is based on analysis of the correlation coefficients and linear regression equations [5].
Results
Variability of temperature in the south east of Tunisia
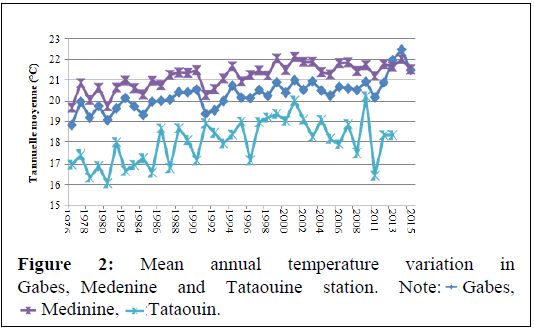
Annual variability of mean temperature: The analyses of interannual mean air temperature data during the 1976-2015 over the South East of Tunisia reported a significant increase. In fact, a significant rise on average about 0.48°C and 0.47°C per decade is measured in medenine and tatouine respectively. This same value was found as a result of a simulation done by the GIZ and the ministry of agriculture, hydraulic resources and fisheries (Tunisia) in 2007. In the coastal station of Gabes an significant increase of average temperature by 0, 769°C/decade is observed. However, the rise estimated by the GIZ is less important, it’s about 0, 47°C/decade and 0, 56°C/decade under emission scenario respectively [6].
This reveals that the coastal station of Gabes has recognized the higher increasing of temperature although the warming will have more important on the continental stations of medenine and tataouine [7].
Discussion
On a wider scale, the North African countries are consistently projected to become global hotspots for drought by the end of the 21st century under the Representative Concentration Pathway (RCP) 8.5 scenario. In other study commissioned by the World Bank (2014) estimated that strongest warming in North Africa will take place close to the mediterranean coast (Figure 2) [8].
Seasonal variability of temperature
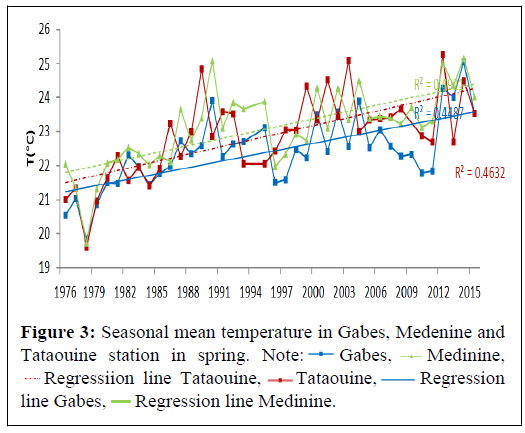
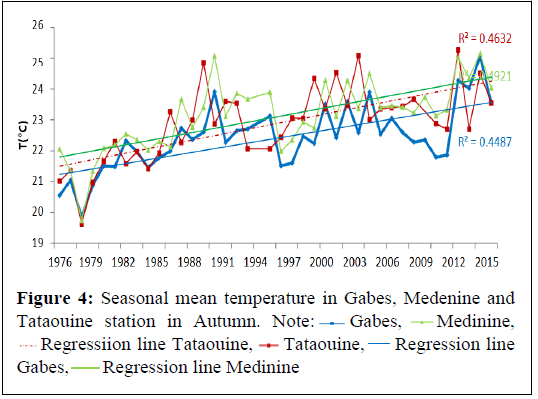
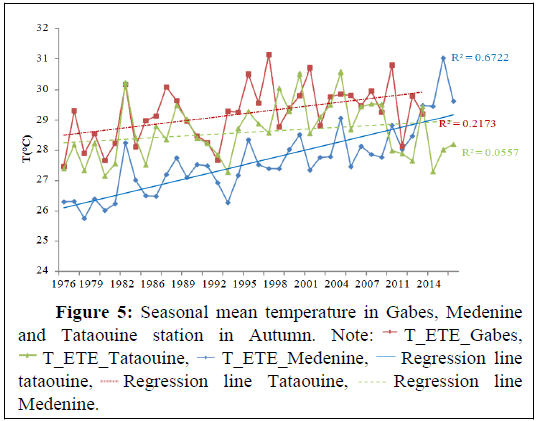
The Mediterranean climate is characterized by high temperatures in summer. However, episodes of high or even very high heat may occur in the intervening seasons (autumn or spring). From where seasonal variability of temperatures will by treated over Gabes, Medenine and Tataouine station. From 1976 to 2015, the trend of spring temperature increase by 0.95°C, 0.5°C and 0.62°C per decade in Gabes, Medenine and Tataouine station respectively. In autumn the increasing is significant in the three stations and it’s about 0.75°C, 0.5°C and 0.62°C per decade respectively in GABES, Medenine and Tataouin. Finally significant slight rises occur in summer only over GABES by about 0 and 1°C per decade. From where and during the study period the mean seasonal temperature increased significantly only in Gabes with a maximum recorded in spring. In Tataouine and Medenine, the growth is significant in autumn season (Figure 3) [9].
Heat wave evolution
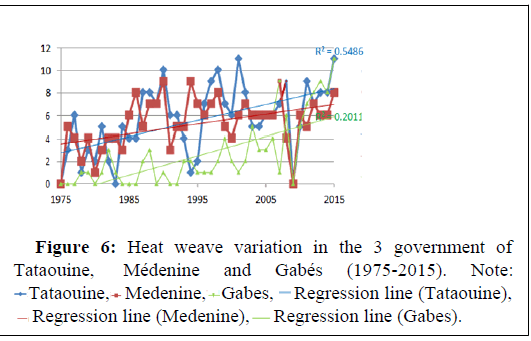
There is no standard definition of a heat wave. In Tunisia, heat wave is defined by the National Institue of Meterology of Tunisia as a succession of, minimum, three days with Tmax ≥ 33°C and Tmin ≥ 20° C the number of the heat wave increase significantly during the period of 1976-2015 in Gabes and Tasataouine. The Evolution of heat waves is almost similar on Medenine and Tataouine and its characterized by a continuously increasing.
In Gabes, the variation is different: The evolution can be devised on 2 parts: At the beginning of the study period and until 1998, Gabes is characterized by the least heat wave number which does not exceed 2 heat wave/year. From 1998, the number has increased considerably to exceed even the annual number of heat wave on the mainland stations of Medenine and Tataouine from 2011. Before 1978 (1976 and 1977), corresponding to the creation of TCG, no extremely event have been recorded (Figure 4) [10].
In addition the duration of heat waves increase in the three governorates especially in Gabes where the number of day of the heat wave per decade increase about 5 times from 1978. In Tataouine the decennial growth is about 3 times from 1976 (Figure 5).
In a global scale, the risk of severe, prolonged heat wave events is increasing according to multiple reports and studies, such as the IPCC, the Proceedings of National Academy of Sciences, and European Academy Science Advisory Council (EASAC). This trend has been predicted and reported in North Africa, world bank also, there is high confidence that heat waves and warm spell durations will increase, suggesting an increased persistence of hot days toward the end of the century. In Northern Africa, there is a projected increase in the number of heat wave days over the 21st century [11].
SO2 inventory emissions in Gabes
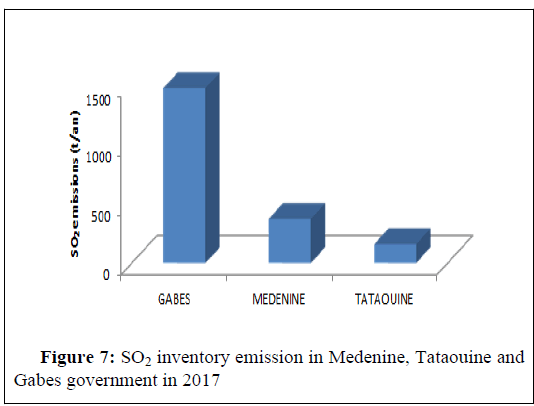
Importance of SO2 in Gabes: We have considered all the major compounds which are emitted from anthropogenic sources (mainly industries and road traffic). The emissions issued from the anthropogenic sources result mainly from the use of the different fossil fuel types and from the evaporation of solvents. The levels and the composition of these emissions depend on several main parameters such as combustion processes, temperature, filtration devices, etc. (combustion) and on the conditions of using and recovering procedures, when they exist (solvents) [12]. The result of SO2 inventory emission in the three governments of Medenine, Tataouine and Gabes. The difference of SO2 emissions in the three governorates. In fact the SO2 emission in GABES is the highs (1500 t/year) and it’s about four and nine times more important than in Medenine and Tataouine respectively (Figure 6) [13].
What’s the place of SO2 emission by the industry?
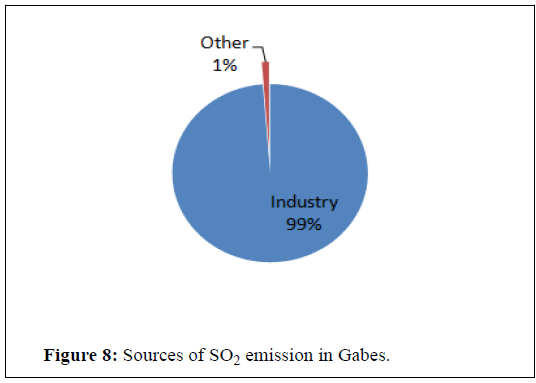
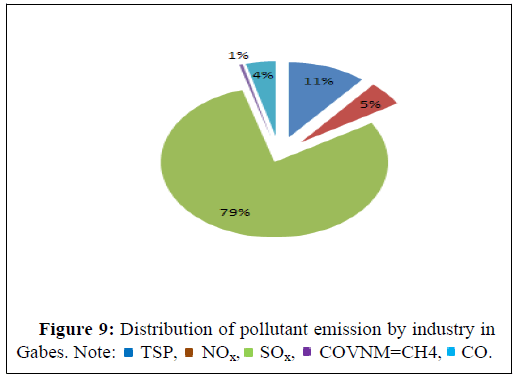
In Gabes, industry (anthropogenic factor) is the first and even the unique source responsible for 99% of SO2 emissions. In the other hand, SO2 emissions represent the large fraction from the industry pollutant emissions about 79%. Where the SO2 emissions are the first indicator of the industrial pollution in Gabes [14]. During the research period, the annual mean concentration of SO2 exceeds the value of the world health organization wich is 50 g/m which confirms the existence of a large point source of SO2. The distribution of SO2 concentration indicates that the first emitting industries are located area of Ghannouch where emissions exceed 21500 tonnes/year in 2008. The sulphuric acid production process is the main source of this pollutant with a percentage of 83% (Figure 7) [15].
Annual SO2 concentration variation
The greatest monthly average concentrations appeared in August with a peak concentration about 417 g/m, when the monthly average temperature recorded was the highest of 26, 5°C. In the other hand, the minimum concentration is registered in December (46 g/m) and the temperature was the lowest of 10.5°C. The larger dispersion of concentrations appeared in summer and spring months, with the monthly average concentrations between 94 g/m and 141 g/m that correspond to the seasons characterized by the most important and significant rise of temperature. These observations predict a relationship of dependence between these two parameters. In order to describe dependences between monthly average SO2 concentrations and T during the research period, an analysis of the correlation coefficient was conducted. Results show significant (alpha=0.05) correlation coefficient equal to rs=0.6. Studies on the relationship between T and SO2 concluded that the concentration of SO2 emissions is correlated with temperature [16]. The correlation can be positive, or negative. Other study showed that correlation is positive for some months and negative for others. None of these studies determined the threshold of SO2 concentration at which time the temperature can evaluate one way or the other thus the correlation coefficient changes the sign. From where we treated the dependence at finer, daily, scale to minimize the error (Figure 8) [17].
Dependence of T on SO2
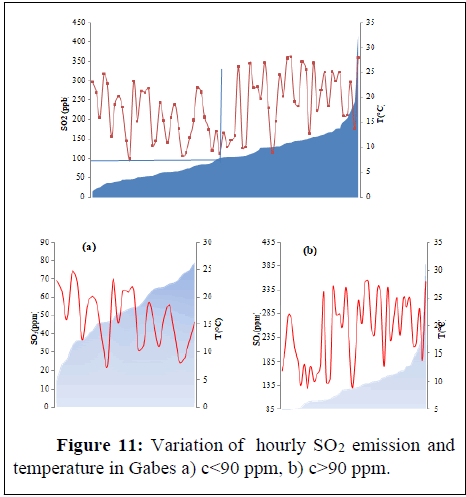
To achieve this goal, we determine the effect of SO2 on temperature on a daily scale, we ranked daily SO2 emission in increasing order from 2010 to 2017 then we evaluted their relationship to temperature of the graphic presentations shown two parts: A first characterized by decreasing temperature for a growth of low concentration of SO2 (C<90). The dependence between the concentration of SO2 and the air temperature (T) was expressed by a higher negative correlation coefficients (rs)=-0.5. A second characterized by increasing temperature for a growth of high SO2 concentration (c>90) and the dependence between the concentration of SO2 and the air temperature (T) was expressed by a lower positive value of correlation coefficients (rs)=0.3. The results are statistically significant in the two cases [18]. Thus, we conclude that a SO2 concentration about 90 g/m is the value where temperature increases. The SO2 concentration making changing the temperature evolution behavior is almost equal to the limit value of SO2 (9090 g/m) (Figure 9) [19,20].
In Gabes, 57% of monthly SO2 emissions in Gabes are >9090 g/m so we conclude that the principal effect of SO2 emission is the increasing of temperature in Gabes (Figures 10 and 11) [21-23].
Conclusion
As the research has demonstrated, the southeast of Tunisia was a subject of a significant annual warming between 1976 and 2015. Gabes it considereted as the “hot spot” in the region: In fact, the mean annual and seasonal temperature increased significantly with a maximum raise in spring and an growth of the the number of heat weave from 1998. In the other hand, analysis show that SO2 emission is considerate as the first indicator of the industrial pollution in Gabes. The nature of the dependence, identified by the coefficient correlation in monthly scale, between the concentration of sulphur dioxide and temperature was that of a proportional relationship. The coefficient is about 0, 6. While the study of dependence between the two parametrers in daily scale show that SO2 concentration making changing the temperature evolution behavior is almost equal to the limit value of (90 ppm). Thus the warming of temperature is of in industry pollution thus Gabes is subject to a climate change. These results can be used to fight against pollution in industry polluted region of the mediterranean throught remediation action. The action could consist in reducing of the daily SO2 emission below the threshold value equal to 90 ppm.
References
- Calkins C, Ge C, Wang J, Anderson M, Yang K (2016) Effects of meteorological conditions on sulfur dioxide air pollution in the North China plain during winters of 2006-2015. Atmos Environ 147: 296-309.
- Cantat O (2004) Critical analysis of rainfall trends in the 20th century in Lower Normandy: Reflections on the reliability of data and climate change. Ann Int Assoc Climatol 1: 11-31.
- Coumou D, Robinson A, Rahmstorf S (2013) Global increase in record-breaking monthly-mean temperatures. Clim Chan 118: 771-782.
- Cuhadaroglu BU, Demirci E (1997) Influence of some meteorological factors on air pollution in Trabzon city. Energy Build 25: 179-184.
- Dai A (2013) Increasing drought under global warming in observations and models. Nat Clim Chan 3: 52-58.
- Hov O, Cubasch U, Fischer E, Höppe P, Iversen T, et al. (2013) Trends in extreme weather events in Europe: Implications for national and European union adaptation strategies.
- Ilten N, Selici AT (2008) Investigating the impacts of some meteorological parameters on air pollution in Balikesir, Turkey. Environ Monitor Assess 140: 267-277.
- Komarnisky LA, Christopherson RJ, Basu TK (2003) Sulfur: Its clinical and toxicologic aspects. Nutrition 19: 54-61.
- Siwik-Ziomek A, Lemanowicz J, Koper J (2016) Arylsulphatase activity and sulphate content in relation to crop rotation and fertilization of soil. Int Agrophy 30: 359-367.
- Maione M, Fowler D, Monks PS, Reis S, Rudich Y, et al. (2016) Air quality and climate change: Designing new win-win policies for Europe. Environ Sci Policy 65: 48-57.
- Meehl GA, Tebaldi C (2004) More intense, more frequent and longer lasting heat waves in the 21st century. Science 305: 994-997.
- Melamed ML, Schmale J, Von Schneidemesser E (2016) Sustainable policy key considerations for air quality and climate change. Curr Opin Environ Sustain 23: 85-91.
- Orlowsky B, Seneviratne SI (2013) Elusive drought: Uncertainty in observed trends and short-and long-term CMIP5 projections. Hydrol Earth Syst Sci 17: 1765-1781.
- Palmer TN (2013) Climate extremes and the role of dynamics. Proc Natl Acad Sci 110: 5281-5282.
- Prudhomme C, Giuntoli I, Robinson EL, Clark DB, Arnell NW, et al. (2014) Hydrological droughts in the 21st century, hotspots and uncertainties from a global multimodel ensemble experiment. Proc Natl Acad Sci 111: 3262-3267.
- Robock A (2000) Volcanic eruptions and climate. Rev Geophy 38: 191-219.
- Sillmann J, Kharin VV, Zwiers FW, Zhang X, Bronaugh D (2013) Climate extremes indices in the CMIP5 multimodel ensemble: Part 2 future climate projections. J Geophys Res Atmos 118: 2473-2493.
- Stott PA, Stone DA, Allen MR (2004) Human contribution to the European heatwave of 2003. Nature 432: 610-614.
- Von Schneidemesser E, Monks PS, Allan JD, Bruhwiler L, Forster P, et al. (2015) Chemistry and the linkages between air quality and climate change. Chem Rev 115: 3856-3897.
- Ward PL (2009) Sulfur dioxide initiates global climate change in four ways. Thin Solid Films 517: 3188-3203.
- Kit O (2014) Turn down the heat: Confronting the new climate normal.
- Xia Y, Guan D, Jiang X, Peng L, Schroeder H, et al. (2016) Assessment of socioeconomic costs to China’s air pollution. Atmosp Environ 139: 147-156.
- Xue D, Yin J (2014) Meteorological influence on predicting surface SO2 concentration from satellite remote sensing in Shanghai, China. Environ Monit Assess 186: 2895-2906.
Citation: Fayech D, Taieb D, Tarhouni J (2022) Contribution of Sulphur Dioxide Emissions (SO2) in the Climate Change: Case of the Gulf of Gabes. J Earth Sci Clim Change, 13: 633. DOI: 10.4172/2157-7617.1000633
Copyright: © 2022 Fayech D, et al. This is an open-access article distributed under the terms of the Creative Commons Attribution License, which permits unrestricted use, distribution, and reproduction in any medium, provided the original author and source are credited.
Select your language of interest to view the total content in your interested language
Share This Article
Recommended Journals
Open Access Journals
Article Tools
Article Usage
- Total views: 2545
- [From(publication date): 0-2022 - Nov 25, 2025]
- Breakdown by view type
- HTML page views: 2104
- PDF downloads: 441

 Gabes,
 Medinine,
 Tataouin.
 Gabes,
  Medinine,
  Regressiion line Tataouine,
  Tataouine,
  Regression line Gabes,
 Regression line Medinine.
 Gabes,
  Medinine,
  Regressiion line Tataouine,
  Tataouine,
  Regression line Gabes,
  Regression line Medinine
 T_ETE_Gabes,
 T_ETE_Tataouine,
  T_ETE_Medenine,
  Regression line tataouine,
  Regression line Tataouine,
 Regression line Medenine.
 Tataouine,
  Medenine,
  Gabes,
  Regression line (Tataouine),
  Regression line (Medenine),
  Regression line (Gabes).
 TSP,
TSP,  NOx,
NOx,  SOx,
SOx,  COVNM=CH4,
  CO.
CO.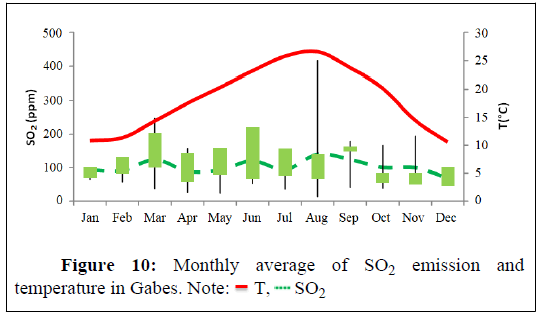
 T,
T,  SO2
SO2