Research Article Open Access
Contact and Joint Forces Modeling and Simulation of Crawler-formation Interactions
Samuel Frimpong* and Magesh ThiruvengadamMissouri University of Science and Technology, USA
- *Corresponding Author:
- Samuel Frimpong
Professor and Chair Research Assistant Professor
Missouri University of Science and Technology
Rolla, MO 65409, USA
Tel: +573/341-4753
E-mail: rimpong@mst.edu
Received Date: July 29, 2015; Accepted Date: August 26, 2015; Published Date: September 3, 2015
Citation: Frimpong S, Thiruvengadam M (2015) Contact and Joint Forces Modeling and Simulation of Crawler-formation Interactions. J Powder Metall Min 4:135.doi:10.4172/2168-9806.1000135
Copyright: © 2015 Frimpong S, et al. This is an open-access article distributed under the terms of the Creative Commons Attribution License, which permits unrestricted use, distribution, and reproduction in any medium, provided the original author and source are credited.
Visit for more related articles at Journal of Powder Metallurgy & Mining
Abstract
Cable shovels are used in surface mining operations to achieve economic bulk production capacities. The service life of the rawlers and their shoes define shovel reliability, maintainability, availability and efficiency. The crawler track-terrain interaction generates high time-fluctuating contact forces that result in stress buildup, crack and fatigue failure of wler shoes. In addition, the link pins that connect two crawler shoes can exert large fluctuating pin loads on shoe lugding to shoe breakage. This paper addresses fundamental research into contact forces acting on crawler shoes, joint forces generated in the link pin and total deformation of the formation during shovel propel. During propel, the crawler track is controlled by two drive constraints that cause the crawler to follow straight or turning motions. A virtual prototype simulator of the crawler-terrain interaction dynamics is developed and simulated within the MSC ADAMS environment. The simulation results show that the average penetration depth for different crawler shoes is within the range of 5.9 and 6.7 cm for both types of driving constraints. During translation, the maximum magnitude of contact forces along vertical, longitudinal and lateral directions have respective values of 5.9 × 10⁵ N, 5.5 × 10⁵ N and 1.7 × 10⁵ N. During turning, the crawler track experiences varying bouncing and rolling motions causing maximum magnitude of vertical and lateral contact forces on the crawler shoes to increase 1.15 and 1.42 times the maximum translation values. The total deformation of oil sand terrain for the two motions fluctuates between -0.24 and 0.26 cm and between -1.03 and 1.33 cm, respectively. This study provides solid foundation for further studies on dynamic stress and fatigue failure analysis of crawler shoes during shovel propel and loading operations.
Keywords
Surface mining; Crawler-terrain interactions; Multibody dynamic theory; Crawler contact forces; Terrain deformation; Virtual prototype simulation
Introduction
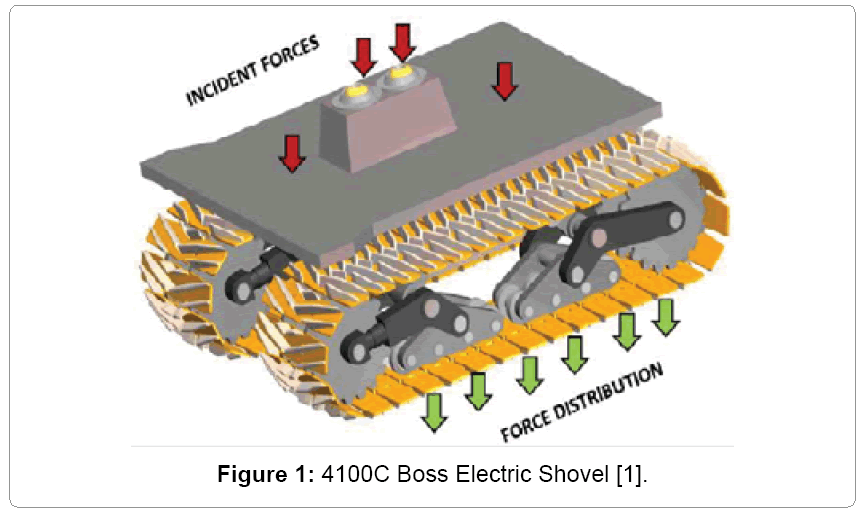
Cable shovels are widely used in surface mining operations. The lower works of this shovel comprise propel and crawler systems, which support the upper body and attachment as shown in Figure 1 [1]. The crawler tracks are made up of crawler shoes that are connected together by link pins to form a continuous chain [2]. The multi-body dynamics study on the interaction between the shovel crawler track and the terrain for large shovels in surface mining operations is not widely available in the open literature. This study is important to determine crawler shoe kinematics, contact forces between crawler tracks and ground and reaction forces at the link pin joint between adjacent crawler shoes. The track-terrain contact forces and pin loading forces play a major role in the fatigue life modeling and analysis of crawler shoes that make up the crawler track assembly. Nakanishi and Shabana (1994) [3] in their study on 2-D hydraulic excavator model of KOMATSU PC120 tracked vehicle, used spring-damper in force model to calculate contact force between track and roller, track and sprocket and track and ground. The horizontal friction force between the track and terrain was modeled using the Coulomb friction model. Choi et al. and Lee et al. [4,5] extended the 2-D study of Nakanishi and Shabana [3] to 3-D contact force models of a hydraulic excavator. Their study reported impulsive nature of the normal contact force and tangential frictional force when the track link interacts with the ground and other components of vehicle.
Rubinstein and Hitron [6], in their 3D multi-body simulation of M113 armored carrier tracked vehicle, developed user-defined force elements to describe track-terrain interaction. The sinkage results during loading and unloading track link with constant sinking velocity showed ground penetration increasing from 0 to 10 cm. Ryu et al. [7] developed compliant track link models for the numerical investigation of military tracked vehicle. The interaction between the track shoe and ground was modeled using the contact force by Choi et al. [4]. Their simulation results showed that the track links of the crawler chain are subjected to large fluctuating contact forces.
Madsen [8] examined tracked hydraulic excavator ground propel using MSC ADAMS. The interaction between track and ground was defined using the contact force model in ADAMS. The simulation results for the reaction force developing at one of the pin joint connecting two track links showed large spikes in their values. Ma and Perkins [9] used a commercial multi-body dynamics code, DADS, to assemble the continuous and multi-body track vehicle model for a large mining shovel crawler. They studied 2-D dynamic contact between track and sprocket during the propel motion and presented crawler shoe - sprocket contact forces and reaction forces acting on the pin that connect adjacent crawler shoes. Frimpong et al. [10] developed tire-road contact force model to calculate normal reaction, lateral resistance, longitudinal reaction and self-aligning torque acting on dump truck tire. They calculated normal force based on road stiffness and damping characteristics, lateral resistance using normal force and coefficient of lateral resistance, and longitudinal reaction based on normal force and coefficient of friction. They found that the contact force on the rear tire is greater than on the front tire.
Frimpong et al. [11] developed virtual prototype simulators in MSC ADAMS to examine the GAP (ground articulating pipeline) torque requirements and GAP carriage-oil sand terrain interactions. They used a contact force model similar to that in [10] to account for GAP track-oil sands interactions. They also used flexible oil sand model to illustrate the dynamic deformation of oil sand terrain under GAP carriage motion. Frimpong and Thiruvengadam [12,13] formulated the kinematic and dynamic equations of motion that govern the two types of propelling motion of the shovel crawler track (P&H 4100C BOSS Electric Shovel in Figure 1) on flexible oil sand terrain based on multibody dynamics theory. Their study developed the 3-D virtual prototype simulator of crawler track interacting with oil sands terrain within MSC ADAMS and reported the simulation results for crawler track shoe kinematic quantities (linear and angular displacement, velocity and accelerations). In this paper the time varying contact forces that are used as an input to calculate crawler shoe kinematic quantities reported in Frimpong and Thiruvengadam [12,13] are presented.
Rigid multi-body dynamics of crawler-terrain interactions
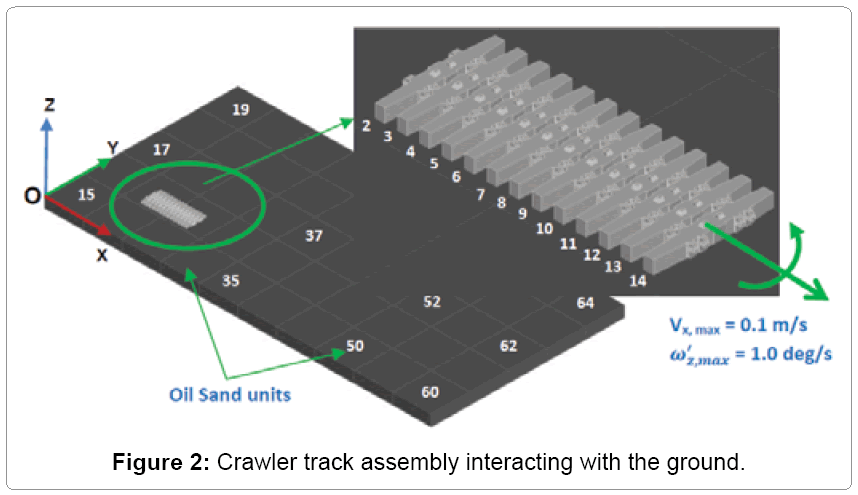
Figure 2 shows the geometry of crawler track assembly interacting with oil sand terrain. The track is modeled using the crawler track dimensions for the P&H 4100C Boss in Table 1. The crawler track is assembled from crawler shoes connected together by two link pin joints. One link pin is made a spherical joint and the other link pin is made a parallel primitive joint to create equivalent revolute joint between two crawler shoes. The crawler shoe model is generated in Solidworks based on the actual crawler shoe model for P&H 4100C Boss shovel [14]. Similarly, the oil sand terrain is made up of spring- damper-oil sand units connected to four adjacent oil sands units by spherical joints [10]. The stiffness (k) and damping (c) values of oil sand terrain are listed in Table 2. Only the open track chain of the crawler assembly, in contact with the ground Figure 1, is used for this study. More details on the dimensions, joints and material properties of crawler shoe and oil sand units can be found in Frimpong and Thiruvengadam [12,13].
| Width of Crawler Shoes | 3.505 m |
| Width of Crawlers | 12.8 m |
| Length of Crawlers | 11.6 m |
Table 1: Crawler dimensions of P&H 4100C Electric Shovel [1].
| Stiffness(k) (MN/m) | Damping (c) (kN-s/m) |
|---|---|
| 20 | 120 |
Table 2: Oil sand properties [11].
The global coordinate system is located at the left corner of the oil sand terrain at point O as shown in Figure 2. The position of the center of mass of crawler shoes 1 - 13 and oil sand units 15 and 64 at time t = 0 with respect to the global coordinate system are listed in Table 3. The joint locations of spherical and parallel primitive joints between each crawler shoes are listed in Table 4.
| Part Name | Part No. | Center of Mass Global Position (m) | ||
|---|---|---|---|---|
| x | y | z | ||
| CrawlerShoes | 2 | 10.1291 | 9.2901 | 0.2025 |
| 3 | 10.7848 | 9.2901 | 0.2025 | |
| 4 | 11.4406 | 9.2901 | 0.2025 | |
| 5 | 12.0963 | 9.2901 | 0.2025 | |
| 6 | 12.7521 | 9.2901 | 0.2025 | |
| 7 | 13.4078 | 9.2901 | 0.2025 | |
| 8 | 14.0635 | 9.2901 | 0.2025 | |
| 9 | 14.7193 | 9.2901 | 0.2025 | |
| 10 | 15.3750 | 9.2901 | 0.2025 | |
| 11 | 16.0308 | 9.2901 | 0.2025 | |
| 12 | 16.6865 | 9.2901 | 0.2025 | |
| 13 | 17.3423 | 9.2901 | 0.2025 | |
| 14 | 17.9980 | 9.2901 | 0.2025 | |
| Oil sand unit | 15 | 3.5 | 3.5 | -1.0 |
| 64 | 66.5 | 31.5 | -1.0 | |
Table 3: Position of crawler shoes and oil sand units at time (t = 0).
| Parts No. | Link Pin 1 Global Position (m) (Spherical Joint) | Link Pin 2 Global Position (m) (Parallel Primitive Joint) |
||||
|---|---|---|---|---|---|---|
| x | y | z | x | y | z | |
| Parts 2-3 | 10.4379 | 8.68 | 0.25 | 10.4379 | 10.03 | 0.25 |
| Parts 3-4 | 11.0936 | 8.68 | 0.25 | 11.0936 | 10.03 | 0.25 |
| Parts 4-5 | 11.7493 | 8.68 | 0.25 | 11.7493 | 10.03 | 0.25 |
| Parts 5-6 | 12.4051 | 8.68 | 0.25 | 12.4051 | 10.03 | 0.25 |
| Parts 6-7 | 13.0608 | 8.68 | 0.25 | 13.0608 | 10.03 | 0.25 |
| Parts 7-8 | 13.7166 | 8.68 | 0.25 | 13.7166 | 10.03 | 0.25 |
| Parts 8-9 | 14.3723 | 8.68 | 0.25 | 14.3723 | 10.03 | 0.25 |
| Parts 9-10 | 15.0281 | 8.68 | 0.25 | 15.0281 | 10.03 | 0.25 |
| Parts 10-11 | 15.6838 | 8.68 | 0.25 | 15.6838 | 10.03 | 0.25 |
| Parts 11-12 | 16.3396 | 8.68 | 0.25 | 16.3396 | 10.03 | 0.25 |
| Parts 12-13 | 16.9953 | 8.68 | 0.25 | 16.9953 | 10.03 | 0.25 |
| Parts 13-14 | 17.6511 | 8.68 | 0.25 | 17.6511 | 10.03 | 0.25 |
Table 4: Crawler shoe link-pin locations at time (t = 0).
Governing equations of motion and solution methodology
The kinematic and dynamic equations of motion that govern the propelling motion of the rigid crawler track on oil sand terrain based on multi-body dynamics theory [15,16] can be found in Frimpong and Thiruvengadam [12,13]. Frimpong and Thiruvengadam [12,13] presented kinematic equations governing pin joints between adjacent crawler shoes, spherical joints between adjacent oil sand units and motion constraints applied on crawler shoes and oil sand units.
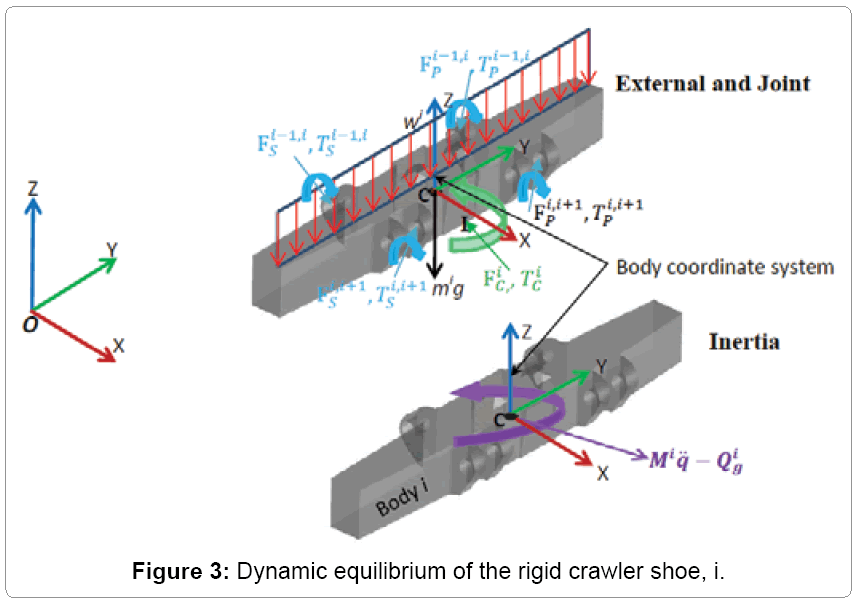
The free body diagram of a crawler shoe i with inertia forces in dynamic equilibrium with external and joint constraint forces is shown in Figure 3 [16,17]. The external forces acting on the crawler shoe # i are the gravity force (mig) due to self-weight of the shoe, uniformly distributed load (wi) due to machine weight and contact forces Fci, Tci due to interaction between crawler shoe i and ground as shown in Figure 3. The joint forces at the spherical joints ( and
and  ) and parallel primitive joints (
 and
and  )are also shown in Figure 3 For 63 interconnected rigid multi-body system shown in Figure 2, the differential-algebraic equations of motion can be written from Shabana and MSC [16,18] as in equation (1).
 (1)
(1)

M - Mass matrix of the system; u - vector of system generalized coordinates; K - constraint equations due to joints and applied motion; Qa - Applied forces; Qg - gyroscopic terms of the inertia forces.
Frimpong and Thiruvengadam [13] presented detailed formulation for the generalized inertia and external forces acting on the crawler shoes and oil sand unit. They also discussed solution methodology used in MSC ADAMS to solve the dynamic equations of motion along with kinematic equations to simulate the 3-D virtual prototype model of the crawler track propelling on the oil sand terrain and reported simulation results for crawler track shoe’s linear and angular displacement, velocity and accelerations. However, that study did not present the solution results for the external forces, which are used as an input in the determination of crawler shoe kinematic (linear and angular acceleration, velocity and displacement) quantities.
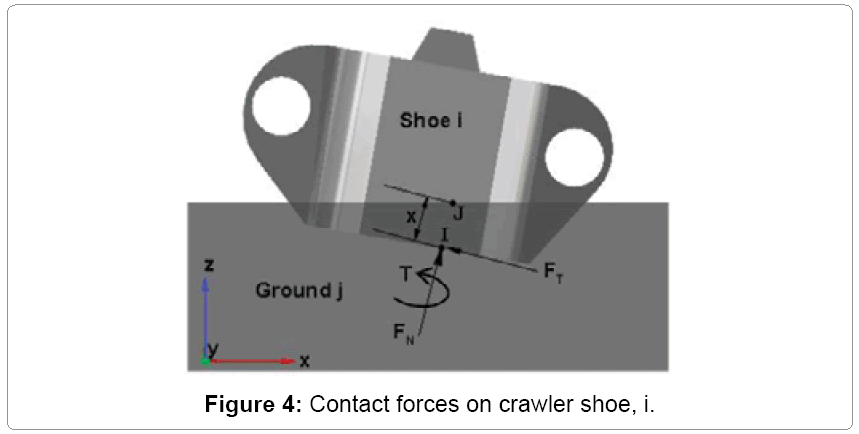
The gravity force and distributed load on each crawler shoes are constants and are entered directly into the MSC ADAMS as user input. The contact force however acting on each crawler shoes is a time varying force and is calculated using the inbuilt contact force algorithm in MSC ADAMS. The contact forces consist of normal force, frictional force and frictional torque. Figure 4 shows the contact forces (Fn-normal, Ft-tangential and T-torque) developing between track shoe i and ground [11,17]. These forces will act on the crawler shoe shoe bottom surface at a point I [18] as shown in Figure 4. The normal force vector  acting at point I for the crawler shoe i, shown in Figure 4, is calculated using the impact function model in MSC ADAMS. In this model, when two solid bodies come in contact with each other a nonlinear spring damper system is introduced to determine the normal force [18-20].
 (2)
(2)
The coulomb friction model in Adams is used for the calculation of tangential friction force vector  shown in Figure 4. Based on this model, the frictional force acting at point I can be expressed as equation (3) [11,18,19].
 (3)
(3)
 = friction coefficient defined as a function of slip velocity vector Vs at contact point I [18,19]. The contact parameters listed in Table 5 are used in the study for calculating normal and tangential forces. The contact force on crawler shoe i is the vector sum of normal and frictional forces given by equation (4).
 (4)
(4)
| NormalForce | Friction Force | ||
|---|---|---|---|
| Contact Stiffness (k, N/m) | 1.0E+08 | Static Coefficient (μs) | 0.4 |
| Max. Contact Damping (cmax, N-s/m) | 1.0E+04 | Dynamic Coefficient (μd) | 0.3 |
| Force Exponent (e) | 2.0 | Static transition velocity (Vst, m/s) | 0.01 |
| Max. Penetration Depth (d, m) | 1.0E-04 | Dynamic transition velocity (Vd, m/s) | 0.1 |
Table 5: Contact parameters used in the study [10,18].
The friction torque  about the contact normal axis shown in Figure 4 impedes any relative rotation of shoe i with respect to the ground [19]. This torque is proportional to the friction force
  [19].
[19].
 (5)
(5)
R = radius of the contact area.
The time varying contact forces are presented for two types of propelling motion constraints imposed on the crawler track [12]. In the first motion type, the crawler track is given only translation motion, and in the second type, the crawler track is given both translation and rotation motion. In addition, the crawler shoe joint constraint forces and torques and total deformation of the oil sand terrain are presented as part of the solution to the equations of motion. The normal and frictional contact force results play a major role in the dynamic stress analysis and subsequent fatigue study of the flexible crawler shoes. The reaction forces and torque acting at the crawler shoe joints represent the loading at the pin joint and has a direct bearing on the link pin wear and tear which in turn will impact the crawler shoe fatigue life [2].
Results and Discussions
The virtual prototype of the crawler track assembly shown in Figure 2 is modeled in MSC ADAMS [12] to simulate the crawler propel action on oil sand terrain for the two types of motion constraints. The virtual simulation is carried out for the time period of 10 s and the resulting dynamic variation of contact forces on each crawler shoes, reaction forces from the crawler shoe joints and total deformation of the oil sand terrain are presented in this section for the two motion constraints.
Case 1: Only translation: The comparison of the time distribution of crawler shoe sinkage into the oil sand and sinkage velocity at the contact point is shown in Figures 5a and b for Parts 2, 5, 8, 11 and 14. These values are used in the calculation of contact normal forces acting on each crawler shoes. Parts 2, 5, 11 and 14 always lie on the same oil sand unit during its 10 s propel motion and hence they have continuous variation in penetration depth. Part 8 lies on both oil sand units 7 and 12 (Parts 21 and 26) at the beginning of simulation. The MSC ADAMS contact algorithm for Part 8 detects one intersection volume between 0 - 4.1 s and three intersection volumes between 4.1 - 5.3 s in oil sand unit 7 (Part 8_OSUnit 7 in Figure 5a). This is because, at 4.1 s, Part 8 is at the edge of the oil sand unit 7 and, at 5.3 s, Part 8 has completely left the oil sand unit 7 and lies only on oil sand unit 12 (Part 8_OS Unit 12 in Figure 5a) for the rest of the simulation time. During the 10 s propel, Part 8 has only one intersection volume in oil sand unit 12 and has continuous penetration depth variation with time as in Figure 5a. It can also be seen that all crawler shoes have oscillations in their values during the entire translation motion. This is due to the bouncing, rolling and pitching motion induced by the stiffness and damping properties of the oil sand. The sinkage and sinkage velocity distributions show that a maximum continuous penetration depth fluctuation of 4.0 to 7.4 cm and a maximum sinkage velocity fluctuation of -0.48 to + 0.56 m/s occurs for Part 8 when transition from oil sand unit 7 to 12 occurs. It can also be found from Figure 5 that the average penetration depth in the ground for each crawler shoe is between 5.9 - 6.7 cm.
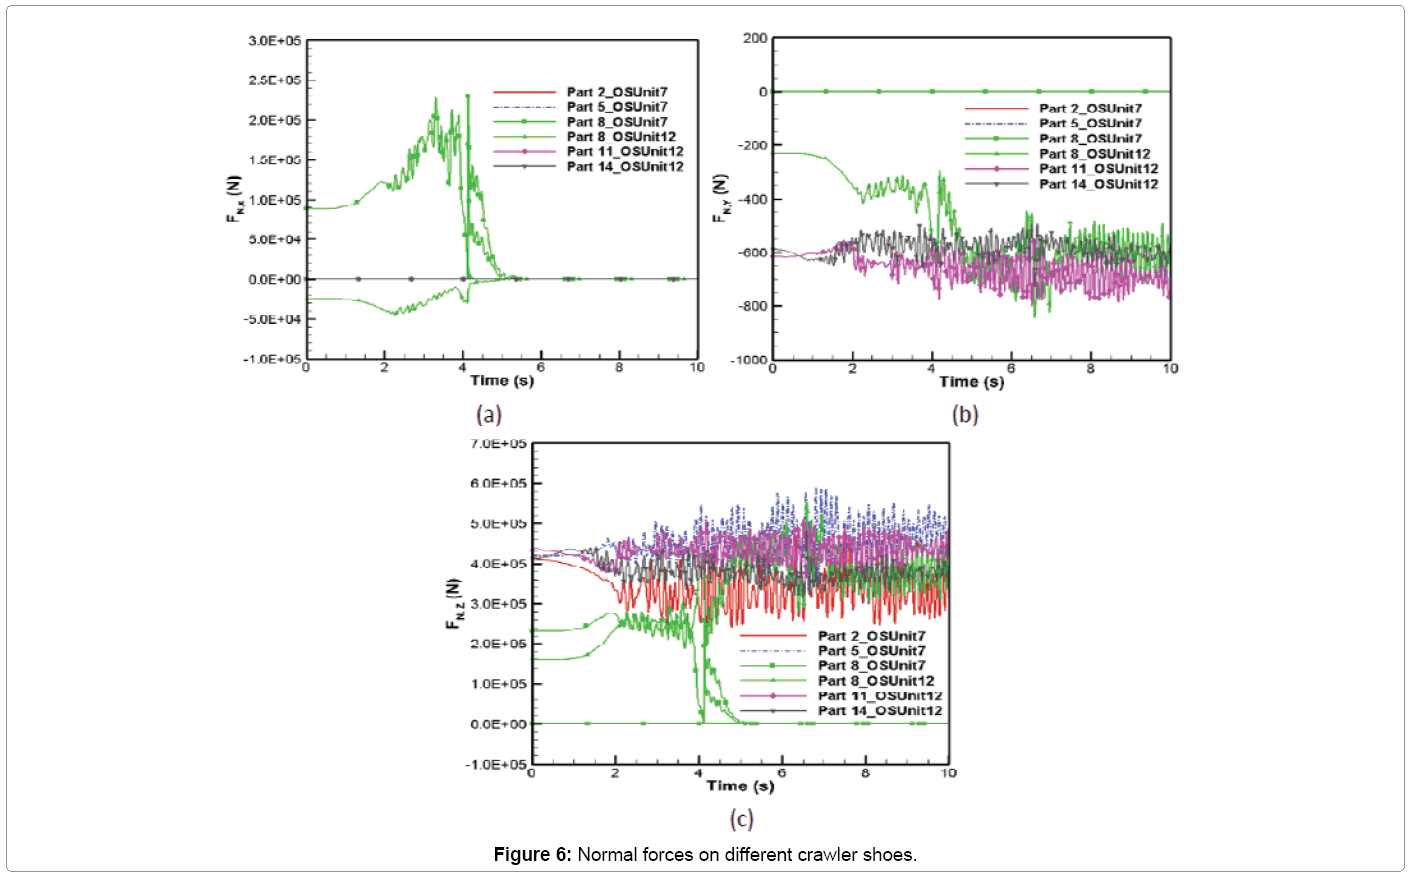
The normal force vector (FN) variation with time along x, y and z directions is shown in Figure 6. These values depend on the stiffness and damping characteristics of nonlinear spring damper system introduced in MSC ADAMS when two bodies come into contact with each other. They also depend on sinkage and sinkage velocity variation with time shown in Figure 5. It can be seen from Figure 6 that the normal force is dominant in the z-direction for all the crawler shoes. It can also be seen that, with the exception of Part 8, the other crawler shoes have negligible normal force contribution in the longitudinal (x) direction. When Part 8 lies on both oil sand units 7 and 12, the normal force develops component along x direction and, when Part 8 moves completely to oil sand unit 12 at 5.3 s, the normal force component along this direction becomes negligible as shown in Figure 6a. This generation of normal force for Part 8 between 0-5.3 s is compensated by a decrease in the normal force in the z-direction for that period of time as shown in Figure 6c. The normal force component in y-direction (Figure 6b) for all the crawler shoes is small and negligible. The maximum magnitude of normal force along the longitudinal (x), lateral (y) and vertical (z) directions are given by 2.3 × 10⁵ N, 842.1 N and 5.9 × 10⁵ N, respectively. The magnitude of maximum averaged normal force along x, y and z directions are given by 50249.4 N, 657.9 N and 4.56 × 10⁵ N, respectively.
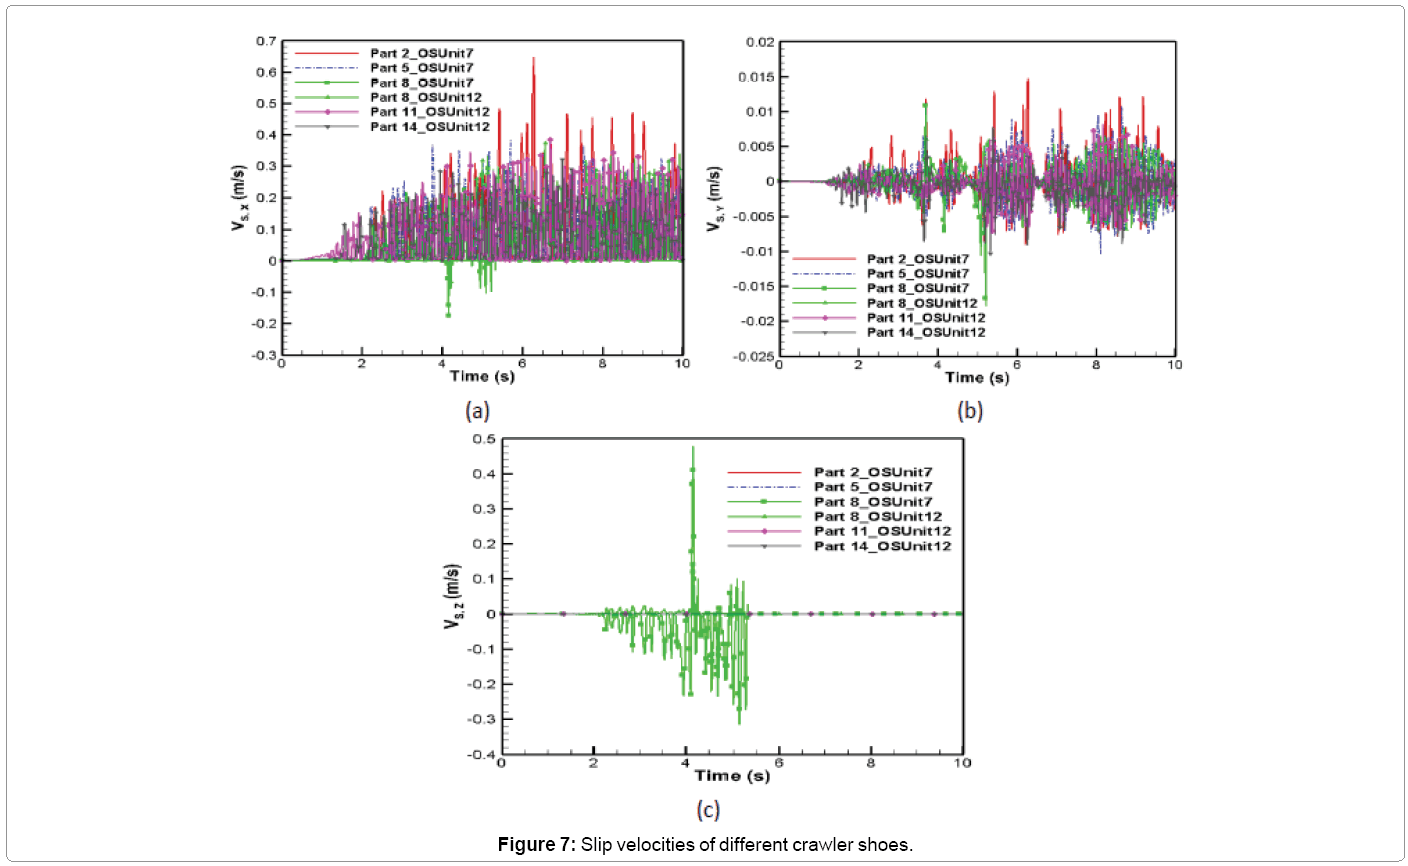
The comparison of variation of slip velocity vector with time at the contact point on five different crawler shoes is shown in Figure 7. The large fluctuations in the slip velocities can be seen from Figure 7. The slip velocity vector is tangential to the normal force vector shown in Figure 6. The components of slip velocity vector along the x, y and z directions determine the coefficient of friction values which is used in the calculation of tangential or frictional forces at the contact point on each crawler shoes. It can be seen from Figure 7b that the slip velocity in the y-direction is small compared to the slip velocity in the x-direction Figure 7a. The slip velocity is approximately zero for Parts 2, 5, 11 and 14 in the z- direction but for Part 8, a large slip velocity develops in that direction due to discontinuity in the terrain when Part 8 moves from oil sand unit 7 to 12 as shown in Figure 7c. The maximum average slip velocities in the x, y and z-directions are 0.077 m/s, 0.00066 m/s and 0.0064 m/s, respectively.
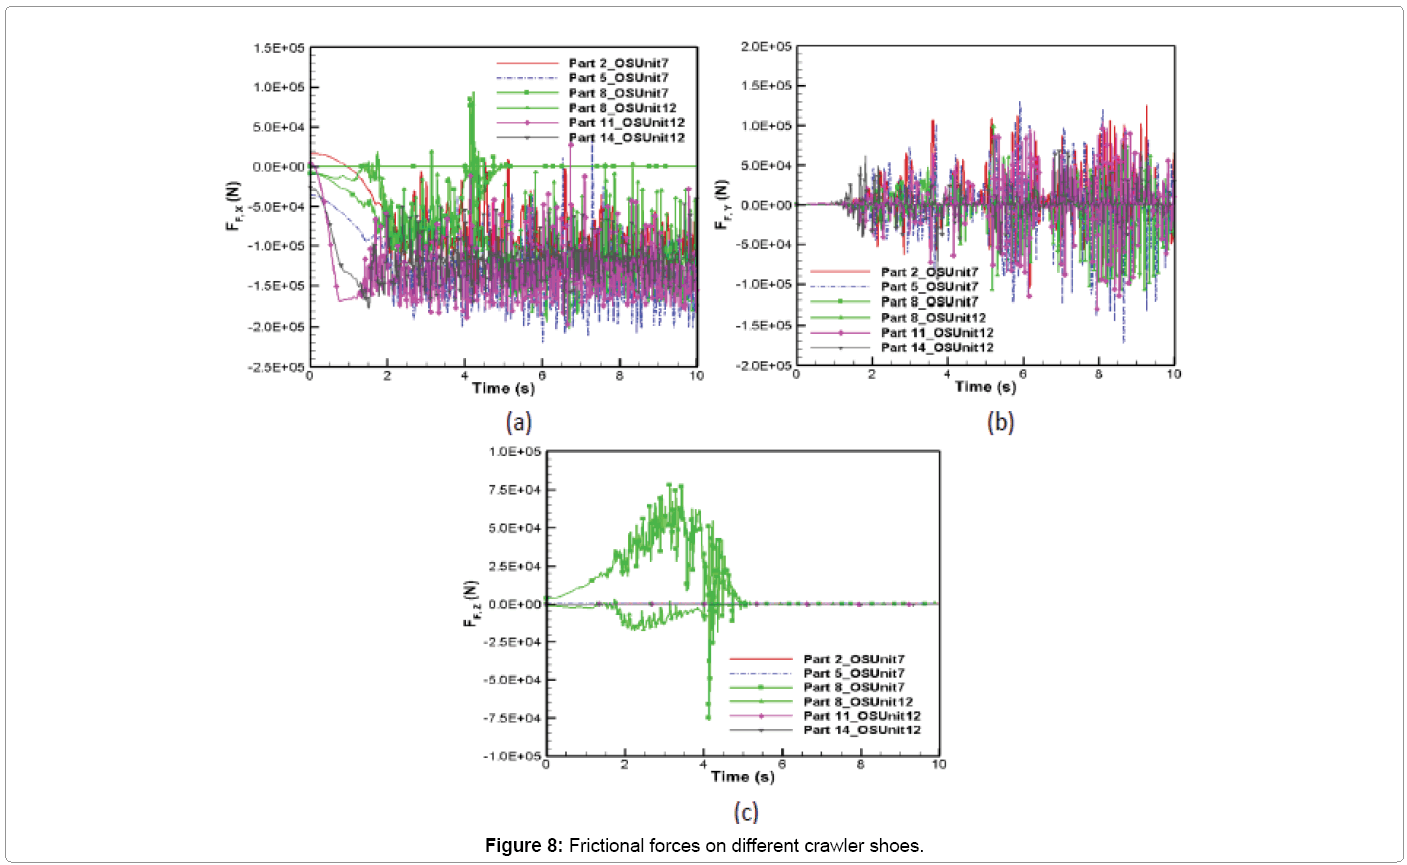
The comparison of time variation of frictional force vector at the contact point is shown in Figure 8. The components of frictional force vector along x, y and z directions are calculated using the friction coefficient (estimated from the slip velocity) and normal force. It can be seen that the frictional force is dominant in the x-direction with an average magnitude of 1.1 × 10⁵ N. The frictional force fluctuates in the y-direction with a maximum mean value of 5860 N. For Parts 2, 5, 11 and 14, similar to normal force being negligible in the x-direction (Figure 6a), the tangential force is negligible in the z-direction (Figure 8c). This is because normal force vector is nearly perpendicular to x-y plane and tangential force vector lies on the x-y plane. However, for Part 8 similar to normal force developing large component in the x-direction between 0 and 5.3 s (Figure 6a), the tangential force vector also develop large component along the z-direction during the same time period as shown in Figure 8c with a maximum mean value of 11,887 N. This is due to normal force vector not being nearly perpendicular to x-y plane (contact force diagram in Figure 4) when Part 8 moves from oil sand unit 7 to 12 between 0 and 5.3 s. This increase in the tangential force in the z direction leads to a decrease in the frictional force in x direction for Part 8 as shown in Figure 8a. The maximum magnitude of frictional force along the longitudinal (x), lateral (y) and vertical (z) directions are given by 2.2 × 10⁵ N, 1.73 × 10⁵ N and 7.82 × 10⁴ N, respectively.
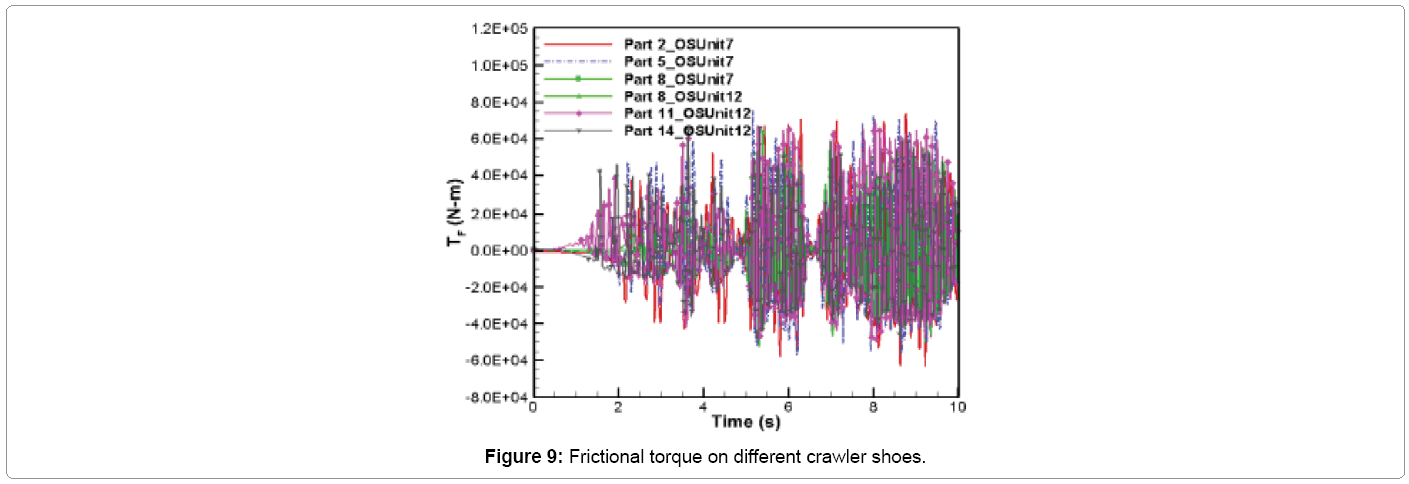
The variation of frictional torque about the contact normal axis with respect to time is shown in Figure 9. The frictional torque develops when the crawler shoe has angular velocity about contact normal force axis (axis along which normal force vector (FN) acts. This torque is proportional to the frictional force vector (FT) perpendicular to the normal force vector (FN) and retards relative rotation between crawler shoes and oil sand [18]. It can be seen from Figure 9 that the frictional torque variation with time is similar to frictional force distribution along the y-direction (Figure 8b). This torque mainly retards the angular velocity of crawler shoes about the vertical z-axis. The maximum magnitude of this frictional torque is about 75707.9 N-m and the maximum average magnitude for this torque is 3058.1 N-m.
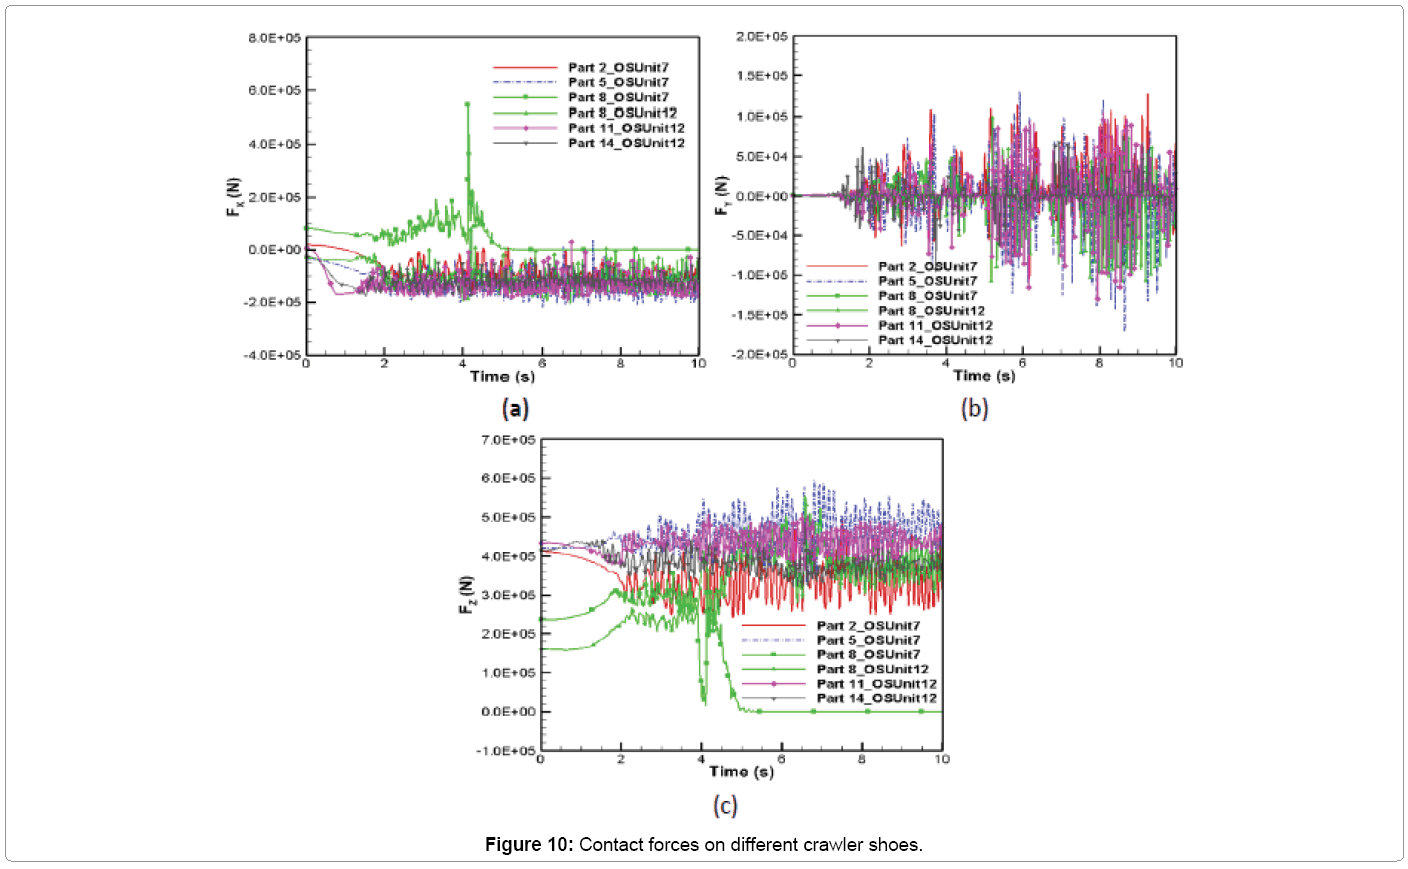
The contact forces acting along x, y and z directions with respect to time are plotted in Figure 10. These values are obtained by summing the normal force (Figure 6) and frictional force (Figure 8) in the respective directions. It can be seen that the contact forces in each direction fluctuates around a mean value for all crawler shoes. However, for Part 8 which moves from oil sand unit 7 to 12 between 0 and 5.3 s from the start of the propelling operation, separate contact forces develop with each oil sand unit as shown by two different curves for Part 8 in Figure 10. It can be seen from Figure 10b that the lateral sliding force is oscillating around the mean value close to zero. The maximum magnitude of the averaged longitudinal (x), lateral (y) and vertical (z) contact forces are 1.3 × 10⁵ N, 5866.4 N and 4.6 × 10⁵ N, respectively. It can be seen from Figure 10 that the maximum magnitudes of contact forces along longitudinal, lateral and vertical directions are 5.5 × 10⁵ N, 1.7 × 10⁵ N and 5.93 × 10⁵ N, respectively. The distribution of contact forces shows transient fluctuating forces acting on each crawler shoes that could build dynamic stress distribution in them leading to crack and eventual fatigue failure.
The reaction forces and moments induced at the spherical and parallel primitive joints connecting Parts 2 and 3, 5 and 6, 8 and 9, 11 and 12 and 13 and 14 is shown in Figure 11. Since no reaction torques is produced at the spherical joint, only the reaction forces along x, y and z directions for spherical joint are shown in Figures 11a-c. Similarly, since no reaction force are generated along the x, y and z directions at the parallel primitive joint, only the reaction torques about x, y and z axes induced at the primitive joint is shown in Figures 11d-f. It can be seen from Figure 11a that the reaction force along the x-direction on the spherical joint is dominant in comparison with forces in the other two directions (Figures 11b and 11c). This is due to the imposed translation driving constraint on crawler shoe 13 (Part 14) pulling the crawler track with prescribed velocity to maintain straight line motion in the global x-direction.
Similarly, the reaction torque about z-axis (Figure 11f) on the primitive joint is larger in comparison with torque about x and y axes (Figures 11d and 11e). The magnitude of maximum joint load or reaction force induced at the spherical joints along x, y and z directions are 2.4 × 10⁶ N, 1.4 × 10⁵ N and 1.4 × 10⁵ N, respectively. The maximum torque at the primitive joints about x, y and z directions is 1.3 × 10⁵ N-m, 4.0 × 10⁴ N-m and 1.5 × 10⁶ N-m, respectively. The maximum average reaction forces along x, y and z- directions are 1.4 × 10⁶ N, 6490 N and 8.4 × 10⁴ N, respectively. The maximum average reaction torques about x, y and z-directions are 5.2 × 10⁴ N-m, 1.8 × 10⁴ N-m and 8.6 × 10⁵N-m, respectively.
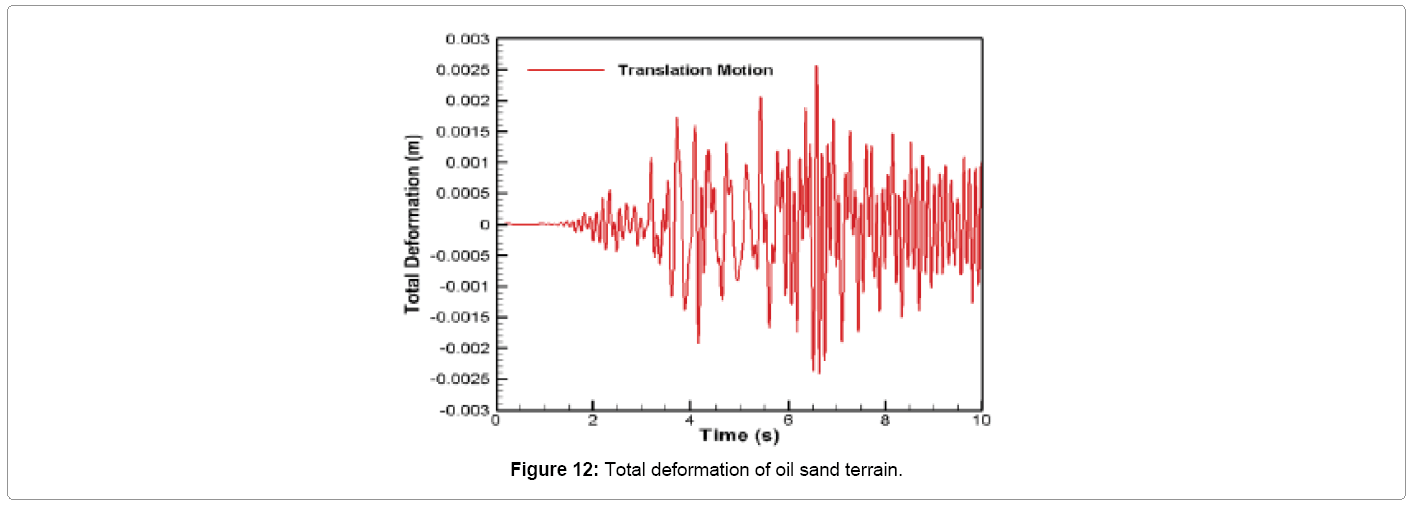
The time variation of total deformation of the oil sand ground due to straight line translation motion of the crawler track is shown in Figure 12. This value is obtained by summing all the deformations of the spring-damper oil sand units [11]. It can be seen from Figure 12 that during translation, the total deformation of the terrain fluctuates between 0.26 and -0.24 cm from its equilibrium value. The maximum deformation of 0.26 cm occurs at 6.58 s from the start of propel (i.e. after the crawler has attained its maximum translation velocity of 0.1 m/s at 5 s). When the crawler starts propelling at this maximum velocity, the total deformation fluctuation gradually decreases and attains an oscillating stable value between 0.13 and - 0.14 cm after 8.5 s as shown in Figure 12.
Case 2–Translation and rotation: In this case the shovel translates and turns with a prescribed velocity as discussed in kinematics part of this paper [12,13]. Due to space limitations, only results obtained for crawler shoe 10 (Part 11) is plotted and compared with the corresponding results from translation only motion type. The comparison results for other crawler shoes will have the same general behavior.
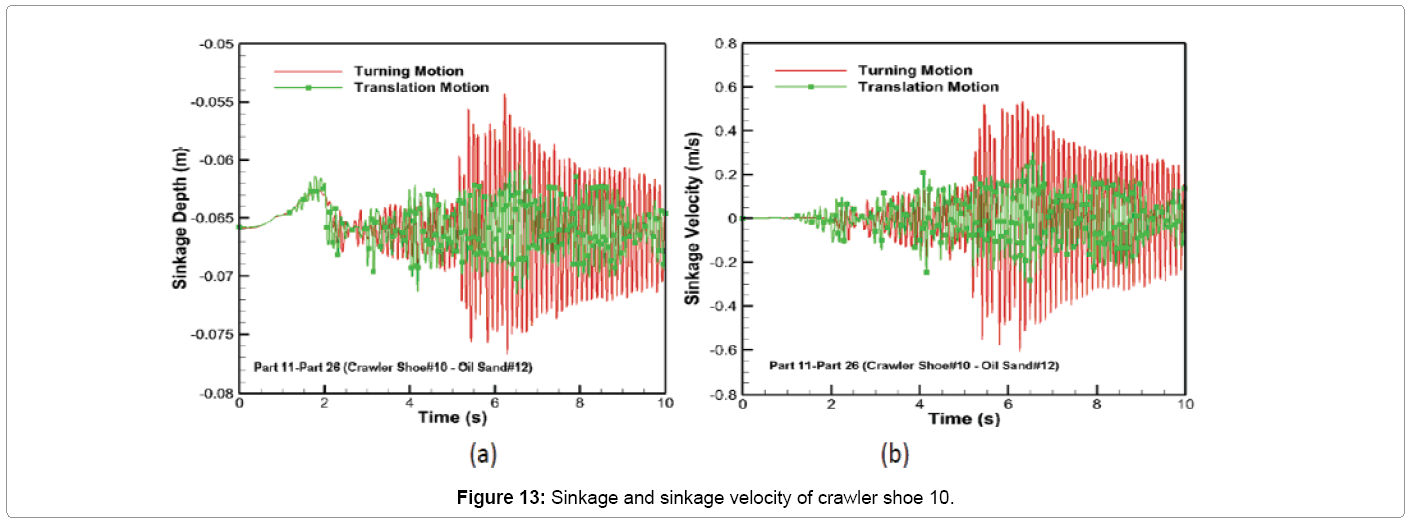
The comparison of penetration depth of crawler shoe 10 into the oil sand ground is shown in Figure 13a. The large bouncing motion of the crawler track during the unsteady period of the turning motion (between 5.2 – 10.0 s) causes the penetration depth of crawler shoe 10 to range from around -5.43 to -7.67 cm while for translation motion type this value ranges from -6.04 to -7.15 cm as shown in Figure 13a. However the average value of sinkage depth is approximately 6.57 cm for both types of motion. The time variation of sinkage velocity shown in Figure 13b for turning motion follows the behavior of penetration depth shown in Figure 13a. It can be seen for translation motion the sinkage velocity ranges between -0.3231 to 0.3023 m/s. But for turning motion this value ranges between -0.6076 m/s to 0.5346 m/s.
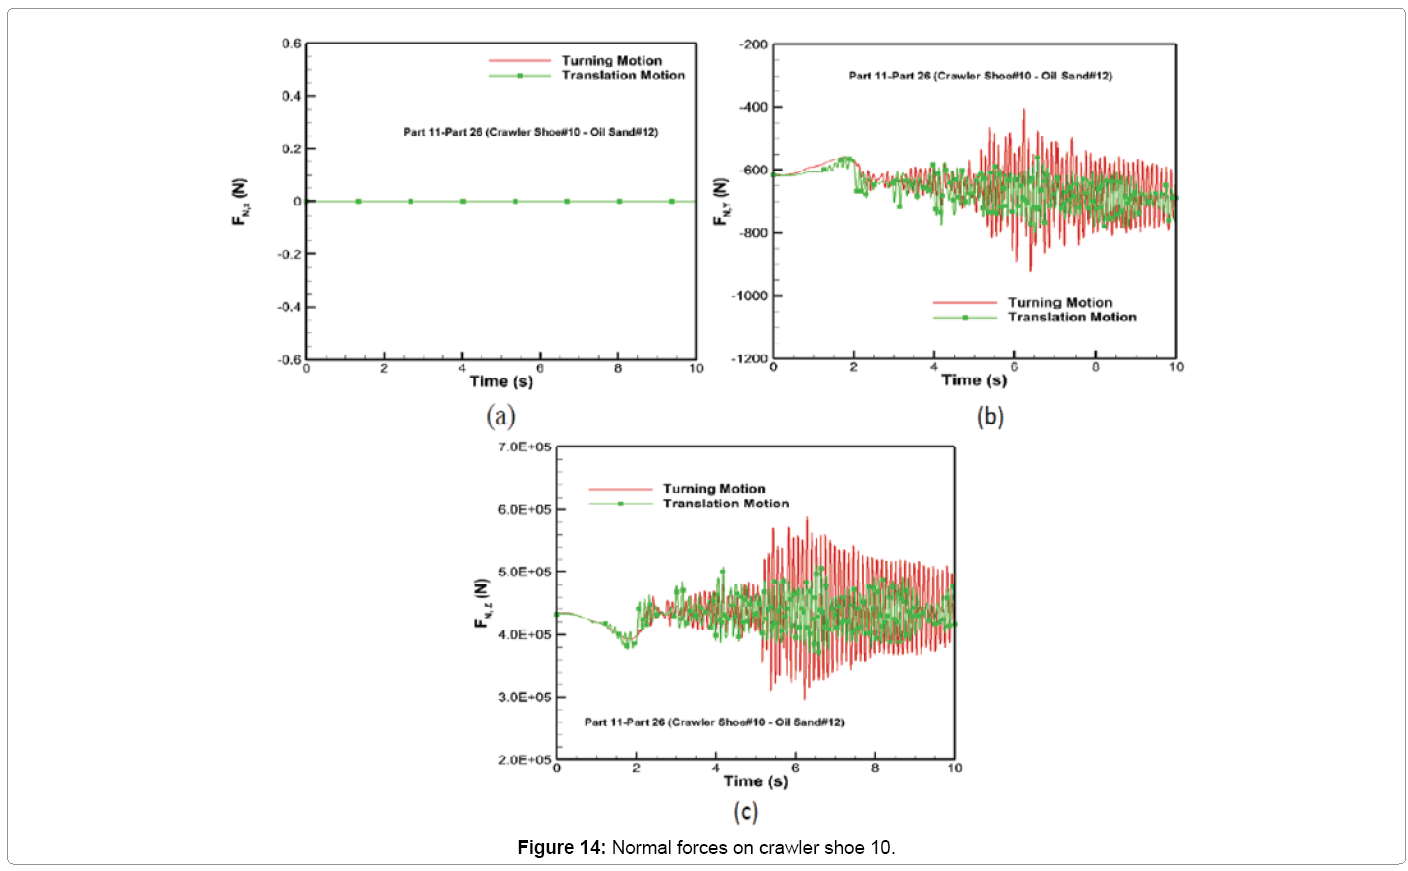
The time variation of normal force along x, y and z axes for both motion types for crawler shoe 10 is shown in Figure 14. The normal force has zero contribution along the longitudinal direction (x-axis) for both driving contraints as shown in Figure 14a. The normal force along the y and z-directions shown in Figures 14b and 14c for both motion types is similar except after halfway through the simulation time between 5.0 - 10.0 s where large unsteady behavior during turning motion increases the maximum magnitude of y and z normal force by 1.15 times in comparison with the corresponding magnitudes experienced during translation motion. The average magnitude of normal force along y and z directions for Part 11 remains approximately the same at 650 N and 4.3 × 10⁵ N for both motion types.
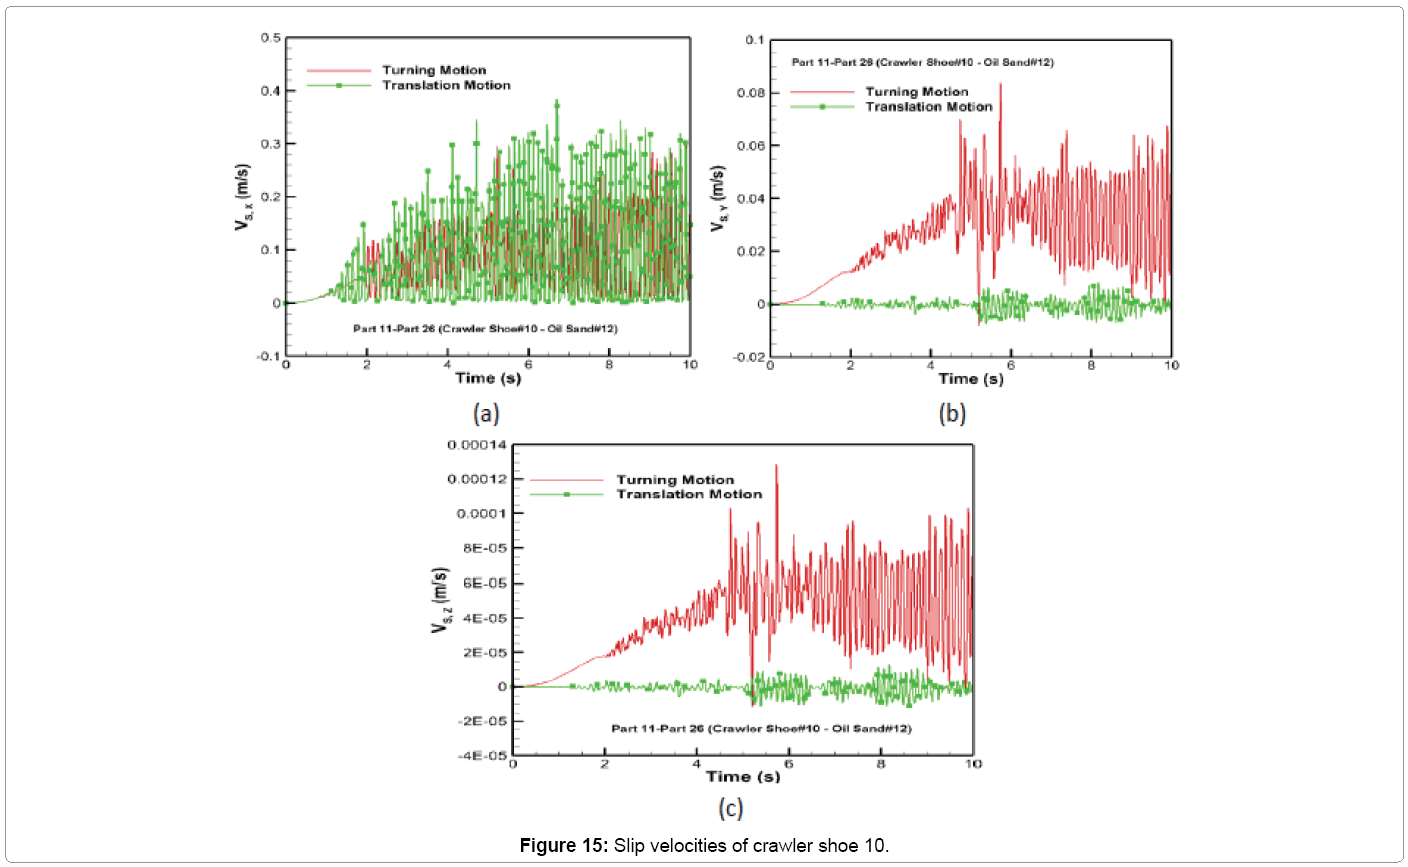
The comparison of slip velocities of crawler shoe 10 is shown in Figure 15. It can be seen from Figure 15a that the slip velocity in the x-direction for both motion types has similar behavior and fluctuates with an average velocity of around 0.08 m/s. This is due to the same translation constraint being applied for both motion types. Due to rotation driving constraint, the slip velocity in the y-direction for turning motion is larger in comparison with translation motion as in Figure 15b. The average y-slip velocity for turning motion is 0.027 m/s and that for translation is close to zero. The slip velocity in z-direction is shown in Figure 15c although an order of magnitude larger for turning in comparison with translation can still be neglected since their values are too small to cause large frictional forces in that direction.
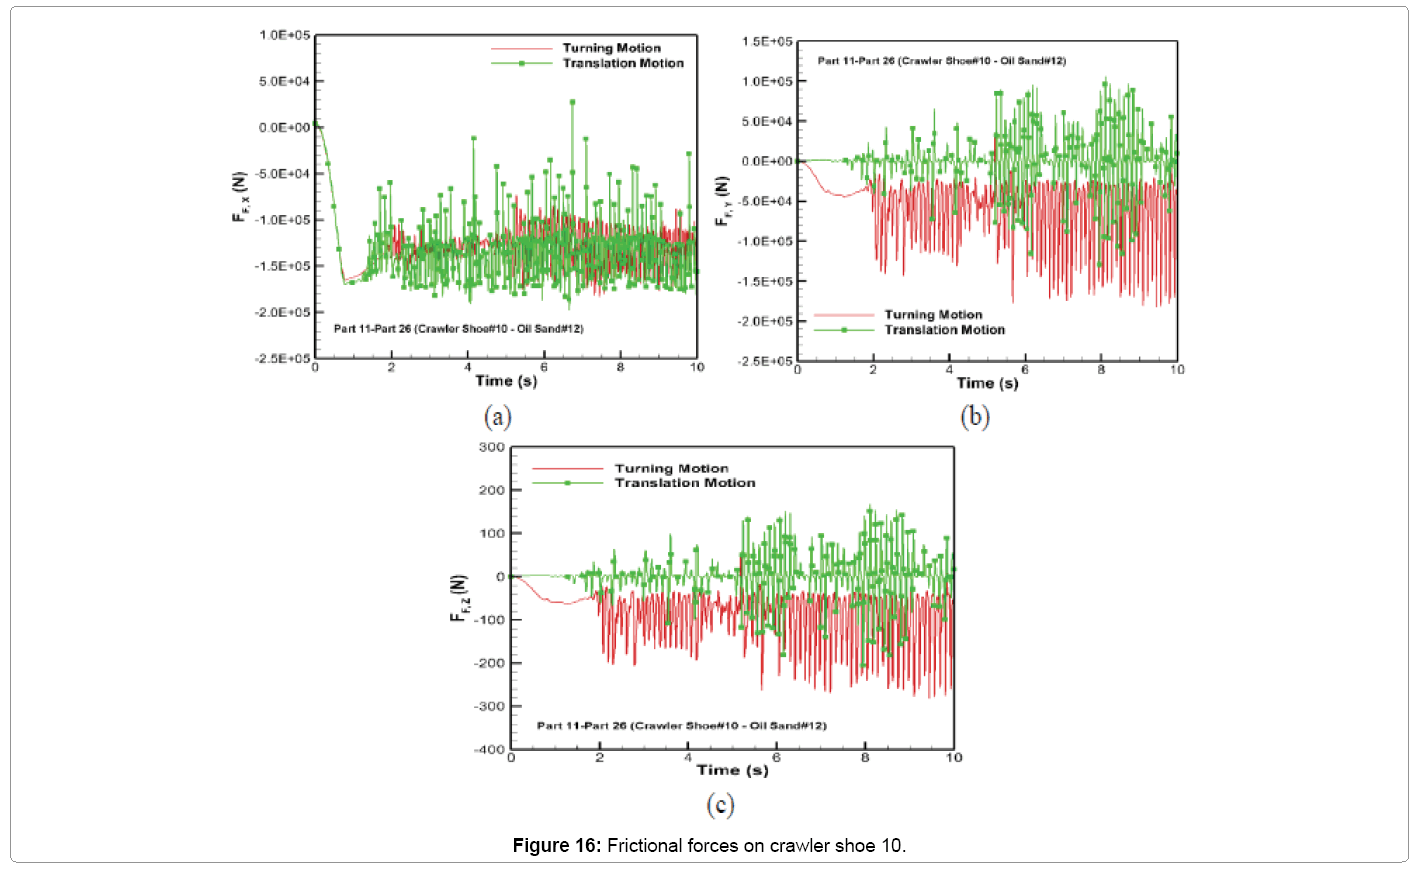
The comparison of the frictional forces for both motion types is shown in Figure 16. It can be seen from Figure 16a that the frictional force along x-direction during turning motion is similar to that of the translation motion. The frictional force along y-direction for turning shown in Figure 16b follows the y-slip velocity (Figure 15b) induced by the lateral sliding arising from rotational constraint on the crawler track. This causes large lateral frictional force during turning when compared with only translation. The frictional force along z-direction shown in Figure 16c for both motion types is negligible in comparison with their values along x and y directions. The maximum frictional force along y and z directions during turning is 1.4 times the value for only translation motion. The average values of the friction force along y and z directions during 10 s turning is approximately 30 times larger than the average values predicted for translation in these directions.
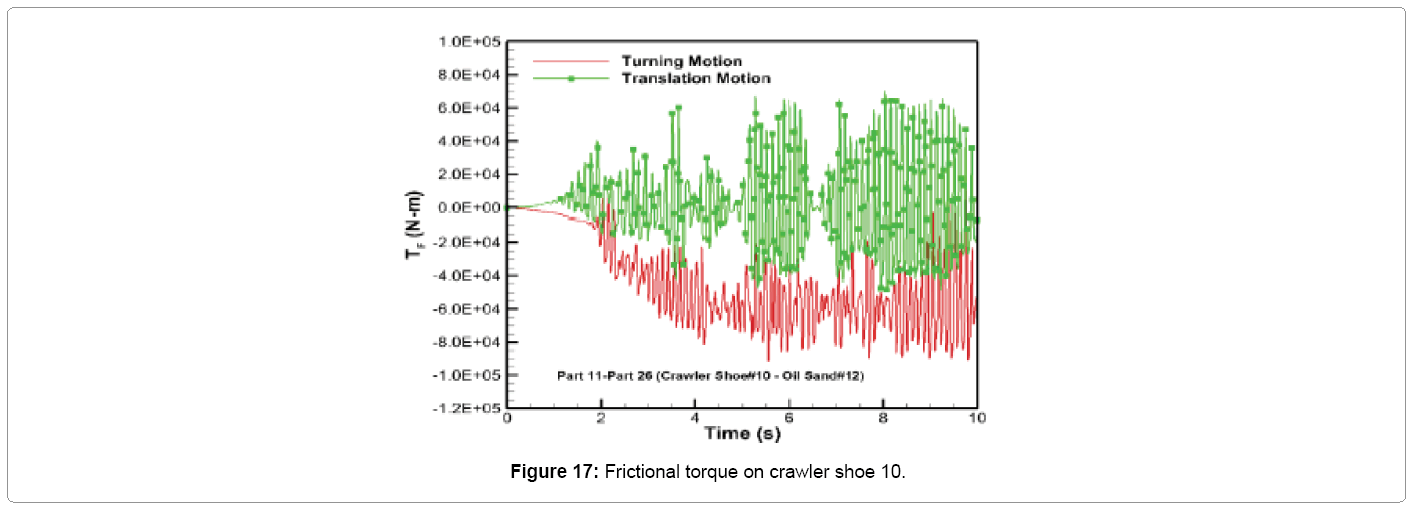
The comparison of frictional torque on crawler shoe 10 is shown in Figure 17. It can be seen from Figure 17 that the frictional torque for turning motion is predominantly acting in the clockwise direction (negative torque) in comparison with the fluctuating positive and negative torque induced for translation motion. This shows that the frictional torque is trying to prevent the rotational motion of the crawler track caused by the rotational driving constraint provided for turning. The maximum value for this torque is 9.2 × 10⁴ N-m (clockwise) which is nearly 1.9 times larger than the maximum clockwise torque predicted for the translation motion. The average magnitude of the frictional torque acting on Part 11 during turning motion is nearly 130 times larger than the average torque developed during translation motion.
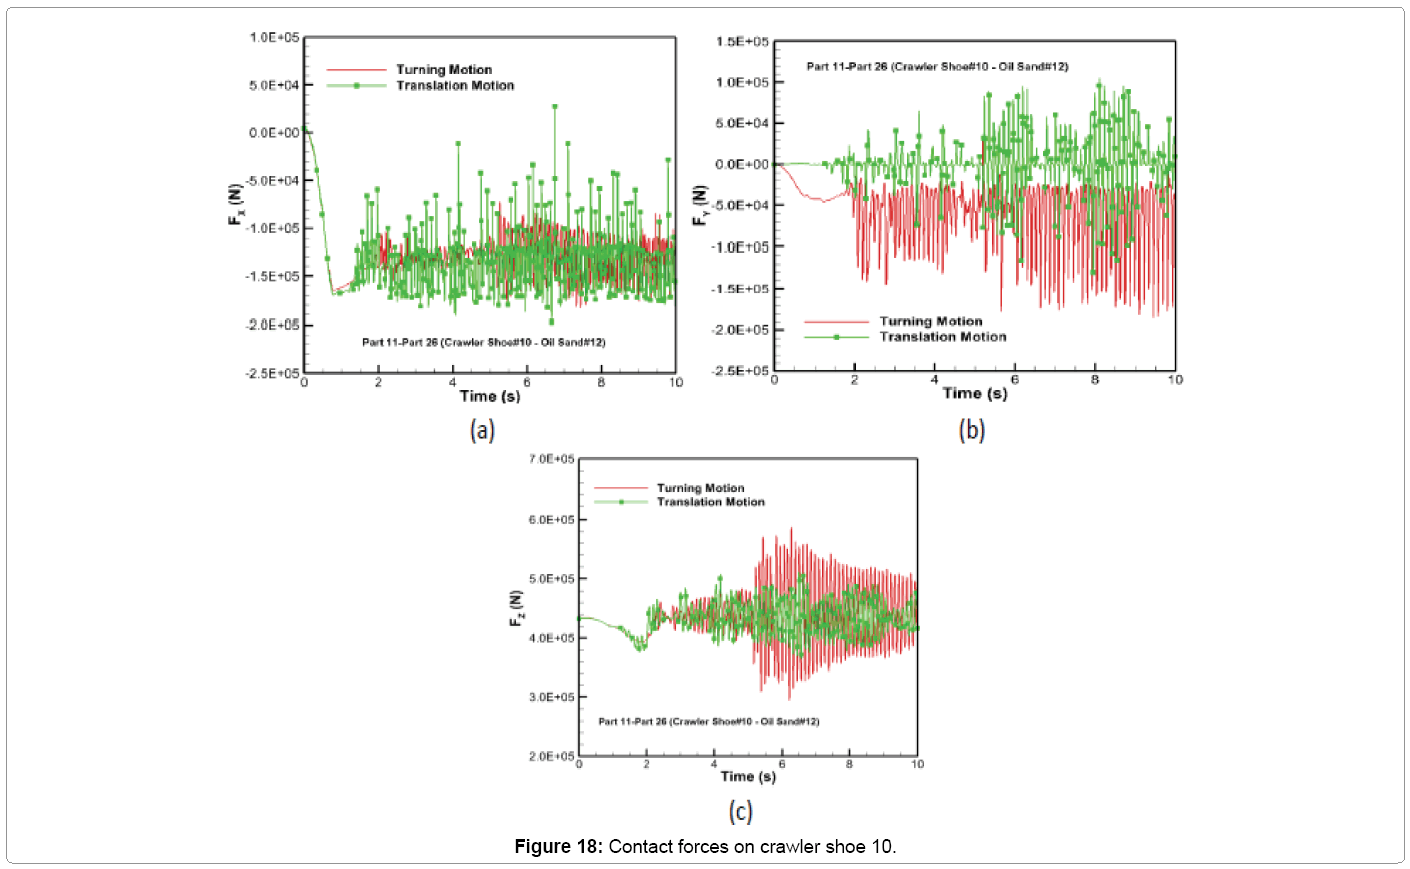
The time variation of resultant contact forces along x, y and z directions for the two types of motion constraints is shown in Figure 18 for crawler shoe 10. During turning, it can be seen that the contact force along x and y directions (FX and FY) shown in Figures 18a and b is similar to x and y frictional force distributions shown in Figures 16a and b. Hence frictional force dominates in the longitudinal and lateral direction for crawler shoe 10. Similarly the contact force for turning in the z-direction (FZ) shown in Figure 18c is similar to z-normal force distribution (Figure 14c). Hence normal force dominates in the vertical direction. Figure 18 also shows that the maximum contact force along the longitudinal, lateral and vertical directions for turning are roughly 0.93, 1.42 and 1.15 times the values for translation. The average contact force along x and z directions is approximately the same for both motion types. But the magnitude of the average contact force along y-direction has increased from 1030 N for translation to 54,300 N for translation with rotation. The prescribed rotational motion on Part 14 causing the crawler track to slide laterally on the oil sand is responsible for this increase in the lateral force (FY).
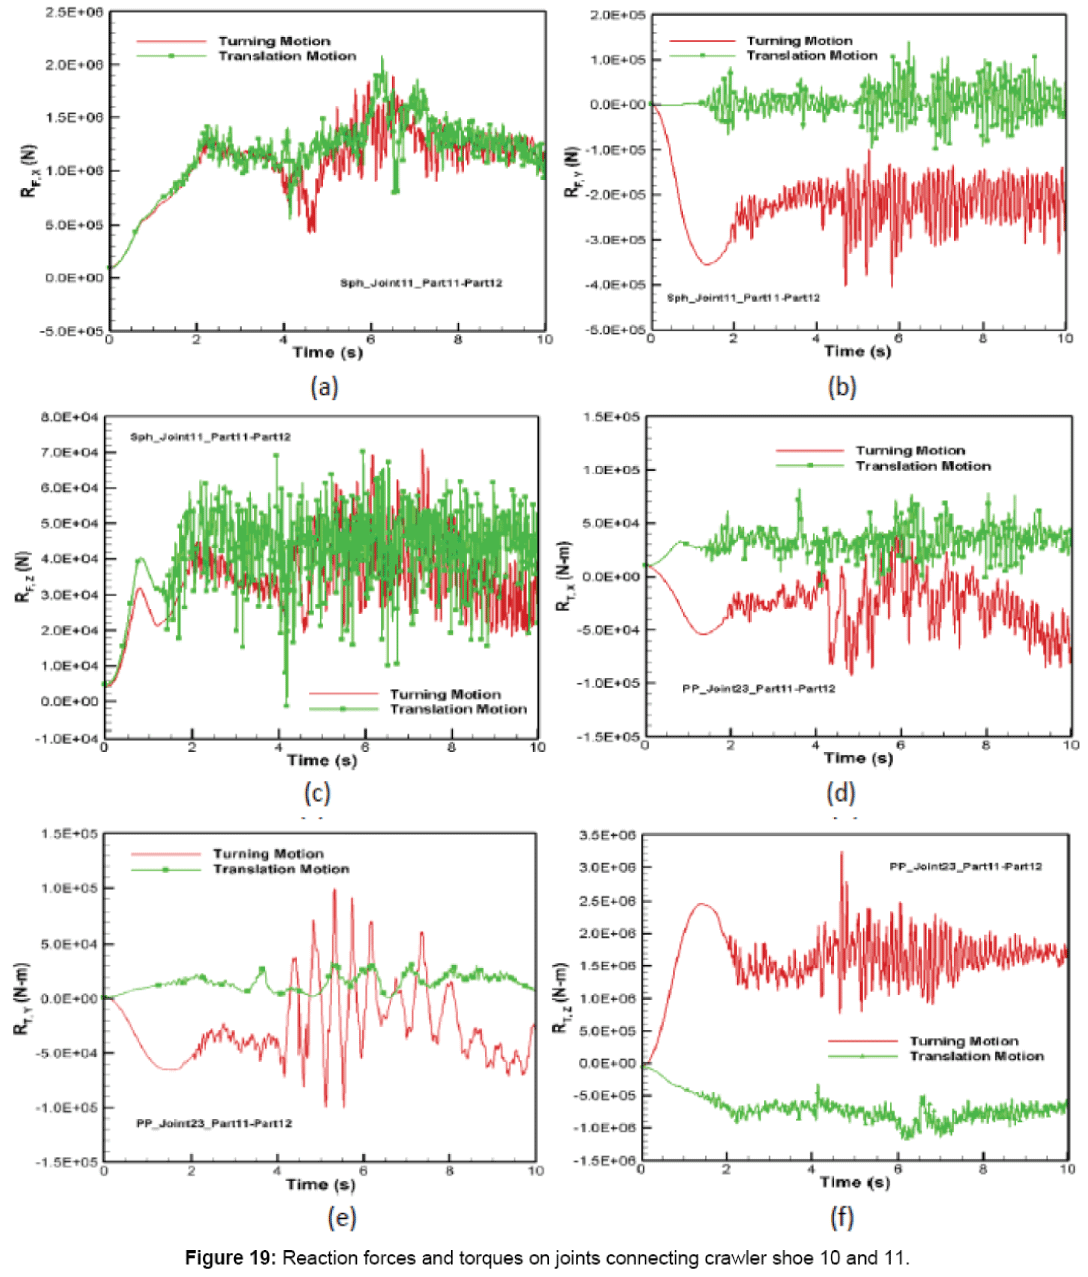
The comparison of reaction force and torque induced at the spherical and primitive joints that connect Parts 11 and 12 is shown in Figure 19. The reaction forces along x and z-directions for turning have similar behavior as translation as shown in Figures 19a and 19c. The reaction force along y-direction is large during turning and directed opposite to the sliding direction of the crawler track as shown in Figure 19b. The maximum reaction forces on spherical joint along x, y and z directions for turning are 0.91, 2.88 and 1.01 times the maximum value obtained for translation. Figures 19d-f show that in comparison with translation, the turning of the crawler track also increases the reaction torque about x, y and z axes on the primitive joint connecting Part 11 and Part 12. The maximum reaction torques acting at the primitive joint about x, y and z axes for turning are 1.13, 2.91 and 2.76 times larger than that predicted for translation. The average reaction forces acting along x, y and z directions for turning are 0.93, 34.0 and 0.8 times the values predicted for translation motion in these directions. Similarly, the average reaction torque about x, y and z axis are 0.82, 1.81 and 2.3 times the average values obtained for translation.
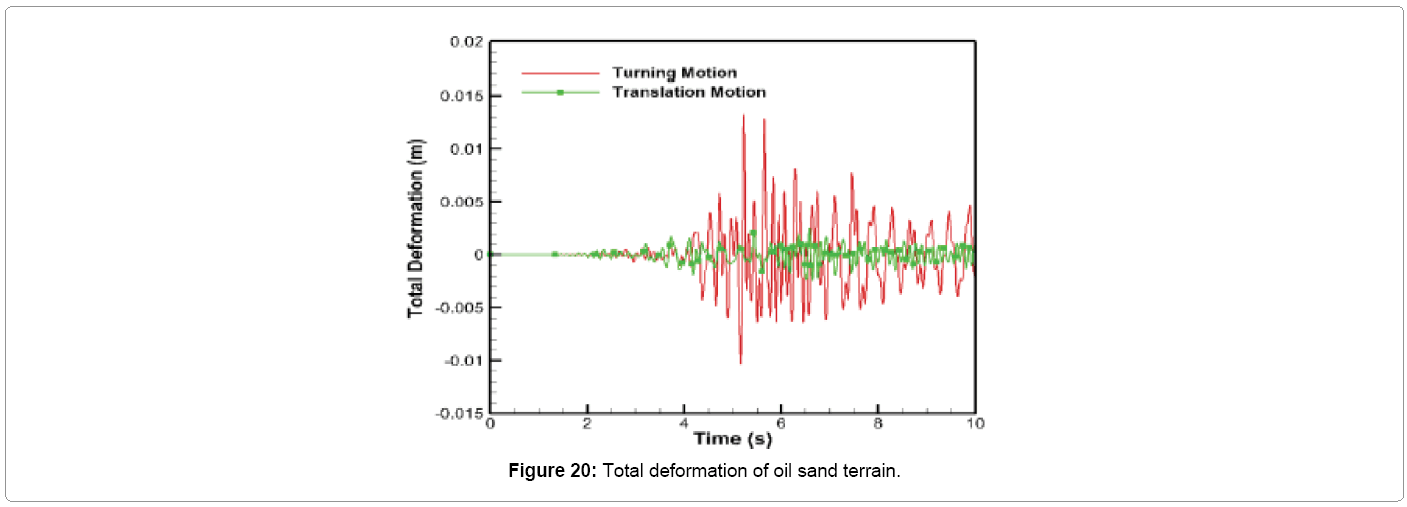
The deformation of oil sand terrain for the crawler track turn is plotted in Figure 20. During the start of the simulation between 0 and 4.5 s, the deformation behavior is similar to translation motion type also shown in Figure 20 for comparison purpose. But between 4.5 and 10.0 s, the unstable bouncing, rolling and pitching motion of the crawler causes the total deformation of oil sand to fluctuate between 1.33 and -1.03 cm from the equilibrium position. It can be seen from Figure 20 that the maximum total deformation of oil sand from the equilibrium position during turning is 5 times larger than that induced during translation.
Conclusions
A 3D virtual prototype of crawler track propel on the oil sand terrain is developed and simulated in MSC ADAMS. The simulation is carried out for two types of prescribed motion constraints on the crawler track. In the first motion type, the crawler track translates in the longitudinal direction with a prescribed velocity. In the second motion type, the crawler translates and rotates with prescribed velocity to produce turning motion. The track-terrain interaction is modeled using the contact force formulation in MSC ADAMS. The dynamic simulation of the crawler track propel for 10 s for both motion types show oscillations in the values of penetration depth, contact forces, joint forces and oil sand deformation. The penetration depth of crawler shoe in the oil sand terrain has an average value between 5.9 and 6.7 cm for both motion types. During translation, the maximum magnitude of the contact forces acting on the crawler shoes along longitudinal, lateral and vertical directions are 5.5 × 10⁵ N, 1.7 × 10⁵ N and 5.9 × 10⁵ N, respectively. Similarly, the joint loads on the link pin along these directions are 2.4 × 10⁶ N, 1.4 × 10⁵ N and 1.4 × 10⁵ N, respectively.
The addition of rotational constraint to the existing translation constraint on the crawler track causes large unsteady behavior during the middle of the turning motion. This large unsteady behavior increased the magnitudes of maximum lateral and vertical contact forces by 1.42 and 1.15 times its translation value and the maximum oil sand deformation from 0.26 cm for translation only to 1.33 cm for turning motion. The change in magnitude of the average contact forces during the turning motion is negligible in the longitudinal and vertical directions while its value along the lateral direction increased from 1,030 N for translation to 54,300 N for turning. The joint force maximum magnitude for the turning motion along longitudinal and vertical directions remains approximately the same as the translation motion while along lateral direction it increases by 2.9 times the value predicted for translation motion.
References
- Joy Global Inc (2012) 4100C BOSS Electric Mining Shovel - AC Drive Product Overview.
- P&H (2006) Peak Performance Practices. Excavator selection: Lower Works, P&H MinePro, Milwaukee, WI.
- Nakanishi T Shabana AA (1994) Contact forces in non-linear dynamic analysis of tracked vehicles. Int J for Numerical Methods in Engineering 37: 1251-1275.
- Choi JH, Lee HC, Shabana AA (1998) Spatial dynamics of multi-body tracked vehicles. Part I: Spatial Equations of Motion. Vehicle Systems Dynamics 29: 27-49.
- Lee HC, Choi JH, Shabana AA (1998) Spatial dynamics of multi-body tracked vehicles II: Contact Forces and Simulation. Vehicle Systems Dynamics 29: 113-137.
- Rubinstein D, Hitron R (2004) A Detailed Multi-Body Model for Dynamic Simulation of Off-road Tracked Vehicles. Journal of Terramechanics 41: 163-173.
- Ryu HS, Bae DS, Choi JH, Shabana AA (2000) A compliant track link model for high-speed, high-mobility tracked vehicles. Int J Numer Meth Engng 48: 1481-1502.
- Rubinstein D, Hitron R (2004) A Detailed Multi-Body Model for Dynamic Simulation of Off-road Tracked Vehicles. Journal of Terramechanics 41: 163-173.
- Madsen J (2007) High fidelity modeling and simulation of tracked elements for off-road. Applications using MSC/ADAMS.
- Ma ZD, Perkins NC (1999) A hybrid track model for studying dynamic track/sprocket contact. Proceedings of the ASME Noise Control and Acoustics Division 26: 147-155.
- Frimpong S, Galecki G, Li Y (2012) Dump truck tire stress simulation for extended service life. Transactions of the Society for Mining, Metallurgy and Exploration 332: 422-429.
- Frimpong S, Li Y, Suglo R (2013) Dynamic torque and soil deformation mechanics and simulation of the GAP machinery. Special Edition on Surface Mining. Journal of Powder Metallurgy and Mining 2: 2168-9806.
- Frimpong S, Thiruvengadam M (2015) Rigid multi-body kinematics of shovel crawler-formation. Interaction Int J of Mining Recl and Env, Taylor and Francis, UK.
- Frimpong S, Thiruvengadam M (2015) Multi-body dynamic modeling and simulation of crawler-formation interactions in surface mining operations. Global Journal of Research in Engineering 15: 29-49.
- (2015) Electric Rope Shovels. Joy Global Inc, Milwaukee, WI.
- Shabana AA (1998) Dynamics of Multi-Body Systems. (2ndedn), Cambridge University Press, New York, USA.
- Shabana AA (2010) Computational Dynamics. (3rdedn), John Wiley & Sons, New York, USA.
- Wong JY (2001) Theory of Ground Vehicles (3rdedn), John Wiley & Sons ,Inc, Canada, USA.
- MSC (2014) MSC ADAMS 2011/Solver Help Document. MSC Corporation, San Diego, CA.
- Lindberg D (2012) MSC ADAMS Modeling of Mechanical System in A400M Crew Entrance Door. Master Thesis, Linkoping Institue of Technology, Sweden.
Relevant Topics
- Additive Manufacturing
- Coal Mining
- Colloid Chemistry
- Composite Materials Fabrication
- Compressive Strength
- Extractive Metallurgy
- Fracture Toughness
- Geological Materials
- Hydrometallurgy
- Industrial Engineering
- Materials Chemistry
- Materials Processing and Manufacturing
- Metal Casting Technology
- Metallic Materials
- Metallurgical Engineering
- Metallurgy
- Mineral Processing
- Nanomaterial
- Resource Extraction
- Rock Mechanics
- Surface Mining
Recommended Journals
Article Tools
Article Usage
- Total views: 16365
- [From(publication date):
December-2015 - Apr 09, 2025] - Breakdown by view type
- HTML page views : 15114
- PDF downloads : 1251
