Conspicuity of Active Gastrointestinal Bleeding: Bleeding Rate Has Greater Impact on Dual-Energy Computed Tomography than Conventional Computed Tomography
Received: 25-Aug-2023 / Manuscript No. roa-23-111219 / Editor assigned: 28-Aug-2023 / PreQC No. roa-23-111219 / Reviewed: 11-Sep-2023 / QC No. roa-23-111219 / Revised: 18-Sep-2023 / Manuscript No. roa-23-111219 / Published Date: 25-Sep-2023 DOI: 10.4172/2167-7964.1000484
Abstract
Purpose: The aim of this study was to quantitatively assess the conspicuity of extravasated contrast-enhanced blood on 40 keV virtual monoenergetic images (VMI) and quantitative iodine density images at various slow bleeding rates in an arterial phase GI bleeding phantom.
Methods: Peristaltic extravasation of simulated contrast-enhanced blood (CT number: 400 HU at 120 kVp; viscosity: 3.5 Centipoise) at bleeding rates 0.04-0.36 mL/min was investigated. The conspicuity of extravasated contrast of SECT and 40 keV VMI of DECT was measured based on their respective CT attenuations and CNRs. Quantitative iodine density of DECT was measured to corroborate the findings of 40 keV VMI.
Results: At the bleeding rate of 0.36, 0.16, 0.09, 0.07, and 0.04 mL/min, the CNRs of 40 keV VMI were 8.66±3.71, 6.56±2.35, 6.77±2.10, 5.27±1.46, and 6.50±0.21, respectively, compared to 4.95±2.20, 4.21±0.85, 5.35±1.87, 3.83±0.95, and 4.72±0.93, respectively, for SECT. However, with the decrease of bleeding rate from 0.36 to 0.04 mL/min, the CNRs of 40 keV VMI decreased by 24.9%, compared to a decline of merely 4.6% of SECT. The average iodine density of extravasated contrast was 1.2 mg/cm3.
Conclusion: 40 keV VMI images significantly improve the conspicuity of GI bleeding in a phantom model. The significant loss of CNR at bleeding rates <0.36 mL/min, when compared with SECT, warrants attention and further study to assess DECT’s efficacy at slow GI bleeding patients. Iodine density quantification can be used to objectively measure contrast extravasation.
Keywords
GI bleeding; dual-energy CT; phantom; CNR
Introduction
Gastrointestinal (GI) bleeding is a common and serious condition that can be life-threatening, with mortality as high as 40% in patients with comorbidities if not detected and treated promptly [1]. GI bleeding can be categorized as overt (clinically visible) and occult (detectable only by laboratory testing). Furthermore, GI bleeding can be classified as upper or lower gastrointestinal in origin, based on the location proximal and distal to the ligament of Treitz, respectively.
Numerous methods are currently utilized for diagnosis and localization of GI bleeding, with endoscopy frequently used for initial evaluation [2]. Upper endoscopy has a sensitivity/specificity as high as 98% and 100%, respectively, while colonoscopy can accurately identify the site of bleeding in up to 90% of patients [3]. Disadvantages of endoscopy include the need for patient preparation and sedation, and limited availability, which significantly limit its utility in the acute setting. If negative, capsule endoscopy may be used to assess for potential sources of bleeding in the small bowel, but is limited by lengthy examination times, incomplete visualization of the entire GI tract, and potential for obstruction in the setting of bowel strictures [2]. Imaging plays a vital role in diagnosis and is frequently used in lieu of endoscopy due to high accuracy, widespread availability, and immediate access. Digital subtraction angiography (DSA) is a well-established means of diagnosis and is able to detect GI bleeding at rates of 0.5 mL/min or higher, but is invasive and may not be readily available [1]. Radiolabeled tagged red blood cell scanning offers detection at rates as low as 0.2 mL/ min but cannot always localize the site of bleeding precisely, and may not always be immediately available [1]. CT angiography (CTA) is an established and preferred first line method of detecting GI bleeding at rates as low as 0.3 mL/min [4, 5], with the advantage of widespread, around the clock availability, lack of bowel preparation, and ability to precisely localize the site of bleeding. CTA is particularly valuable in the emergent setting due to rapid access compared to other methods of diagnosis such as DSA, tagged red blood cell scanning, and endoscopy [2].
Dual-energy CT (DECT) offers substantial advantages over conventional, single-energy CT (SECT). By scanning at two different energy settings, DECT is capable of characterizing elements based on their unique x-ray absorption characteristics. Advantages of DECT over SECT include improved conspicuity of iodinated contrast, ability to quantify iodine concentration in a region of interest, and the ability to create virtual monoenergetic images (VMI). So far, numerous applications of DECT have been described that exploit these benefits, although there are relatively few reports pertaining to GI bleeding. Sun et al. reported high accuracy of 2-phase DECT bleeding protocol, replacing true unenhanced images with virtual unenhanced reconstructions and including iodine maps, allowing for a 30% reduction in radiation dose [6, 7]. Mohammadinejad et al. reviewed dual-source DECT in patients with active GI bleeding, and found that DECT offered no improvement in diagnosis of GI bleeding but improved confidence when active bleeding was absent [8]. However, neither study has investigated the effect of bleeding rate on the conspicuity of extravasated contrast in DECT in comparison with SECT. Liu et al. attempted to address this unmet need in a phantom model using a 1st-generation DECT scanner. They reported improved sensitivity, contrast-to-noise ratio (CNR), and GI bleeding detection rates at bleeding rate as low as 0.025 mL/min using 40 keV VMI images compared to SECT [9]. We are unaware of any other reports addressing this question. In this study, we sought to confirm the findings of Liu et. al using the latest DECT and an arterial phase GI bleeding phantom we designed in-house.
Methods
Arterial phase bleeding phantom
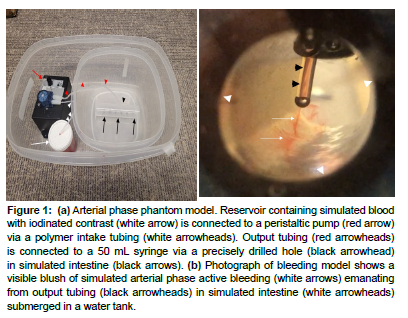
A 50 mL syringe (Becton, Dickinson and Company, Franklin Lakes, NJ) with a diameter of 26 mm to simulate the small bowel was connected to a peristaltic device which could be adjusted to pump fluid in bursts ranging between 10-20 per minute, resulting in variable rate of fluid flow ranging from 0.03 to 1.00 mL/min (Masterflex Low-Flow, Cole-Parmer Instrument, Vernon Hill, IL). A polymer tubing with an internal diameter of 1.6 mm connecting the syringe, the pump, and a graduated cylinder (reservoir) was fixed on the syringe through a precisely drilled hole to simulate angioectasias, which usually measure less than 5 mm [10] (Figure 1a).
To simulate blood combined with iodinated contrast, 25 mL 50% dextrose (Durvet Inc., Blue Springs, MO) was first mixed with 70.7 mL 0.9% saline in a graduated cylinder at room temperature. The viscosity of the resulting mixture was 3.5 centipoise, which matches the physiological viscosity of blood in the small arteries in the small bowel based on previous studies [11, 12]. Next, 4.3 mL Isovue 370 (Bracco Diagnostics, Monroe Township, NJ) was added to the mixture and thoroughly stirred to reach a target iodine concentration of 16 mg/cm3 and target CT value of 400 HU at 120 kVp to match the mean attenuation of contrast enhanced blood in aorta based on previous literature [13-15]. A couple drops of red food color was added to help visualize the bleeding (Figure 1b).
Figure 1: (a) Arterial phase phantom model. Reservoir containing simulated blood with iodinated contrast (white arrow) is connected to a peristaltic pump (red arrow) via a polymer intake tubing (white arrowheads). Output tubing (red arrowheads) is connected to a 50 mL syringe via a precisely drilled hole (black arrowhead) in simulated intestine (black arrows). (b) Photograph of bleeding model shows a visible blush of simulated arterial phase active bleeding (white arrows) emanating from output tubing (black arrowheads) in simulated intestine (white arrowheads) submerged in a water tank.
The simulated small bowel was submerged in a water tank and secured to the bottom by a low-density plastic fixture to prevent undesirable motion and vibration during CT acquisition. We designed the bleeding model to avoid the accumulation of iodine within the lumen of the simulated intestine, as the syringe is open on both ends and submerged in a tank filled with water. Any extravasated contrast would therefore dissipate freely and not accumulate within the imaged portion of bowel over time. Polymer tubing and low-density plastic were chosen to minimize beam hardening effects that could adversely affect the CT values of both simulated iodinated blood and the background (i.e., water). Five bleeding rates were investigated in this study: 0.36, 0.17, 0.09, 0.07, 0.04 mL/min. The bleeding rates were calibrated using a graduated cylinder for accuracy.
CT examination
CT acquisitions were performed on a Revolution CT with GSI Xtreme (GE Healthcare, Waukesha, WI) using the default clinical abdominal/pelvis protocol for a medium-sized adult. For each bleeding rate, non-contrast SECT was scanned with the following parameters: 120 kVp; 315 mA (Noise Index=13); 0.8s; pitch, 0.992:1; collimation, 80 mm; bowtie, Large; Reconstruction field-of-view, 27.3 cm; thickness, 1.25 mm; interval, 1.25 mm; ASIR-V, 40%. After iodine contrast was administered, the arterial phase DECT was acquired after a 15-second initial delay: 140/80 kVp; 315 mA (Noise Index=13); 0.8s; pitch, 0.992:1; collimation, 80 mm; bowtie, Large; Reconstruction field-of-view, 27.3 cm; thickness, 1.25 mm; interval, 1.25 mm; ASIR-V, 40%. For each bleeding rate, the scans were repeated 15 times.
After each acquisition, SECT images, 40 keV VMI, and iodine material density images were reconstructed using the standard GSI Xtreme software package available on the CT console, before being transferred to a commercial PACS workstation (Centricity version 4.0, GE Healthcare, Waukesha, WI) for subsequent image analysis. 40 keV is the lowest monoenergy level possible with the CT scanner used in this experiment, and was chosen to maximize the differences in iodine conspicuity compared to SECT reconstruction images.
Image analysis
For each 40 keV VMI acquisition, the presence of visible extravasation of contrast material in the lumen with iodine density level of greater than 0.5 mg/cm3 was considered diagnostic of active GI bleeding. 0.5 mg/cm3 was chosen as a criterion for the presence of extravasated contrast based on prior studies which cite this value as the minimum detectable iodine concentration [16,17]. Concurrently, for each SECT acquisition, the presence of visible extravasation of contrast material in the lumen was the only criteria to be considered diagnostic active GI bleeding. A fellowship-trained radiologist with 17 years of experience with abdominal CT and a diagnostic physicist with 18 years of experience with CT imaging analyzed the CT images. Final decisions regarding the CT findings were determined by consensus.
For each acquisition in which active GI bleeding was successfully detected, a circular or oval region of interest (ROI) with an area of 8-10 mm2 was drawn on the visible site of extravasated contrast material on SECT, 40 keV VMI, and iodine material density images [18, 19]. The ROIs were carefully placed to avoid inclusion of surrounding structures. For every acquisition, three separate ROIs were drawn on different areas of the simulated bleed and averaged, and the mean values were documented.
To evaluate the detectability of extravasated contrast material quantitatively, a second ROI was made in a background region filled with water. Attention was paid to avoid beam hardening effects from the extravasated contrast material. The mean and standard deviation value of the background ROI were also documented, which allowed for calculation of CNR and the following CNR ratios: CNR40 keV/CNRSECT and CNRIodine/CNRSECT. We chose to analyze CNR to quantitatively assess the presence of extravasated contrast relative to background noise [20].
Statistical analysis
Statistical analysis was performed using the Excel Data Analysis Toolpak (Microsoft, Richmond, WA). The paired t-test was employed to compare the CNR at the bleeding site between 1) the SECT series and 40 keV VMI series, 2) the SECT and the iodine density series, respectively.
Results
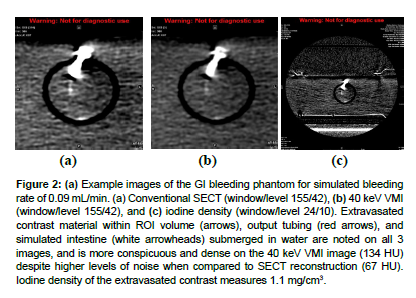
Example images of the GI bleeding phantom for simulated bleeding rate of 0.09 mL/min are displayed in (Figure 2a, b). Extravasated contrast material (arrows) is noted on all three images [21], and is more conspicuous and dense on the 40 keV VMI image (134 HU) despite higher levels of noise when compared to SECT reconstruction (67 HU). Iodine density of the extravasated contrast measures 1.1 mg/cm3 (Figure 2c).
Figure 2: (a) Example images of the GI bleeding phantom for simulated bleeding rate of 0.09 mL/min. (a) Conventional SECT (window/level 155/42), (b) 40 keV VMI (window/level 155/42), and (c) iodine density (window/level 24/10). Extravasated contrast material within ROI volume (arrows), output tubing (red arrows), and simulated intestine (white arrowheads) submerged in water are noted on all 3 images, and is more conspicuous and dense on the 40 keV VMI image (134 HU) despite higher levels of noise when compared to SECT reconstruction (67 HU). Iodine density of the extravasated contrast measures 1.1 mg/cm3.
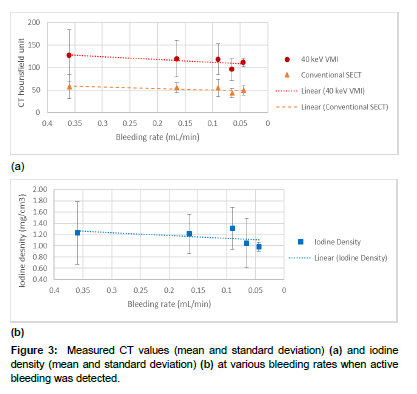
Figure 3 shows the measured CT values and iodine density at various bleeding rates when extravasated contrast material was successfully detected. The measured CT values of 40 keV VMI were more than twice as high as those of the SECT series (mean [min-max]: 114.4 HU [55- 246 HU] vs. 52.1 HU [22-117 HU]; p value < 0.05). The average iodine density across all bleeding rates was 1.20 mg/cm3 [0.57-2.46 mg/cm3].
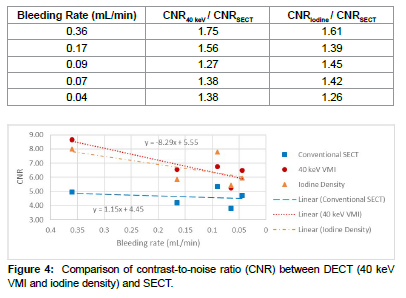
It was evident in Figure 3(a, b) that the image noise (i.e., standard deviation of CT Hounsfield unit values) of the 40 keV VMI series was much higher than that of the SECT. To take image noise into consideration, we calculated the CNR and the results are shown in Figure 4. The CNRs of 40 keV VMI were 8.66±3.71, 6.56±2.35, 6.77±2.10, 5.27±1.46, and 6.50±0.21 at 0.36, 0.16, 0.09, 0.07, and 0.04 mL/min, respectively. In comparison, the CNRs of SECT were 4.95±2.20, 4.21±0.85, 5.35±1.87, 3.83±0.95, and 4.72±0.93 at 0.36, 0.16, 0.09, 0.07, and 0.04 mL/min, respectively. Compared to SECT, 40 keV VMI improves the CNR by 26-75% (Table 1), and the difference in CNR was statistically significant between 40 keV VMI and SECT (p value < 0.05), and between iodine density and SECT (p value < 0.05), respectively [22].
| Bleeding Rate (mL/min) | CNR40 keV / CNRSECT | CNRIodine / CNRSECT |
|---|---|---|
| 0.36 | 1.75 | 1.61 |
| 0.17 | 1.56 | 1.39 |
| 0.09 | 1.27 | 1.45 |
| 0.07 | 1.38 | 1.42 |
| 0.04 | 1.38 | 1.26 |
However, Figure 3(a) also showed that the CNR of 40 keV VMI decreased in a seemingly linear fashion,

Therefore, with a decrease in bleeding rate from 0.36 to 0.04 mL/ min, the CNR of 40 keV VMI was reduced by 24.9% (i.e., 8.66 to 6.55). This decrease was significant compare to a merely 4.6% (i.e., 4.95 to 4.72) decrease in the CNR of SECT over the same bleeding rate range [23].
Discussion
Our measurements showed a superior CNR value of 6.55 at arterial phase 40 keV VMI vs 4.72 of arterial phase SECT at the lowest bleeding rate of 0.04 mL/min. This is in line with the arterial phase results reported by Liu et al., who reported a CNR value of 7.69 at arterial phase 40 keV vs 3.58 arterial phase SECT at 0.025 mL/min [9]. Liu et al. also reported a superior CNR value of 19.35 at venous phase 40 keV vs 11.68 venous phase SECT at 0.025 mL/min [9]. Due to the design limit of our phantom model, we were not able to verify these venous phase results [24].
To our knowledge, this is the first report of significant loss of CNR at slow bleeding rates when compared with SECT. With the decrease of bleeding rate from 0.36 to 0.04 mL/min, the CNRs of 40 keV VMI decreased by 24.9%, compared to a slight decline of 4.6% of SECT. We also found this loss of CNR at slow bleeding rate may be characterized by a linear relationship (Eq. 1). These findings not only warrants attention but also help design further study to assess DECT’s efficacy at slow GI bleeding patients [25].
The use of iodine density quantification was not evaluated in the previously published DECT GI bleeding phantom study [9]. In our study, the mean iodine density of sites of extravasated contrast across all bleeding rates was 1.20 mg/cm3 [0.57-2.46 mg/cm3]. Our results correlate well with a study of brain hemorrhage by Bonatti et al. [26], which demonstrated that a cutoff of 1.35 mg/cm3 would result in 100% sensitivity and 67.6% specificity in detecting active bleeding. The ideal iodine density cutoff for determining active GI bleeding is not known but we believe that iodine density quantification can potentially be used in clinical cases to confirm or refute the presence of active extravasation in areas of suspected bleeding.
Besides the aforementioned limitation that our phantom model did not permit the simulation of venous phase bleeding, our study has other limitations. First, our study utilized a simulated model, and blood pressure was not accounted for in the phantom. It is therefore unknown if the results of our phantom study would be comparable in vivo. Secondly, our study was performed on a DECT scanner from a single vendor only. It is unclear if our results would transfer to other DECT platforms. Finally, we only studied bleeding in a fluid-filled intestine simulation, and we did not examine results in a partially fluid or airfilled bowel simulation.
In conclusion, we demonstrated in a phantom simulation using 2ndgeneration DECT that, although DECT improves the CNR for detection of gastrointestinal bleeding, its image quality declines faster than SECT as a result of slow bleeding rate. Iodine density quantification can be used to objectively measure contrast extravasation.
References
- García-Blázquez V, Vicente-Bártulos A,Olavarría-Delgado A (2013) Accuracy of CT angiography in the diagnosis of acute gastrointestinalbleeding: systematic review and meta-analysis. EurRadiol 23: 1181-1190.
- Wells ML, Hansel SL, Bruining DH (2018) CT for Evaluation of Acute GastrointestinalBleeding. Radiographics 38:1089-1107.
- Kim BS, Li BT, Engel A (2014) Diagnosis of gastrointestinal bleeding: Apractical guide for clinicians. WorldJ Gastrointest Pathophysiol 5: 467-478.
- Roy-Choudhury SH, Gallacher DJ, Pilmer J(2007) Relative threshold of detection of activearterial bleeding: in vitro comparison of MDCT and digital subtractionangiography. AJR Am J Roentgenol189: 238-246.
- Kuhle WG, Sheiman RG (2003) Detection of active colonic hemorrhage withuse of helical CT: findings in a swine model. Radiology228: 743-752.
- Sun H, Hou XY, Xue HD (2015) Dual-source dual-energy CT angiography withvirtual unenhanced images and iodine map for active gastrointestinalbleeding: image quality, radiation dose and diagnostic performance. Eur J Radiol 84: 884-891.
- Sun H, Xue HD, Wang YN (2013) Dual-source dual-energy computed tomographyangiography for active gastrointestinal bleeding: a preliminary study. ClinRadiol 68: 139-147.
- Mohammadinejad P, Kwapisz L, Fidler JL (2021) The utility of a dual-phase, dual-energy CTprotocol in patients presenting with overt gastrointestinal bleeding. Acta Radiol Open 10: 20584601211030658.
- Liu WD, Wu XW, Hu JM, Wang B, Liu B (2015) Monochromatic energy computed tomography imagefor active intestinal hemorrhage: a model investigation. WorldJ Gastroenterol 21: 214-220.
- Huprich JE, Barlow JM, Hansel SL, AlexanderJA, Fidler JL (2013) Multiphase CT enterography evaluation ofsmall-bowel vascular lesions. AJRAm J Roentgenol 201: 65-72.
- Connes P, Alexy T, Detterich J, Romana M,Hardy-Dessources MD, et al. (2016) The role of blood rheology in sickle celldisease. Blood Rev 30:111-118.
- Chirife J, Buera MP (1997) A simple model for predicting the viscosity ofsugar and oligosaccharide solutions. Journal of Food Engineering 33: 221-226.
- Tse JR, Shen J, Shah R, Fleischmann D, KamayaA (2021) Extravasation volume at computed tomographyangiography correlates with bleeding rate and prognosis in patients withovert gastrointestinal bleeding. InvestRadiol 56: 394-400.
- Bae KT (2010) Intravenous contrast medium administration andscan timing at CT: considerations and approaches. Radiology256: 32-61.
- Zou Y, Silver MD (2009) Linearity between CT number and iodineconcentration and application to improving accuracy of CT number in slowkV-switching dual energy CT.Physics of Medical Imaging, 72583Z.
- Li B, Pomerleau M, Gupta A, Soto JA, AndersonSW (2020) Accuracy of Dual-Energy CT Virtual Unenhancedand Material-Specific Images: A Phantom Study. AJRAm J Roentgenol 215: 1146-1154.
- JacobsenMC, Schellingerhout D, Wood CA (2018) Intermanufacturercomparison of dual-energy CT iodine concentration and monochromaticattenuation: a phantom study. Radiology 287: 224–234.
- Joshi R, LeBedis C, Dao K, Qureshi M, Gupta A(2022) Dual energy CT angiography for lower extremitytrauma: comparison with conventional CT. EmergRadiol 29: 471-477.
- Albrecht MH, Trommer J, Wichmann JL (2016) Comprehensive Comparison of VirtualMonoenergetic and Linearly Blended Reconstruction Techniques inThird-Generation Dual-Source Dual-Energy Computed Tomography Angiographyof the Thorax and Abdomen. Invest Radiol 51: 582-590.
- Dane B, Patel H, O'Donnell T (2018) Image Quality on Dual-energy CTPA VirtualMonoenergetic Images: Quantitative and Qualitative Assessment. AcadRadiol 25: 1075-1086.
- Van Hamersvelt RW, Eijsvoogel NG, Mihl C(2018) Contrast agent concentration optimization inCTA using low tube voltage and dual-energy CT in multiple vendors: aphantom study. Int J Cardiovasc Imaging34: 1265-1275.
- Li B, Yadava G, Hsieh J (2011) Quantification of head and body CTDI (VOL) ofdual-energy x-ray CT with fast-kVp switching. MedPhys 38: 2595-2601.
- Yu L, Christner JA, Leng S, Wang J, FletcherJG, et al. (2011) Virtual monochromatic imaging in dual-sourcedual-energy CT: radiation dose and image quality. MedPhys 38: 6371-6379.
- Pinho DF, Kulkarni NM, Krishnaraj A, Kalva SP,Sahani DV (2013) Initial experience with single-sourcedual-energy CT abdominal angiography and comparison with single-energy CTangiography: image quality, enhancement, diagnosis and radiation dose. EurRadiol 23: 351-359.
- Matsumoto K, Jinzaki M, Tanami Y, Ueno A, YamadaM, et al. (2011) Virtual monochromatic spectral imaging withfast kilovoltage switching: improved image quality as compared with thatobtained with conventional 120-kVp CT. Radiology259: 257-262.
- Bonatti M, Lombardo F, ZamboniGA (2018) Iodine Extravasation Quantification onDual-Energy CT of the Brain Performed after Mechanical Thrombectomy forAcute Ischemic Stroke Can Predict Hemorrhagic Complications. AJNR Am J Neuroradiol 39: 441-447.
Indexed at, Google Scholar, Crossref
Indexed at, Google Scholar, Crossref
Indexed at, Google Scholar, Crossref
Indexed at, Google Scholar, Crossref
Indexed at, Google Scholar Crossref
Indexed at, Google Scholar, Crossref
Indexed at, Google Scholar, Crossref
Indexed at, Google Scholar, Crossref
Indexed at, Google Scholar, Crossref
Indexed at, Google Scholar, Crossref
Indexed at, Google Scholar, Crossref
Indexed at, Google Scholar, Crossref
Indexed at, Google Scholar, Crossref
Indexed at, Google Scholar, Crossref
Indexed at, Google Scholar, Crossref
Indexed at, Google Scholar, Crossref
Indexed at, Google Scholar, Crossref
Indexed at, Google Scholar, Crossref
Indexed at, Google Scholar, Crossref
Indexed at, Google Scholar, Crossref
Indexed at, Google Scholar, Crossref
Indexed at, Google Scholar, Crossref
Indexed at, Google Scholar, Crossref
Citation: Li B, Li D, Gupta A (2023) Conspicuity of Active Gastrointestinal Bleeding: Bleeding Rate Has Greater Impact on Dual-Energy Computed Tomography than Conventional Computed Tomography. OMICS J Radiol 12: 484. DOI: 10.4172/2167-7964.1000484
Copyright: © 2023 Li B, et al. This is an open-access article distributed under the terms of the Creative Commons Attribution License, which permits unrestricted use, distribution, and reproduction in any medium, provided the original author and source are credited.
Share This Article
Open Access Journals
Article Tools
Article Usage
- Total views: 1437
- [From(publication date): 0-2023 - Apr 25, 2025]
- Breakdown by view type
- HTML page views: 1204
- PDF downloads: 233
