Concentrations of Petroleum Hydrocarbons Residual in Seawater of Aden Coasts, Yemen
Received: 25-Jul-2018 / Accepted Date: 23-Aug-2018 / Published Date: 26-Aug-2018 DOI: 10.4172/2155-9910.1000259
Keywords: Aden; Coastal seawater; Gulf of Aden; Petroleum pollution; Yemen
Introduction
The coastal ecosystem is one of the most important global ecosystems. It provides numerous ecosystem services, such as the food supply, biodiversity, and recreation. Hence, maintaining the habitat quality and ecosystem health of the coastal system is highly significant [1]. Coastal environments are very important areas for recreational and industrial activities for the people living their [2]. They are considered as places of high ecological risk due to the complex biogeochemical processes and the intensive human activities such as terrestrial urban, agricultural runoff, industrial effluents and aquatic chemical spills with rapid economic development [1,3]. These activities discharge different kinds of pollutants to these ecosystems such as AHs and PAHs.
Petroleum is a complex mixture of hydrocarbons and nonhydrocarbons (metal porphyrins, acid and organometallic compounds) [4]. It is one of the most common pollutants released into marine environments [5]. PHs are coming from biogenic, petrogenic, and/or pyrogenic sources [6]. They enter to marine environment from many sources including industrial discharges, ships' operations, accidental spills, atmospheric fallout, oil and gas exploration and domestic and industrial effluents, etc. [7-9].
AHs and PAHs are the major components of crude oil, which is one of the main pollutants in coastal environments. The AHs consists of about 80% of crude petroleum and, hence, they are widely used as geochemical markers of oil contamination [8,10]. A high concentration of AHs is a potential source of pollution and may cause adverse effects on ecosystem [11]. Despite of their anthropogenic sources, AHs have also different natural sources, such as, marine phytoplankton and bacteria and biomass combustion [12]. PAHs are a wide group of compounds with two or more aromatic rings containing solely hydrogen and carbon [13]. They are group of ubiquitous pollutants in the marine environment [14] and produced by pyrogenic, natural processes and/or anthropogenic activities [15]. PAHs are also derived from crude oil and its derivatives [15]. They are highly insoluble and persist in the environment [16].
The scientific community was aware of the high concentrations of PAHs in seawater, sediments and biota and consequently, of their deleterious effects on the marine environment [17]. Some compounds of PAHs are considered to be the most toxic components in crude oil, with carcinogenic, teratogenic, and mutagenic effects in aquatic animals and humans [18].
The pollution of the marine environment by organic and inorganic pollutants in the Gulf of Aden and Arabian Sea is a major concern of all countries in the region. The coastal water of Yemen are characterized by its high productivity making it a basic feeding and nursery ground for marine species [19]. More than 600 species of marine organisms have been recorded in Yemen seawater [20].
Petroleum pollution threatens the coastal area through; oil transport, oil spillage, ballast water and untreated sewage. Untreated domestic wastewater, industrial wastewater and agricultural drain water, run-off during rainy periods, ship and boat traffic, oil transportation, oil spillage, and atmospheric fallout are all potential sources of pollution [21]. In the water environment, pollutants quickly spread over large distances from the sources of pollution.
Gulf of Aden is among the busiest tanker route. Most of the oil produced in the region is exported via sea and pipelines, while local consumption refineries are located in the coastal area. The widespread oil pollution in Gulf of Aden are not surprising [22,23]. The increases of sewage and industrial effluent discharged into Gulf of Aden have seriously endangered the ecosystem [24]. On the other hand, Gulf of Aden is characterized by a high water temperature (>25ºC) and surface water salinity varies between 33.7% to 37% which provide favorable conditions for oil degradation [25].
Aden coast, which comprises the biggest and most important harbors in Yemen. It is vital for marine activities, fisheries and tourist attraction. Aden coast is receives considerable amounts of petroleum along with its products. The usually common pollutants in the coastal line of Aden originate from discharges from desalination power generation, sewage, and wastewater treatment plants in addition to hydrocarbons and trace metal compounds [24].
The aims of this study are to evaluate the concentrations of AHs and PAHs, and to identify the sources of these pollutants in surface seawater collected along Aden coasts, Yemen. The results obtained will provide insight on the pollution levels of PHs in Aden coasts, which could contribute to the prevention and control of pollution of PHs.
Material and Methods
Study area
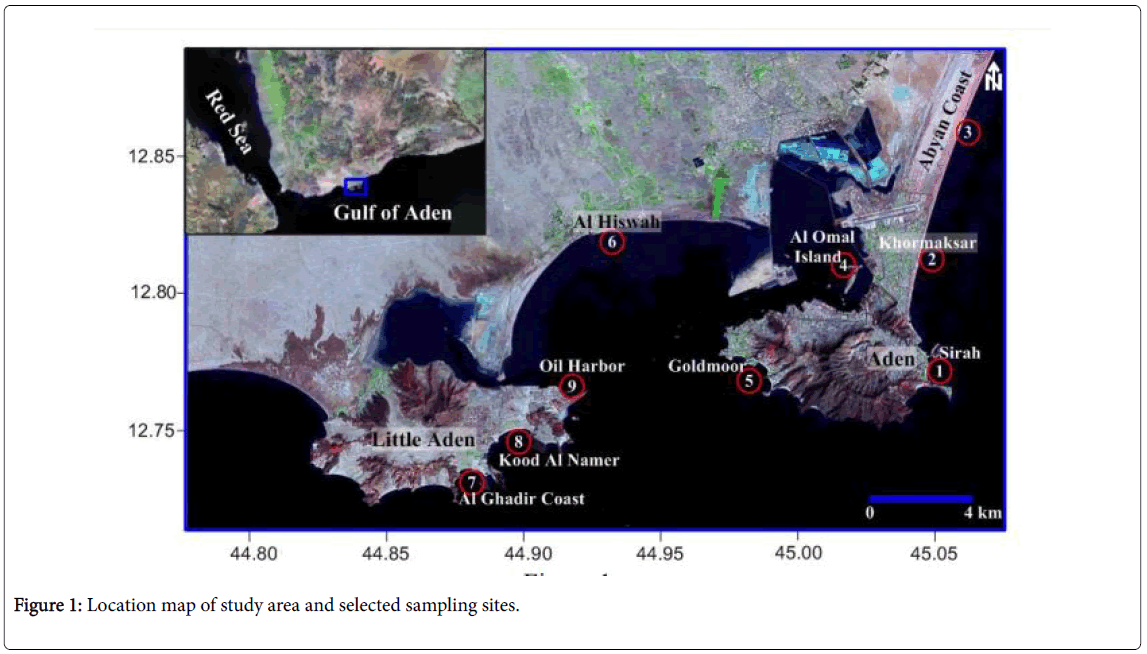
Aden city is located on the coast of the Gulf of Aden in the south Yemen. It is bounded by latitudes 12.7°-12.9° N and longitudes 44.78°-45.08° E (Figure 1). It is the economic capital of Yemen and the second most important after the Yemeni city of Sana'a. Aden is the largest coastal city and famous for transit trade, boat building, ship repairs and bunkering. Before the closure of the Suze Canal in 1967, Aden was the third largest bunkering port in the world. Besides port related activities, major economic resources in the coastal zone are fisheries, maritime traffic, oil and gas exploitation. Crude oil is supplied by pipeline from the shore and then transferred from the vessel to tankers. A large boat is available for transport of ship based garbage and oily waste, which is carried by lorries to a municipal landfill where it is burned. The port and entrance channel are dredged regularly and dredge spoil is dumped offshore [26].
Sampling technique
Twenty seven surface seawater samples (2.5 l) were collected 1 m depth with a glass bottle held in a metal frame to cover the coastal area of Aden which is considered as an area of intense industrial and urban activities. These samples were taken during July, December 2014 and March 2015 from selected nine stations (Figure 1). A reference station of surface water sample was collected from station 5 at Goldmoor area which is far from any expected oil pollution and considered as a natural protected area (Figure 1). Global Positioning System (GPS) was used to determine the coordinates of the sampling points. The samples were analyzed according to UNEP techniques [27]. The procedure used for extraction and analysis of AHs and PAHs in surface water samples was performed according to conventional procedures [28]. The concentrations of the AH and PAH were calculated three times (July, December 2014 and March 2015) and the mean values were taken. In this work, gas chromatography (GC-MS) a Shimadzu GC-2010 C.N. 1134102760 Sa, with split/splitless injector furnished with a 60 m × 250 mm × 25μ fused silica capillary with a chemically bonded gum phase DB-wax, was used. Blank determinations were carried out by repeating the procedure with pre-extracted sample. Using a calibration with Marib export blend crude oil and the detector response was 45.8 mV at 360 nm emission wavelength. Samples were extracted and analyzed at the Yemen Standardization, Metrology and Quality Control Organization, Sana'a, Yemen.
Results and Discussion
The temperature, salinity and pH of the seawater were in the range of 27°C-29.5°C, 37%-38% and 7.8-8.03, respectively (Table 1).
| Station No. | pH | Temp (°C) | Salinity (%) | Pr (µg/l) | Ph (µg/l) | Pr/Ph | n-C17/Pr | n-C18/Ph | Sq (µg/l) | UCM (µg/l) | CPI (µg/l) | ΣAHs (µg/l) |
|---|---|---|---|---|---|---|---|---|---|---|---|---|
| 1 | 8.01 | 28.1 | 37.2 | 0.01 | 0.013 | 0.77 | 1.15 | 0.89 | 0.03 | 0.5 | 1 | 0.41 |
| 2 | 8.01 | 29.1 | 37.3 | 0.027 | 0.025 | 1.08 | 0.56 | 0.79 | 0.04 | 1.5 | 1.1 | 0.19 |
| 3 | 8 | 28.7 | 37.1 | 0.03 | 0.04 | 0.75 | 0.78 | 0.28 | 0.03 | 1.3 | 1 | 0.9 |
| 4 | 8.02 | 29.5 | 37.5 | 0.003 | 0.008 | 0.38 | 2.75 | 1.18 | 0.04 | 0.7 | 1.2 | 0.34 |
| 5 | 8.03 | 27.1 | 37.5 | 0.01 | 0.016 | 0.63 | 0.6 | 1.06 | ND | 0.2 | 0.3 | 0.21 |
| 6 | 7.8 | 28.3 | 37.6 | 0.035 | 0.025 | 1.4 | 0.23 | 2.31 | 0.06 | 1.4 | 1.3 | 0.58 |
| 7 | 8.02 | 27.1 | 38.1 | 0.03 | 0.023 | 1.3 | 1.34 | 0.35 | 0.05 | 1.6 | 1.5 | 0.69 |
| 8 | 7.93 | 29.3 | 37.1 | 0.04 | 0.025 | 1.6 | 0.18 | 0.28 | 0.09 | 1.8 | 1.4 | 0.54 |
| 9 | 7.92 | 28.5 | 37.4 | 0.043 | 0.03 | 1.43 | 0.02 | 0.06 | 1 | 2 | 1.6 | 0.12 |
| Min. | 7.8 | 27.1 | 37.1 | 0.003 | 0.008 | 0.38 | 0.02 | 0.06 | ND | 0.2 | 0.3 | 0.12 |
| Max. | 8.03 | 29.5 | 38.1 | 0.043 | 0.04 | 1.6 | 2.75 | 2.31 | 1 | 2 | 1.6 | 0.9 |
| Average | 7.97 | 28.41 | 37.42 | 0.025 | 0.023 | 1.04 | 0.85 | 0.8 | 0.17 | 1.22 | 1.16 | 0.44 |
| STDEV | 0.08 | 0.87 | 0.31 | 0.014 | 0.01 | 0.42 | 0.84 | 0.69 | 0.34 | 0.62 | 0.38 | 0.26 |
Table 1: pH, temperature, salinity, Pr, Ph, Sq, UCM, CPI and ΣAHs concentration in surface seawater samples from Aden coasts.
The results of Pristane (Pr), phytane (Ph), squalane (Sq) and ΣAHs concentration in surface seawater samples from Aden coasts are presented in Table 1.
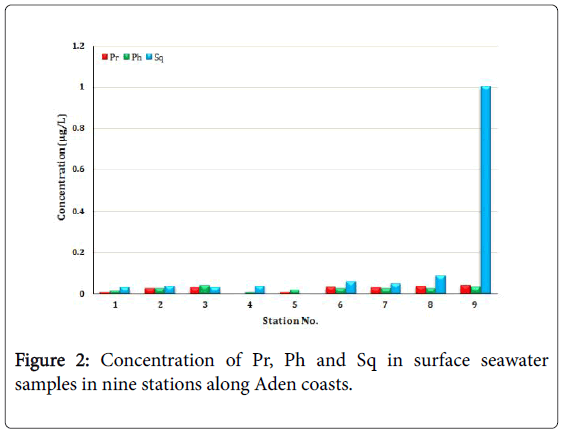
Concentration of Pr ranges from 0.003 μg/l (station 4) to 0.043 μg/l (station 9), with an average of 0.025 ± 0.014 μg/l (Figure 2, Table 1). The presence of Pr in significant concentrations supports the biogenic origin of hydrocarbon in surface seawater samples [29]. Concentration of Ph ranges from 0.008 μg/l (station 4) to 0.040 μg/l (station 3), with an average of 0.023 ± 0.010 μg/l (Table 1, Figure 2).
The isoprenoids Pr and Ph are common components of crude oil. Ph originates from petroleum hydrocarbons, but Pr can be generated by biogenic processes in the absence of pollution due to petroleum hydrocarbons [10,30]. The ratio between Pr/Ph is used to determine the relative contribution of oil to seawater pollution, where values close to or <1 indicate oil pollution, and values between 3 and 5 are characteristic of non-polluted seawater [30]. In this study, Pr/Ph ratio varied between 0.38 (station 4) and 1.60 (station 8), which is indicating petroleum pollution (Table 1).
The degree of oil degradation in the environment was evaluated by the ratios between n-C17/pr and n-C18/ph, since the n-alkanes chains degrade more quickly than the branched ones [31]. Values <2 indicate the presence of degraded oil while values ≥ 2 suggest recent oil pollution [32,33]. The values for the n-C17/Pr were <2 in all stations except station 4 (2.75) (Table 1). The n-C18/Ph ratio presented similar results except for samples of station 6 (2.31) (Table 1). These results show that there is a mixture of degraded and recently introduced oil at these stations.
Samples from station 4 were collected in front of area for cutting scrap ships, where they are carrying out cutting different types of scrap vessels and this cutting leads to the disposal of quantities of bunker, remains of greases, oil products. Sometimes there is a leakage of ships fuel from the marine pipeline which passes along of Al-Omal Island, because the pipeline has become old. Stations 6 continuously receive cooling water directly without any kind of treatment from the Al- Hiswah steam station of electricity.
Concentration of Sq ranges from ND μg/l (station 5) to 1.00 μg/l (station 9), with an average of 0.17 ± 0.34 μg/l (Figure 2, Table 1). Sq is a major organic constituent in polluted surface seawater, was intimately correlated with anthropogenic sources of hydrocarbons [34]. This compound was encountered in all seawater samples of Aden coasts. This may help to indicate the nature of pollution of Aden coasts. Burns et al. [29] reported elevated values of Sq in some seawater samples, which is constantly subjected to chronic oil pollution. Concentrations of unresolved complex mixture (UCM) ranges from 0.2 μg/l (station 5) to 2 μg/l (station 9), with an average of 1.22 ± 0.62 μg/l (Table 1). The UCM represent components resistant to weathering and bacterial breakdown and its presence in chromatograms has frequently been taken as strong evidence for petroleum pollution in seawater samples [28,35]. The anthropogenic contribution of petroleum hydrocarbons (PHs) is evident from the presence of the UCM in all of the samples analysed (Table 1).
The ratio of odd to even carbon numbered n-alkanes is called carbon preference index (CPI). The CPI for the seawater samples ranged from 0.30 μg/l (station 5) to 1.60 μg/l (station 9), with an average of 1.16 ± 0.38 μg/l (Table 1). It is the most common index for determination of the sources of AHs. CPI values <3 indicates petrogenic hydrocarbons inputs to the seawater, while natural inputs have values >3 [36,37]. The results of CPI of Aden coastal seawater reflect that all samples are polluted with petrogenic hydrocarbons (CPI <1.6).
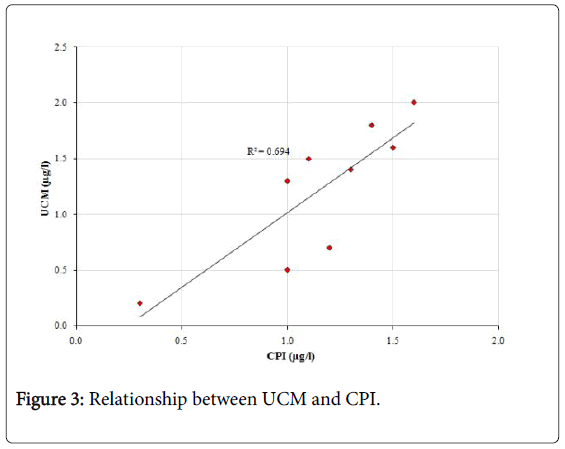
The linear regressions between UCM and CPI parameters show good significant correlation (R2=0.69) (Figure 3).
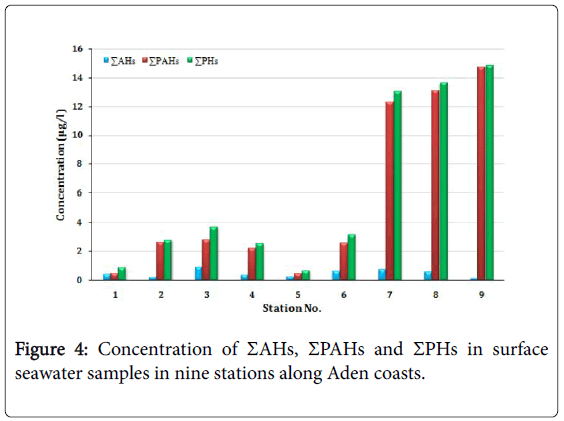
The results of ΣAHs in surface seawater samples of Aden coasts are given in Table 1 and shown in Figure 4. The concentration of ΣAHs ranges between 0.12 μg/l (station 9) to 0.9 μg/l (station 3), with an average of 0.44 ± 0.26 μg/l. Station 5 is considered as background level for this study. Little or no pollution is considered to exist when ΣAHs concentration is 100 μg/l [38]. Hence, all stations exhibited values <0.9 μg/l, clearly indicating surface seawater in Aden coasts are considered low polluted.
The concentrations of ΣPAHs in Aden coasts seawater ranges between 0.45 μg/l (station 5) and 14.7 μg/l (station 9) with an average of 5.69 μg/l (Figure 4, Table 2). Unpolluted seawater contains less than 0.1 ΣPAH [39]. Hence, Aden's coastal seawater is low polluted with PAHs (values ≤ 14.70 μg/l). In this study, higher concentrations of ΣPAH were recorded at stations 7,8 and 9. The possible sources of PAH in these stations were due to oil leakage, refinery, port area and shipping operations.
| Compounds | Station No | Min. | Max. | Average | ||||||||
|---|---|---|---|---|---|---|---|---|---|---|---|---|
| 1 | 2 | 3 | 4 | 5 | 6 | 7 | 8 | 9 | ||||
| Naphthalene | 0.01 | 0.02 | 0.02 | 0.03 | 0.01 | 0.05 | 1.3 | 1.5 | 1.7 | 0.01 | 1.7 | 0.52 |
| Biphenyl | 0.008 | 0.01 | 0.01 | 0.04 | ND | 0.01 | 1.1 | 1 | 1.1 | ND | 1.1 | 0.37 |
| Phenanthrene (Phe) | 0.05 | 0.08 | 0.07 | 0.07 | 0.05 | ND | 1.1 | 1 | 1.2 | ND | 1.2 | 0.45 |
| Anthracene (Ant) | 0.02 | 0.03 | 0.04 | 0.02 | 0.01 | 0.07 | 1.2 | 1.3 | 1.5 | 0.01 | 1.5 | 0.47 |
| Fluoranthene (Flu) | 0.01 | 0.05 | 0.03 | 0.03 | 0.02 | 0.04 | 1 | 1 | 1.2 | 0.01 | 1.2 | 0.38 |
| Pyrene (Pyr) | 0.03 | 0.07 | 0.06 | 0.05 | 0.02 | 0.07 | 1.1 | 1.3 | 1.5 | 0.02 | 1.5 | 0.47 |
| Chrysene | 0.2 | 0.05 | 0.05 | 0.06 | 0.03 | 0.05 | 1.5 | 1.7 | 1.9 | 0.03 | 1.9 | 0.62 |
| Benzopyrene | 0.08 | 1.3 | 1.2 | 1 | 0.3 | 1.1 | 2.3 | 2.4 | 2.5 | 0.08 | 2.5 | 1.35 |
| Perylene | 0.05 | 1 | 1.3 | 0.9 | ND | 1.2 | 1.7 | 1.9 | 2.1 | ND | 2.1 | 1.27 |
| ΣPAHs | 0.46 | 2.61 | 2.78 | 2.2 | 0.45 | 2.59 | 12.3 | 13.1 | 14.7 | 0.45 | 14.7 | 5.69 |
| Flu/(Flu+Pyr) | 0.25 | 0.42 | 0.33 | 0.38 | 0.5 | 0.36 | 0.48 | 0.43 | 0.44 | 0.25 | 0.5 | 0.43 |
| Flu/Pyr | 0.33 | 0.71 | 0.5 | 0.6 | 1 | 0.57 | 0.91 | 0.77 | 0.8 | 0.33 | 1 | 0.69 |
Table 2: Concentration of PAHs in seawater samples from Aden coasts (in μg/l).
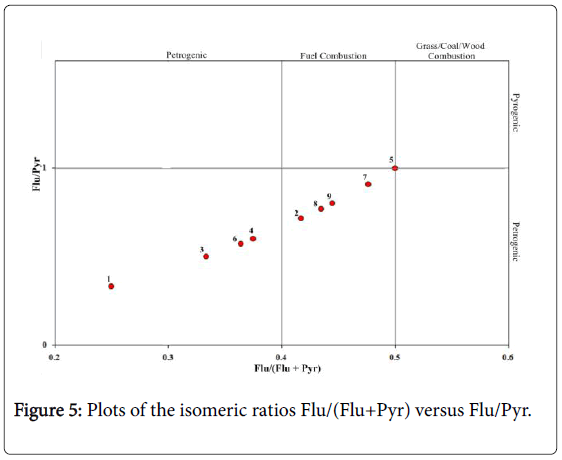
The main sources of PAHs in aquatic system originate mainly from pyrolytic or petrogenic sources [40,41]. Pyrolytic PAHs which derived from combustion contains four or more aromatic rings, while petrogenic PAHs derived from petroleum contains less than four aromatic rings [42].
The Flu/Pyr and Flu/(Flu+Pyr) ratios are useful indicators for evaluating the attribution of PAH pollution in seawater. PAH isomers of masses Flu and Pyr are widely used to differentiate between pyrolytic and petrogenic sources. If the ratio Flu/Pyr <1, PAHs will be from petrogenic source but when the ratio >1, its source is from pyrolytic source [43]. Moreover, if Flu/(Pyr+Flu) <0.5, it is generally associated with petrogenic source as a characteristic of fuel combustion, while when this ratio exceeds 0.5 it characterized pyrolytic sources (grass, coal and wood combustion) [42]. This implies that the source of PAHs in surface seawater could be mainly polluted by petrogenic inputs. All stations exhibited values of the Flu/Pyr ratio ≤ 1 and Flu/(Flu+Pyr) ratio ≤ 0.5 (Table 2), clearly indicating a petrogenic origin and reflecting a petroleum combustion origin (Figure 5).
The distribution of PAHs in the seawater samples from Aden coasts are summarized in Table 2. The PAHs consists of two groups: low molecular weight PAHs (naphthalene, biphenyl, phenanthrene and anthracene) and large molecular weight (fluoranthene, pyrene, chrysene, benzopyrene and perylene).
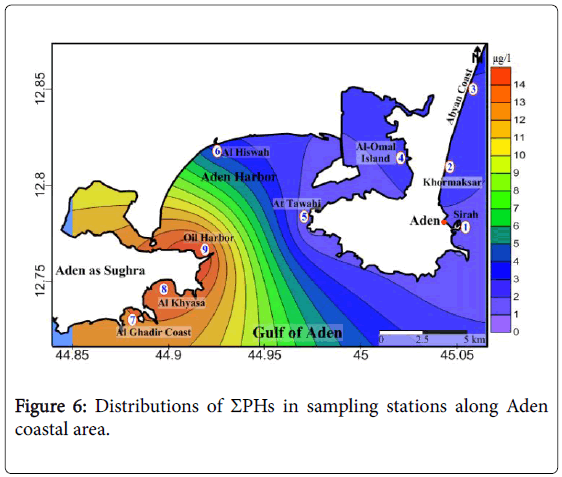
Some countries (e.g. China and Russian Federation) use maximum allowed concentration of 50 μg/l as seawater quality standard [49]. Hence, the measured concentrations of ΣPH in our study were within the allowed limit (<16 μg/l, Figure 6 and Table 3). Generally, the ΣPHs concentration in seawater which can induce harmful effect on the aquatic organisms is in the range of 50 μg/l. Gordon and Prouse [50] reported that oil concentrations in excess of this value can retard phytoplankton photosynthesis.
| Station No. | ΣPHs concentration (µg/l) |
|---|---|
| 1 | 0.92 |
| 2 | 2.89 |
| 3 | 3.78 |
| 4 | 2.59 |
| 5 | 0.69 |
| 6 | 3.29 |
| 7 | 13.09 |
| 8 | 13.79 |
| 9 | 15.89 |
| Min. | 0.69 |
| Max. | 15.89 |
| Average | 6.33 |
Table 3: ΣPHs concentration in surface seawater samples from Aden coasts.
The concentration of total petroleum hydrocarbons (ΣPHs) as the sum of ΣAHs and ΣPAHs in the seawater samples are given in Table 3 and shown in Figure 6. It’s ranged from 0.69 μg/l (station 5) to 15.89 μg/l (station 9), with an average of 6.33 μg/l. Oppenheiner [44] has suggested that if the concentration of PHs in the seawater has exceeded the value of 100 μg/l should be considered to be polluted. The ΣPH concentrations <1 μg/l are considered typical of seawater without significant petroleum pollution [45-48]. Hence, Aden's coastal seawater is low polluted with PHs and stations 1 and 5 are unpolluted. In this study, the highest concentration of ΣPHs was detected at the station 9 followed by station 8 and station 7 (Figure 6).
The possible source of ΣPH in these stations was due to oil leakage during the loading and unloading of oil ships in the refinery area (especially in station 9, oil harbor), weakness of surface sea currents, close these stations to the international maritime corridor, discharge of ballasting water and throwing oil waste into marine environment illegally.
Conclusion and Recommendations
Surficial seawater samples from Aden coasts, Yemen were analyzed for AHs and PAHs to determine the distribution, concentration, composition and source of organic matter in Aden’s coastal areas. ΣAHs concentrations ranged from 0.12 μg/l in station 9 to 0.90 μg/l in station 3, with an average value of 0.44 μg/l. ΣPAHs concentrations ranged between 0.45 μg/l in station 5 and 14.70 μg/l in station 9, with an average value of 5.69 μg/l. ΣPHs concentrations ranged from 0.69 μg/l in station 5 to 15.89 μg/l in station 9, with an average value of 6.33 μg/l. The observed Sq, UCM, CPI, Flu/Py ratio and Flu/(Flu+Pyr) ratio indicating pollution by petroleum hydrocarbons.
The study showed that the concentration of PHs in seawater of Aden coasts within allowed limits. The pattern of the distribution of PAHs in the seawater appears to be governed mainly by its proximity to potential oil pollution sources. This study provides useful data for assessing the effect of marine petroleum pollution control measure from the view of human health.
It is recommended that, continuous monitoring programme for the Aden city coasts; Yemen and Red Sea and Gulf of Aden region should be formulated and conducted to ensure that the concentration of PHs is within the base line level established in the present study.
References
- Lv YL, Yuan JJ, Li QF, Zhang YQ, Lv XT, et al. (2016) Impact of land-based human activities on coastal and offshore marine systems. Acta Ecol Sin 36: 1183-1191.
- Maioli OLG, Rodrigues KC, Knoppers BA, Azevedo DA (2010a) Distribution and sources of polycyclic aromatic hydrocarbon in surface sediments from two Brazilian Estuarine Systems. J Brazilian Chem Soc 21: 1543-1551.
- Li F, Lin JQ, Liang YY, Gan HY, Zeng XY, et al. (2014) Coastal surface sediment quality assessment in Leizhou Peninsula (South China Sea) based on SEM-AVS analysis. Mar Pollut Bull 84: 424-436.
- Van Hamme JD, Singh A, Ward OP (2003) Recent advances in petroleum microbiology. Microbiol. Mol Biol Rev 67: 503-549.
- Jafarabadi AR, Bakhtiari AR, Hedouin L, Toosi AS, Cappello T (2018) Spatio-temporal variability, distribution and sources of n-alkanes and polycyclic aromatic hydrocarbons in reef surface sediments of Kharg and Lark coral reefs, Persian Gulf, Iran. Ecotoxicol Environ Saf 163: 307-322.
- Gao X, Chen S (2008) Petroleum pollution in surface sediments of Daya Bay, South China, revealed by chemical fingerprinting of aliphatic and alicyclic hydrocarbons. Estuarine, Coastal and Shelf Sci 80: 95-102.
- NRC (2003) Oil in the Sea: Inputs, Fates, and Effects. National Academy Press, Washington DC. p. 265.
- BÃcego MC, Zanardi-Lamardo E, Taniguchi S, Martins CC, da Silva DAM, et al. (2009) Results from a 15-year study on hydrocarbon concentrations in water and sediment from Admiralty Bay, King George Island. Antarctica. Antarct Sci 21: 209-220.
- de O Lemos RT, de Carvalho PSM, Zanardi-Lamardo E (2014) Petroleum hydrocarbons in water from a Brazilian tropical estuary facing industrial and port development. Mar Pollut Bull 82: 183-188.
- Volkman JK, Holdsworth DG, Neill GP, Bavor HJ (1992) Identification of natural, anthropogenic and petroleum hydrocarbons in aquatic sediments. The Sci Tot Env 112: 203-219.
- Macias-Zamora JV (1996) Distribution of hydrocarbon in recent marine sediments off the coast of Baja California. Environ Pollut 92: 45-53.
- Maioli OLG, Rodrigues KC, Knoppers BA, Azevedo DA (2010b) Pollution source evaluation using petroleum and aliphatic hydrocarbons in surface sediments from two Brazilian estuarine systems. Organic Geochemistry 41: 966-970.
- WHO (2010) Guidelines for indoor air quality, selected pollutants; polycyclic aromatic hydrocarbons. p 289.
- Xiang N, Jiang C, Yang T, Li P, Wang H, et al. (2018) Occurrence and distribution of Polycyclic aromatic hydrocarbons (PAHs) in seawater, sediments and corals from Hainan Island, China. Ecotoxicol Environ Saf 152: 8-15.
- Ahmed MM, Doumenq P, Awaleh MO, Syaktib AD, Asia L, et al. (2017) Levels and sources of heavy metals and PAHs in sediment of Djibouti-city (Republic of Djibouti). Mar Pollut Bull 120: 340-346.
- Driskill AK, Alvey J, Dotson AD, Tomco PL (2018) Monitoring polycyclic aromatic hydrocarbon (PAH) attenuation in Arctic waters using fluorescence spectroscopy. Cold Regions Sci Tech 145: 76-85.
- El-Naggar NA, Emara HI, Moawad MN, Soliman YA, El-Sayed AAM (2018) Detection of polycyclic aromatic hydrocarbons along Alexandria’s coastal water, Egyptian Mediterranean Sea. Egyptian Jou Aqua Res 44: 9-14.
- Ali AO, Hohn C, Allen PJ, Ford L, Dail MB, et al. (2014) The effects of oil exposure on peripheral blood leukocytes and splenic melanomacrophage centers of Gulf of Mexico fishes. Mar Pollut Bull 79: 87-93.
- Mostafa AR, Wade TL, Sweet ST, Al-Alimi A. Barakat AO (2009) Distribution and characteristics of polycyclic aromatic hydrocarbons (PAHs) in sediments of Hadhramout coastal area, Gulf of Aden, Yemen. J Marine Syst 78: 1-8.
- MFW (2001) Guide to fishes, Ministry of Fish Wealth, Marine Science and Resources center, Yemen.
- Heba HMA, Mahyoub AS, Al-Shawafi N (2000) Oil pollution in Gulf of Aden/ Arabian Sea Coasts of Yemen. Bull Nat Inst Oceanogr and fish ARE 26: 271-282.
- Dicks B (1987) Pollution. In: Red Sea (Key Environments). Edited by Edwards. A.J. and S.M. Head. Pergamon Press, Oxford, p. 44.
- DouAbul AAZ, Heba HMA (1995) Investigations following a fish kill in Bab el-Mandeb, Red Sea during November 1994. Report submitted to Environmental Protection Council (EPC) (Dutch Support Project to Technical Secretariat EPC, Yemen) p. 105.
- Heba HMA, Mahyoub AS, Al- Shawafi N, Al-Saad H (2003) Petroleum Hydrocarbons and Trace Metals in Mollusca (Tivela ponderosa) from the Gulf of Aden. JKAU: Mar Sci 14: 77-86.
- Grimalt J, Albaiges J, Al-Saad HT, DouAbul AAZ (1985) n-Alkane distribution in surface sediments from the Arabian Gulf. Naturwissenschaften 72: 35-38.
- Al-Shwafi NA (2012) Hydrographical Studies on the Gulf of Aden around Aden City, Yemen. Nature Environment and Pollution Technology. Int Quart Scient J 11: 519-522.
- UNEP/IOC/IAEA (1992) Determination of petroleum hydrocarbons in sediments. In: Reference Methods for Marine Pollution Studies 20. Nairobi: UNEP. p 75.
- Farrington JW, Frew NM, Gachwend PM, Tripp BW (1977) Hydrocarbons in cores of northwestern Atlantic Coastal and continental margin sediments. Estrus Coast Sci 5: 793-808.
- Burns KA, Villeneuve JP, Anderlini VC, Fowler SW (1982) Survey of tar, hydrocarbon and metal pollution in the coastal waters of Oman. Mar Pollut Bull 13: 240-247.
- Steinhauer SS, Boehm PD (1992) The composition and distribution of saturated and aromatic hydrocarbons in nearshore sediments, river sediments and coastal peat of the Alaskan Beaufort Sea: implications for detecting anthropogenic hydrocarbon inputs. Mar Environ Res 33: 223-253.
- Leahy JG, Colwell RR (1990) Microbial degradation of hydrocarbons in the environment. Microbiol Rev 54: 305-315.
- Colombo JC, Pelletier E, Brochu C, Khalil M, Catoggio JA (1989) Determination of hydrocarbon sources using n-alkane and polyaromatic hydrocarbon distribution indexes. Case study: Rio de la Plata Estuary. Argentina. Environ Sci Technol 23: 888-894.
- Weiner ER (2000) Applications of Environmental Chemistry: A Practical Guide for Environmental Professionals. Taylor & Francis, CRC Press, USA.
- Matsumoto G, Hanya T (1981) Comparative study on organic constituent in polluted and unpolluted inland aquatic environment. Features of hydrocarbons for polluted and unpolluted waters. Water Res 15: 217-224.
- Frysinger GS, Gaines RB, Xu L, Reddy CM (2003) Resolving the unresolved complex mixture in petroleum-contaminated sediments. Environ Sci Technol 37: 1653-1662.
- Commendatore MG, Nievas ML, Amin O, Esteves JL (2012) Sources and distribution of aliphatic and polyaromatic hydrocarbons in coastal sediments from the Ushuaia Bay (Tierra del Fuego, Patagonia, Argentina). Mar Environ Res 74: 20-31.
- Vaezzadeh V, Zakaria MP, Shau-Hwai AT, Ibrahim ZZ, Mustafa S, et al. (2015) Forensic investigation of aliphatic hydrocarbons in the sediments from selected mangrove ecosystems in the west coast of Peninsular Malaysia. Mar Pollut Bull 100: 311-320.
- Readman JW, Fillmann G, Tolosa I, Bartocci J, Villeneuve JP, et al. (2002) Petroleum and PAH contamination of the Black Sea. Mar Pollut Bull 44: 48-62.
- Pikkarainen A, Lemponen P (2005) Petroleum hydrocarbon concentration in Baltic Sea subsurface water. Boreal Environ Res 10: 125-134.
- Zakaria MP, Takada H, Tsutsumi S, Ohno K, Yamada J, et al. (2002) Distribution of polycyclic aromatic hydrocarbons (PAHs) in rivers and estuaries in Malaysia: a widespread input of petrogenic PAHs. Environ Sci Technol 36: 1907-1918.
- Stout SA, Uhler AD, Emsbo-Mattingly SD (2004) Comparative evaluation of background anthropogenic hydrocarbons in surficial sediments from nine urban waterway. Environ Sci Technol 38: 2987-2994.
- Yunker MB, Macdonald RW, Vingarzan R, Mitchell RH, Goyette D, et al. (2002) PAHs in the Fraser River basin: a critical appraisal of PAH ratios as indicators of PAH source and composition. Org Geochem 33: 489-515.
- Li G, Xia X, Yang Z, Wang R, Voulvoulis N (2006) Distribution and sources of polycyclic aromatic hydrocarbons in the middle and lower reaches of the Yellow River, China. Environ Pollut 144: 985-993.
- Oppenheiner CH (1980) Oil ecology. In: Marine environment pollution I. Hydrocarbons. Geyer RA (ed.) Elsevier Scientific, Netherlands, pp 21-35.
- Law RJ (1981) Hydrocarbon concentrations in water and sediments from UK marine waters, determined by fluorescence spectroscopy. Mar Pollut Bull 12: 153-157.
- Bicego MC, Weber RR, Ito RG (1996) Aromatic Hydrocarbons on surface waters of Admiralty Bay, King George Island, Antractica. Mar Pollut Bull 32: 549-553.
- Zanardi E, BÃcego MC, Weber RR (1999) Dissolved/dispersed petroleum aromatic hydrocarbons in the Sâo Sebastiâo channel, Sâo Paulo, Brazil. Mar Pollut Bull 5: 410-413.
- Bicego MC, Zanardi-Lamardo E, Taniguchi S, Weber RR (2002) Natural levels of dissolved/dispersed petroleum hydrocarbons in the South West Atlantic. Mar Pollut Bull 44: 1152-1169.
- SEPA (State Environmental Protection and Administration of China) (1998) State Oceanic Administration of China, Sea Water Quality Standard GB 3097-1997.
- Gordon DC, Prouse NJ (1973) The effects of three oils on marine phytoplankton photosynthesis. Mar Biol 22: 329-333.
Citation: Al-Akhaly IA, Al-Matari BY, Al-Shwafi NA, Siam EI (2018) Concentrations of Petroleum Hydrocarbons Residual in Seawater of Aden Coasts, Yemen. J Marine Sci Res Dev 8:259. DOI: 10.4172/2155-9910.1000259
Copyright: © 2018 Al-Akhaly et al. This is an open-access article distributed under the terms of the Creative Commons Attribution License, which permits unrestricted use, distribution, and reproduction in any medium, provided the original author and source are credited.
Share This Article
Recommended Journals
Open Access Journals
Article Tools
Article Usage
- Total views: 4803
- [From(publication date): 0-2018 - Apr 26, 2025]
- Breakdown by view type
- HTML page views: 3909
- PDF downloads: 894

