Comprehensive Pan-cancer Analysis of 33 Human Cancers Reveals the Immunotherapy Value of FOXP3
Received: 01-Feb-2022 / Manuscript No. AOT-22-52519 / Editor assigned: 04-Feb-2022 / PreQC No. AOT-22-52519(PQ) / Reviewed: 18-Feb-2022 / QC No. AOT-22- 52519 / Revised: 21-Feb-2022 / Manuscript No. AOT-22-52519(R) / Published Date: 28-Feb-2022 DOI: 10.4172/aot-7.S1-1000001
Abstract
Background: Previous studies reported that FOXP3 is involved in the regulation of tumor microenvironment and the regulation of tumor local immunity. However, its mechanism has not been fully studied. This study aims to explore the potential relationship between FOXP3 and cancer immunotherapy in 33 human cancers.
Methods: The gene expression data and clinical characteristics of 33 cancers were retrieved from the Cancer Genome Atlas database. The immunotherapy cohort includes GSE157893, GSE67501, and IMvigor210, which come from a comprehensive gene expression database and are included in previously published studies. Analyse clinical parameters, including patient age, gender, and tumor stage to assess the prognostic value of FOXP3. At the same time, we conducted survival analysis and correlation analysis of tumor microenvironment. The correlation between FOXP3 and immunosuppressive agents and stimulants, as well as major histocompatibility complexes was also analysed. Potential pathways related to FOXP3 signalling in cancer have also been explored. In addition, the correlation between FOXP3 and two immunotherapy biomarkers (tumor mutation burden and microsatellite instability) was studied. Finally, the immunotherapy response relationship between FOXP3 and the immunotherapy cohort was explored.
Results: Among 33 cancer types, FOXP3 expression is different in different clinical groups (gender, age, and tumor stage) in certain cancers, and it also shows potential prognostic value in predicting patient survival. FOXP3 is correlated with immune cell infiltration, immunomodulatory and immunotherapy markers. In addition, low FOXP3 expression is significantly associated with certain pathways. However, no significant correlation was observed between FOXP3 and immunotherapy response.
Conclusion: This study explored the immunotherapy value of FOXP3 expression in 33 human cancers, and provided evidence and insights for the application of FOXP3 expression in tumor immunotherapy. However, considering the bioinformatics methods used in this study, the findings of the study are only preliminary, and more relevant experimental verifications are needed.
Keywords: Bio-informatics; Pan cancer; FOXP3; Immunity
Abbreviations
ACC: Adrenocortical Carcinoma; BLCA: Bladder Urothelial Carcinoma; BRCA: Breast Invasive Carcinoma; CESC: Cervical Squamous Cell Carcinoma and Endocervical Adenocarcinoma; CHOL: Cholangiocarcinoma; COAD: C o l o n Adenocarcinoma; DLBC: Lymphoid Neoplasm Diffuse Large B-cell; ESCA: Esophageal Carcinoma; GBM: Glioblastoma Multiforme; HNSC: Head and Neck Squamous Cell Carcinoma; KICH: Kidney Chromophobe; KIRC: Kidney Renal Papillary Cell Carcinoma; KIRP: Kidney Renal Papillary Cell Carcinoma; LAML: Acute Myeloid Leukaemia; LGG: Brain Lower Grade Gliomas; LIHC: Liver Hepatocellular Carcinoma; LUAD: Lung Adenocarcinoma; LUSC: Lung Squamous Cell Carcinoma; MESO: Mesothelioma; OV: Ovarian Serous Cyst Adenocarcinoma; PAAD: Pancreatic Adenocarcinoma; PCPG: Pheochromocytoma and Paraganglioma; PRAD: Prostate Adenocarcinoma; PEAD: Rectum Adenocarcinoma; SARC: Sarcoma; SKCM: Skin Cutaneous Melanoma; STAD: Stomach Adenocarcinoma; TGCT: Testicular Germ Cell Tumours; THCA: Thyroid Carcinoma; THYM: Thymoma; UCEC: Uterine Corpus Endometrial Carcinoma; UCS: Uterine Carcinosarcoma; UVM: Uveal Melanoma.
Introduction
Humoral immunity and cellular immunity are the two main effect mechanisms of human anti-tumor immunity. Of the two, cellular immunity plays a more important role in anti-tumor. Among them, T lymphocytes are the main participating cells. Regulatory T cells are the main cell population for anti-tumor immunosuppression. There is a fixed ratio of immune cells in the normal body. If this ratio is changed, it will lead to the body’s immune tolerance or weakened immune function, which will allow tumor cells to escape the host immune system. Identification and attack [1,2]. Studies have found that Treg plays an important role in tumor immunity. A high proportion of regulatory T cells have been found in various tumors such as non-small cell lung cancer and gastric cancer, and they are positively correlated with tumor metastasis and invasion [3-5]. Fork head box protein 3 (FOXP3) is an important member of the fork head/wing-shaped spiral transcription factor family and is mainly expressed in Treg. It is a landmark molecule of Treg. It regulates regulatory T cells (regulatory T cells). Cells, Treg and immune suppression [6,7]. At the same time, FOXP3 can exert an immunosuppressive function by regulating the content of anti inflammatory factors such as IL-10 and TGFβ, and the expression of thousands of proteins in the body is also regulated by it [8]. TGF-β1 is a classic inhibitory cytokine that inhibits the immune function of DCs in the tumor microenvironment. Down-regulating the expression of FOXP3 can significantly reduce the secretion of TGF-β1. It can be seen that FOXP3 participates in the regulation of tumor microenvironment and the regulation of tumor local immunity [9]. Studies have reported that the high expression of FOXP3 in tumor tissues due to the impaired tumor immune function leads to poor anti-tumor response. In breast cancer, cervical cancer, liver cancer, lung cancer and other tumor tissues, the increased expression of FOXP3 is associated with poor antitumor response, but the high expression of FOXP3 has been reported to be associated with good clinical results in patients with colorectal cancer [10-12]. However, few previous studies have paid attention to the immunotherapy value of FOXP3 in human cancer.
In this study, the expression of FOXP3 in 33 different cancers was demonstrated, and the potential impact of FOXP3 on the tumor immune microenvironment was studied. At the same time, in this article, we studied the relationship between FOXP3 expression and Tumor Mutational Burden (TMB), Microsatellite Instability (MSI) and other immunomodulatory and dynamic immune biomarkers. The relationship between FOXP3 expression and three immunotherapy cohorts was analysed. In general, the research in this article provides a basis for the immunotherapy of FOXP3 in cancer, which may provide directions for further experiments.
Materials and Methods
Data collection
The expression data, mutation data, survival data and pan-cancer clinical data of 33 cancers are from UCSC Xena: (http://xena.ucsc. edu/). For the treatment cohort, a systematic search was conducted to determine the immune checkpoint lockout cohort, which can be retrieved and reported complete clinical information publicly. This study finally adopted three immunotherapy cohorts: Engineered IL- 15 cytokine mutein fused with anti-PD1 antibody can improve T cell function and anti-tumor immunity in tumors (GSE157893 cohort downloaded from GEO); use of Niwudan Treatment-resistant renal cell carcinoma (GSE67501 cohort downloaded from GEO); advanced urothelial carcinoma and atezolizumab intervention (IMvigor210 cohort downloaded from a previously published study) [13].
The clinical correlation between FOXP3 expression and various cancers
Use the limma package in the R studio software to extract the expression level of the target gene FOXP3 and analyse the difference of the target gene FOXP3 to observe whether there is a difference between normal tissues and tumor tissues. We also investigated whether FOXP3 expression is different between different clinical groups (gender, age, and tumor stage). At the same time, use the limma package, GSVA package and GSEA Base package in the R studio software to score gene activity.
According to the expression level of the target gene, it is divided into two groups of high and low expression. The survival package in R is used to perform Kaplan-Meier survival analysis to study the time-dependent value of FOXP3 in 33 cancers. The contents of the study include overall survival (OS: The time from the start of treatment to death), disease-free survival (DFS: The period from the start of treatment to the recurrence of the disease), and disease-specific survival (DSS: The outcome index changes to specific Death caused by disease), progression-free survival (PFS: the period from the start of treatment to the progression of the disease). p value<0.05 is considered to be a difference in survival between the high and low expression groups.
Analyse the potential relationship between FOXP3 expression and immune-related factors
First, use the ESTIMATE package in the R studio software to calculate the matrix score and immune score of each case; ESTIMATE is a tool used to predict tumor purity and the presence of infiltrating matrix and immune cells in tumor problems [14]. The ESTIMATE algorithm is based on a single-sample GSEA and generates four final scores: Matrix score (the higher the score, the more stromal cells in the tumor tissue), the immune score (the higher the score, the more immune cells in the tumor tissue), and the comprehensive score (The higher the score, the higher the content of stromal cells and immune cells in the tumor tissue), and the purity of the tumor (the higher the overall score, the lower the purity of the tumor in the sample). Subsequently, use the ggplot2 package, ggpubr package and gg Extra package in the R studio software to analyse the correlation of the tumor microenvironment; use the e1071 package, pre-process Core package and Linna package in the R studio software to perform the immune cell infiltration analysis to obtain the immunity in each sample Cell content, followed by correlation analysis of immune cells to get the correlation between FOXP3 expression in tumor tissues and immune cell content; then correlation analysis of immune genes, in addition, through the TISIDB website (http://cis.hku.hk/TISIDB/index.php) explored the potential relationship between FOXP3 expression and immunosuppressive genes, immune stimulatory genes and MHC-related genes. Then highlight the two most relevant results and show them in the graph. Finally, in order to further study related signalling pathways, GSEA analysis was performed to determine the differential pathways between the low FOXP3 expression group and the high FOXP3 expression group. These pathways were from the Kyoto Encyclopaedia of Genes and Genome database. If the relevant signal pathway meets a specific standard (p<0.05), save the relevant signal pathway in the output graph. If the relevant signal pathway in the enrichment result is greater than 5, the top 5 most significant enrichment will be displayed. If the result of the collection pathway is less than 5, it shows all the enrichment pathways.
Immunotherapy response analysis
This study included and analysed three related independent immunotherapy cohorts. Under normal circumstances, immunotherapy produces four outcomes: Complete Remission (CR), Partial Remission (PR), Disease Progression (PD), and Stable Disease (SD). Perform immunotherapy analysis on three data sets to study whether the expression of target gene FOXP3 affects the effect of patients receiving immunotherapy. In this study, those who achieved complete remission and partial remission were classified as the response group, and those who achieved disease progression and stable disease were classified as the non-response group, and then the two groups were compared.
Results
FOXP3 expression in 33 cancers
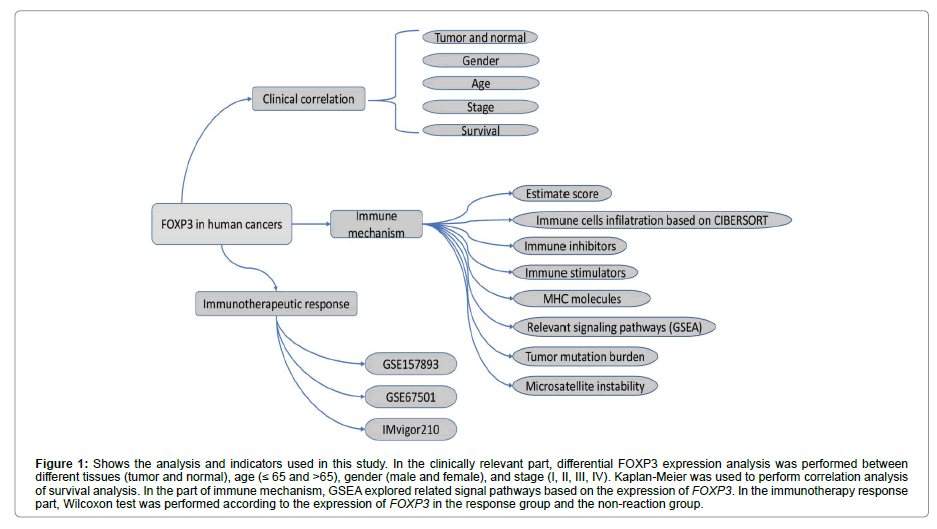
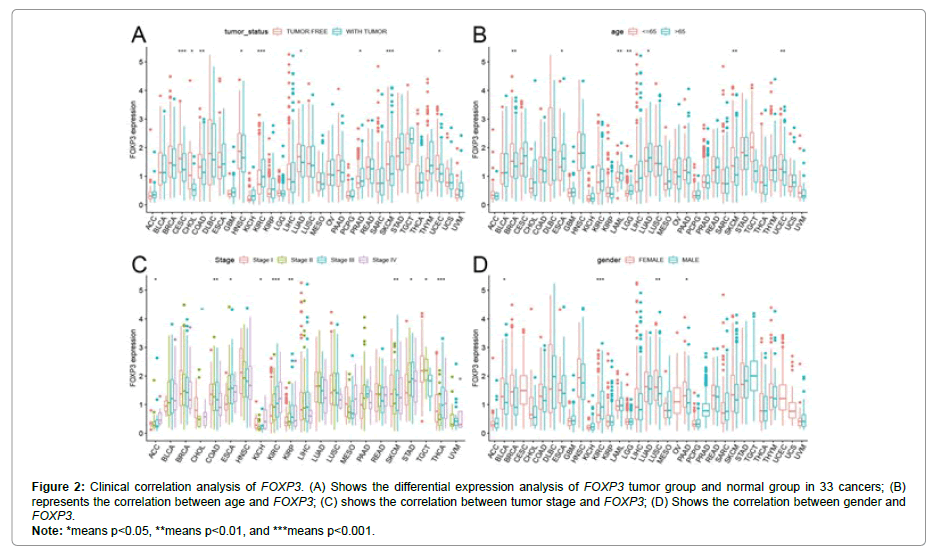
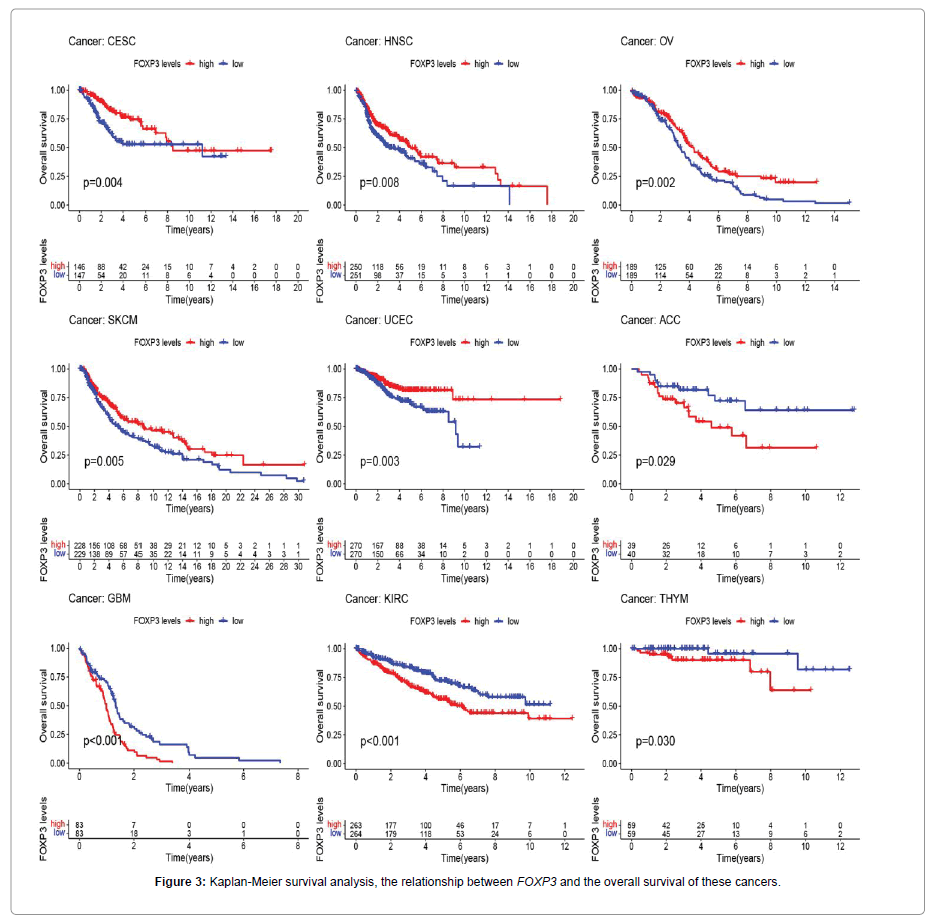
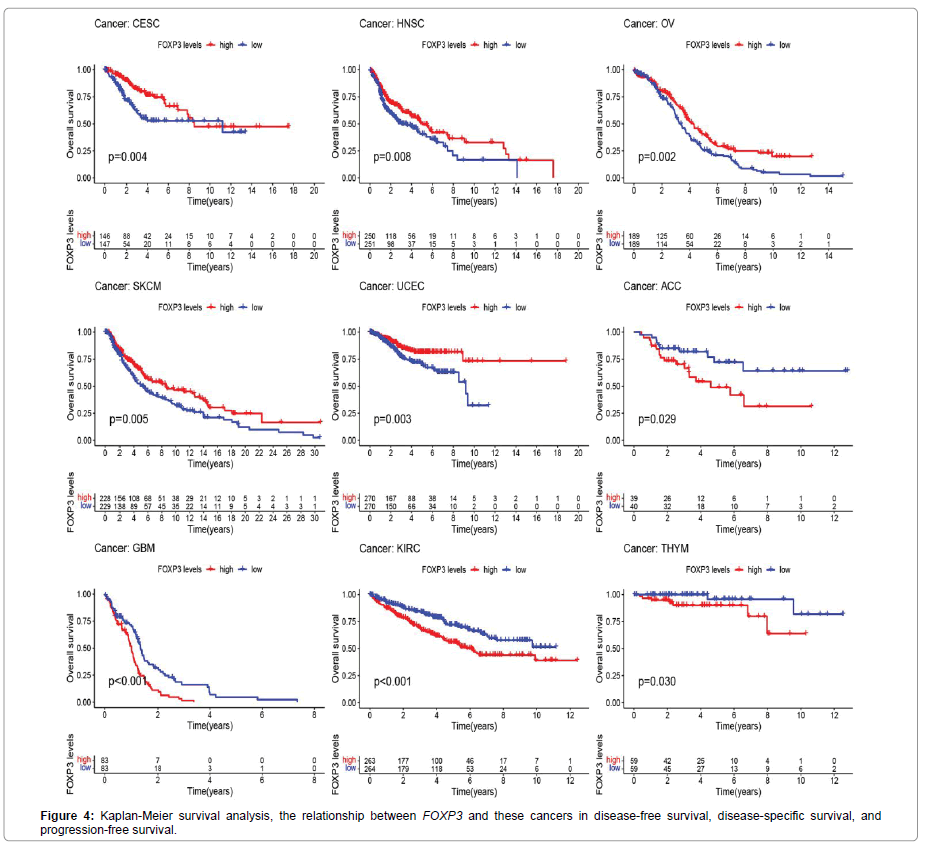
In order to better show the method and content of this research, we show the details in Figure 1. The 33 cancers involved in this research are shown in abbreviations. In Figure 2A, the expression of FOXP3 is different in 33 types of tumors (CESC, CHOL, COAD, HNSC, KIRC,LUAD, PRAD, SKCM, UCEC). In Figure 2B, FOXP3 is highly expressed in elderly patients in the ESCA, LAML, LGG, and LUAD groups, but is low in elderly patients in the BRCA and SKCM groups. Figure 2C shows that FOXP3 expression is different in different stages of certain tumors, including ACC, COAD, ESCA, KICH, KIRC, KIRP, SKCM, STAD, TGCT, and THCA. Figure 2D shows the difference in the expression of FOXP3 in different genders of certain tumors, including BLCA, KIRC, LUSC, and PAAD. In Figure 3, there is a significant positive correlation between the expression of FOXP3 in CESC, HNSC, OV, SKCM, and UCEC and overall survival. There is a negative correlation between the expression of FOXP3 in ACC, GBM, KIRC, and THYM and overall survival. Figure 4 shows that in UCEC, the expression of FOXP3 is positively correlated with disease-free survival, disease-specific survival, and progression-free survival. The expression of FOXP3 is positively correlated with disease-free survival in BLCA. In diseasespecific survival and progression-free survival, the expression of CESC, HNSC and FOXP3 are positively correlated, and GBM and KIRC are negatively correlated.
Figure 1: Shows the analysis and indicators used in this study. In the clinically relevant part, differential FOXP3 expression analysis was performed between different tissues (tumor and normal), age (≤ 65 and >65), gender (male and female), and stage (I, II, III, IV). Kaplan-Meier was used to perform correlation analysis of survival analysis. In the part of immune mechanism, GSEA explored related signal pathways based on the expression of FOXP3. In the immunotherapy response part, Wilcoxon test was performed according to the expression of FOXP3 in the response group and the non-reaction group.
Figure 2: Clinical correlation analysis of FOXP3. (A) Shows the differential expression analysis of FOXP3 tumor group and normal group in 33 cancers; (B)
represents the correlation between age and FOXP3; (C) shows the correlation between tumor stage and FOXP3; (D) Shows the correlation between gender and
FOXP3.
Note: *means p<0.05, **means p<0.01, and ***means p<0.001.
The relationship between FOXP3 expression and immunerelated factors
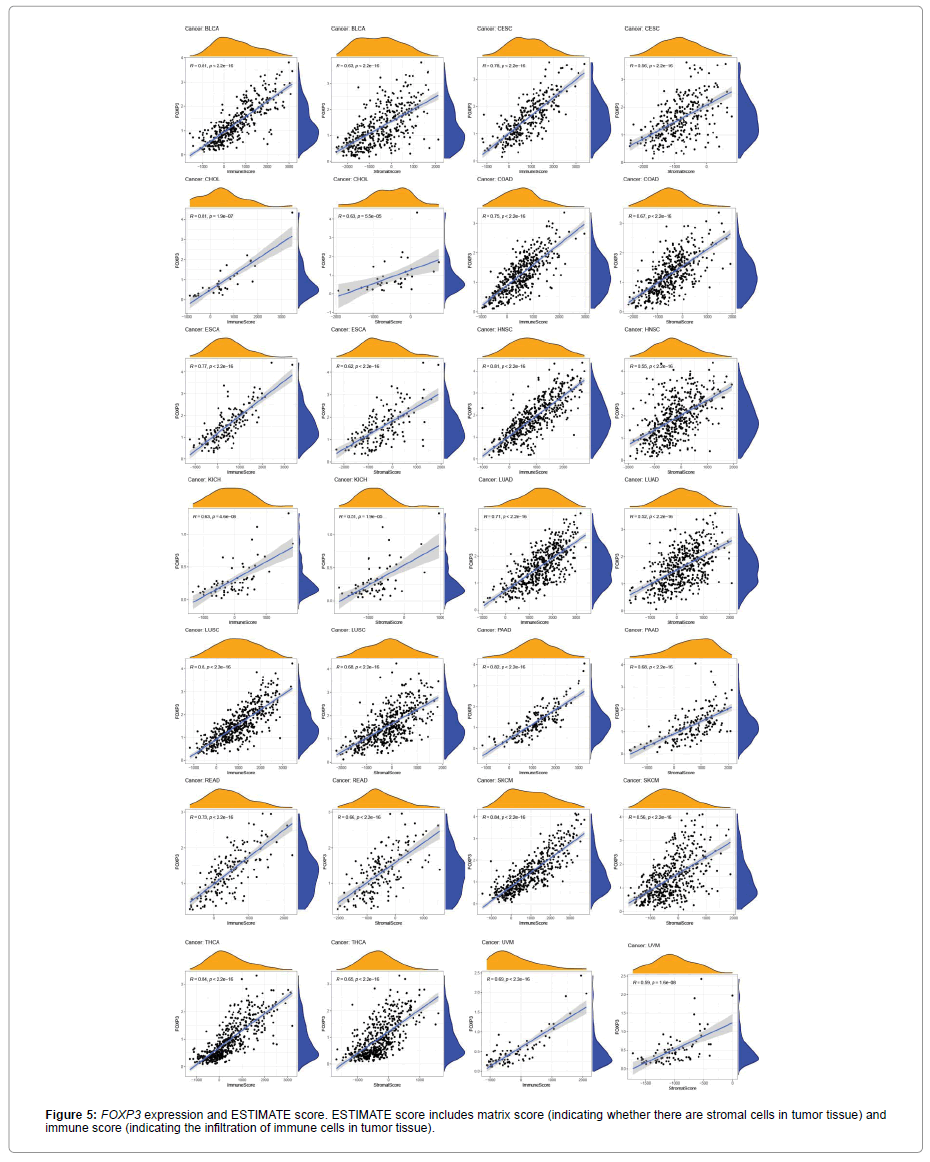
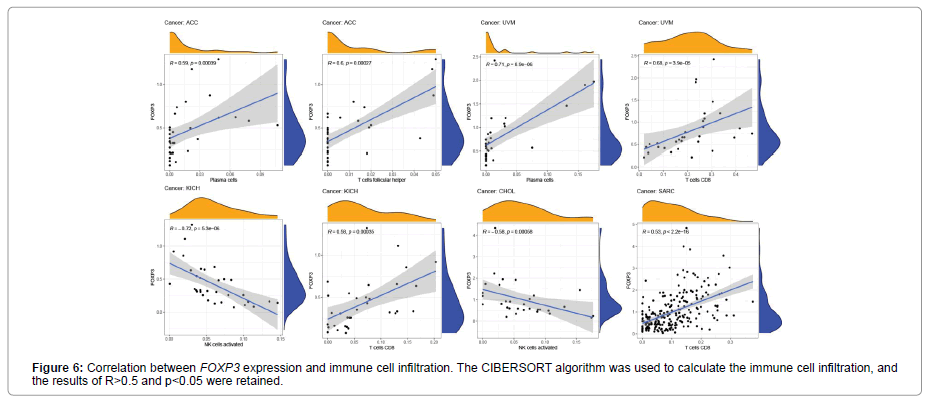
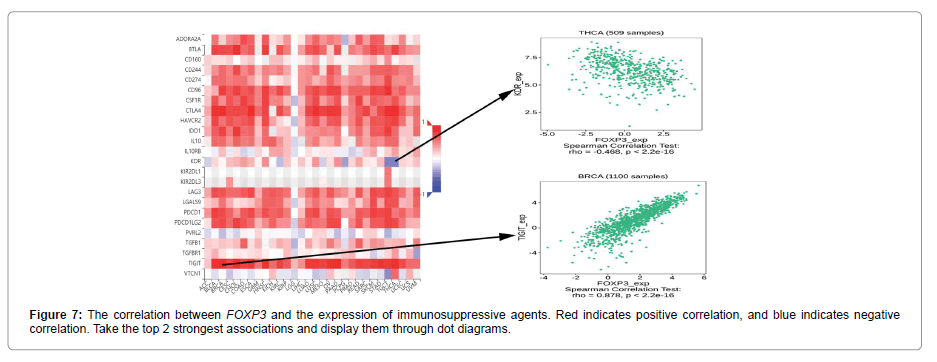
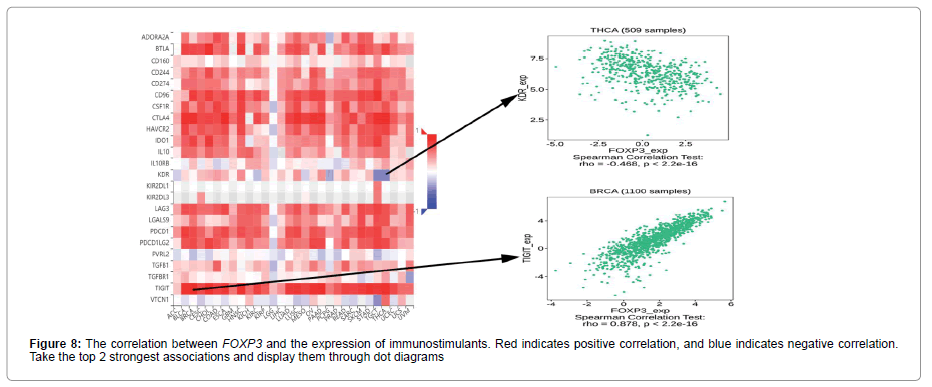
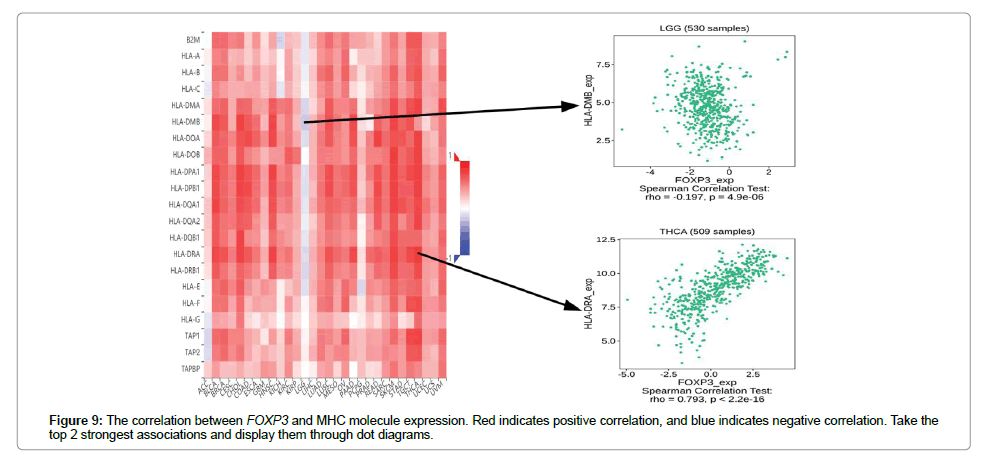
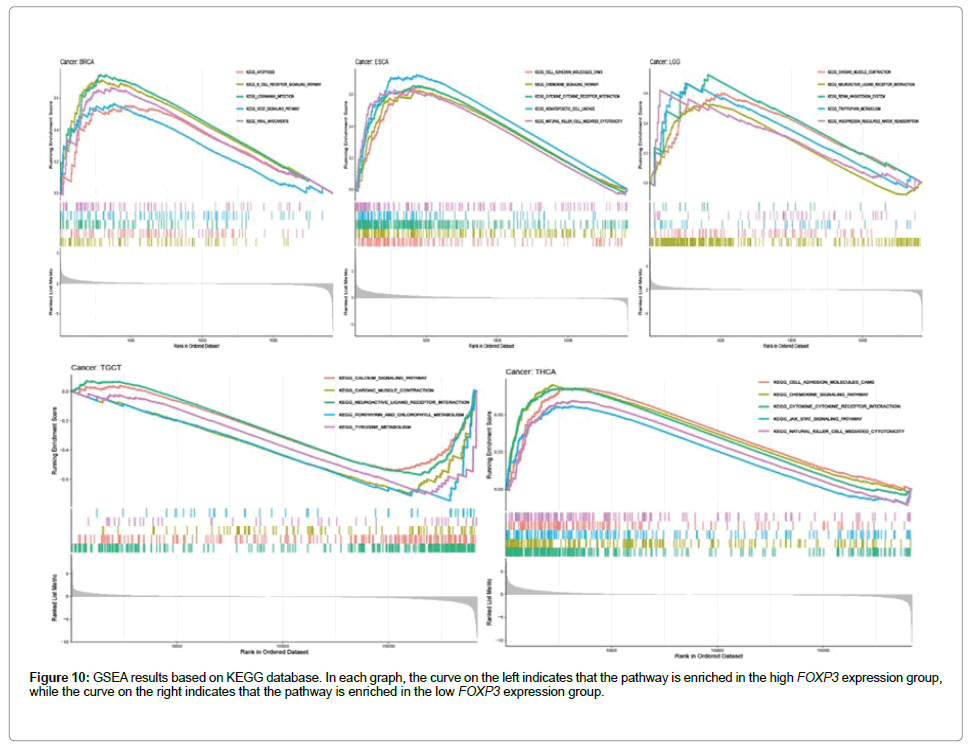
Figure 5 shows the relationship between the expression level of FOXP3 and the content of stromal cells and immune cells. There is a positive correlation in BLCA, CESC, CHOL, COAD, ESCA, HNSC, KICH, LUAD, LUSC, PAAD, READ, SKCM, THCA and UVM (Figure 6). In terms of immune cell infiltration, FOXP3 expression is positively correlated with the content of Plasma cells in ACC and UVM; FOXP3 expression is positively correlated with the content of T cells follicular helper in ACC; FOXP3 expression is negatively correlated with NK cells activated in KICH and CHOL Correlation;FOXP3 expression is positively correlated with T cells CD8 in KICH, SARC, UVM. At the same time, the correlation between FOXP3 expression and immunomodulatory was also studied. In the analysis of immunosuppressive agents, Figure 7 shows that FOXP3 expression is positively correlated with BRCA TIGIT, and negatively correlated with THCA KDR. Figure 8 shows that in the analysis of immune stimulants, the expression of FOXP3 is positively correlated with the ICOS of ESCA and negatively correlated with the CD276 of TGCT. Figure 9 shows that FOXP3 expression is positively correlated with HLA-DRA of THCA, and negatively correlated with HLA-DMB of LGG. In Figure 10, considering the strong correlation between FOXP3 and THCA, BRCA, TGCT, ESCA, and LGG, we conducted a GSEA analysis to study the relationship between FOXP3 signalling pathways and their relationships. The pathway Cell adhesion molecule cam was enriched in the FOXP3 high expression group in ESCA and THCA. In Figure 11, FOXP3 expression is positively correlated with tumor mutation burden in THYM, UCEC, BRCA, and LGG, and negatively correlated with DLBC, HNSC, LUAD, LUSC, PAAD, and TGCT. In the correlation analysis of microsatellite instability, FOXP3 is positively correlated with UCEC and THCA, but negatively correlated with DLBC, ESCA, HNSC, KIRP, LIHC, LUSC, OV, SKCM, STAD, TGCT.
FOXP3 immunotherapy response
In Figure 11, in the three immunotherapy cohorts involved in this study, there was no significant difference in the expression of FOXP3 between the response group and the non-responder group. The observed trends indicate that it seems that patients with low FOXP3 expression are more effective for immunotherapy.
Discussion
A comprehensive study of the differential expression of FOXP3 in 33 types of cancers, normal tissues and tumor tissues, has found the potential immunotherapy value of FOXP3. FOXP3 not only participates in the regulation of tumor microenvironment, but also participates in the regulation of tumor local immunity. Therefore, we have conducted related research including tumor microenvironment, immune cells, and immunomodulatory and immunotherapy response. In this study, our goal is to gain a deeper understanding of the potential immunological association between FOXP3 and 33 human cancers. First, we studied the correlation between FOXP3 and clinical parameters and found that only a small number of cancers have significant differences in FOXP3 expression with gender, age, and tumor stage, including CESC, CHOL, COAD, HNSC, KIRC, LUAD, PRAD, SKCM, UCEC. Amaral MGD found that the age difference between FOXP3 expression and oral tongue squamous cell carcinoma was not significant [15]. Another study showed that in colorectal cancer, the expression of FOXP3 is related to gender and Dukes staging [16], which is consistent with the results of this study. FOXP3 has a certain prognostic value in certain cancers, and related studies have also shown that the high density of FOXP3 in tumor tissues is a powerful independent prognostic marker related to mortality [17]. Many previous studies have considered FOXP3 as an independent factor affecting the poor prognosis of various cancers. For example, in patients with tongue squamous cell carcinoma and Oropharyngeal squamous cell carcinoma, high expression of FOXP3 is associated with low overall survival rate [18,19]. In breast cancer, the expression of FOXP3 in breast cancer tissue is significantly higher than that in normal breast tissue, and the increase in FOXP3 expression in tumor tissue is related to poor prognosis [20,21]. The above content illustrates the usefulness of FOXP3 in the prognosis of cancer. Therefore, we hypothesize that the regulation of FOXP3 expression in various types of cancer may be clinically beneficial.
In order to further study the potential value of FOXP3, the correlation between FOXP3 and immune cell infiltration was discussed. In terms of immune cell infiltration, FOXP3 expression is positively correlated with plasma cell content in ACC and UVM. FOXP3 expression is positively correlated with the content of T cells follicular helper in ACC; FOXP3 expression is positively correlated with T cells CD8 in KICH, SARC and UVM. Previous studies have shown that CD8 and TGF-β1 are the two main factors in the tumor immune microenvironment. CD8+ T cells are the most important effector executive cells in the tumor immune microenvironment. Inhibiting their activity will affect the body’s immune defence function. FOXP3 can help tumor cells escape by inhibiting or killing CD8+ T cells [22]. In KICH and CHOL, we observed that FOXP3 expression is negatively correlated with NK cells activated. In the analysis of various immunosuppressive agents, we found that the expression of FOXP3 was correlated with the TIGIT of TGCT, and negatively correlated with the KDR of TGCT. TIGIT is an immunosuppressive receptor of T cell immunoglobulin, which is mainly expressed in T cells and natural killer cells, and can inhibit the function of immune cells through a variety of mechanisms to affect the prognosis of cancer patients [23,24]. Based on these data, we propose that there may be potential mechanisms for FOXP3, TIGIT and T cells, but this requires further experimental verification. In the analysis of immune stimulants and MHC molecules, the expression of FOXP3 was positively correlated with ICOS and HLA-DRA of TGCT, but negatively correlated with CD276. This discovery may lead to CD276 becoming a new type of immunomodulatory. Considering the relationship between FOXP3 and THCA, BRCA, TGCT, ESCA, LGG, we conducted a GSEA analysis to study the relationship between FOXP3 signalling pathways and these cancers. The results showed that the pathway Cell adhesion molecules cam was enriched in the FOXP3 high expression group in ESCA and THCA. There have been few reports on FOXP3 and this pathway. The discovery of this pathway may provide some ideas for immunotherapy research. In addition, in this study, we found that tumor mutation burden and microsatellite instability are shown to be related to FOXP3 in some cancers. Tumor mutation load can be used to predict the efficacy of immune checkpoint blockade and the evaluation of tumor neoantigen load, and it has become a biomarker in certain cancer types [25]. Microsatellite instability is a hallmark feature of DNA mismatch repair defects, and it is an important diagnostic and prognostic cancer biomarker [26]. FOXP3 is positively correlated with TMB and MSI in UCEC, and negatively correlated with two immunotherapy biomarkers in DLBC, HNSC, and LUSC. This indicates that FOXP3 has an indirect effect on the immunotherapy of UCEC, DLBC, HNSC, and LUSC. Finally, we studied the correlation between FOXP3 and the three immunotherapy cohorts. However, no significant difference was found in the three immunotherapy cohorts. We hypothesized that FOXP3 may be used to image immunotherapy response through TICIT, ICOS, HLA-DRA, etc. Our research only involves three immunotherapy cohorts, and we cannot fully clarify the actual immunotherapy value of FOXP3. In the future, more immunotherapy cohorts should be studied.
This article studies the value of FOXP3 in 33 cancer types, provides valuable insights into the role of FOXP3 in cancer immunotherapy, and explores FOXP3 and important immunological indicators (immune cell infiltration, immune modulators, and immune biology Markers). These findings may help to understand the potential link mechanism between FOXP3 and immunotherapy. Not all of the 33 human cancers in this study showed an association with FOXP3 in the tumor immune microenvironment, indicating that FOXP3 only plays an immunological role in specific cancer types. These findings will help immune targeted therapy Research. However, considering that bioinformatics analysis was used in this study, the findings of the study are only preliminary. We also need to follow up with more relevant experimental verification.
Conclusion
This study is the first to explore the immunotherapy value of FOXP3 in 33 human cancers, investigate the value of FOXP3 in 33 cancer types, provide valuable insights into the role of FOXP3 in cancer immunotherapy, and explore the role of FOXP3 and FOXP3 in cancer immunotherapy. We believe these findings will help provide new insights into tumor immunotherapy research.
Data Availability Statement
The datasets presented in this study can be found in online repositories.The names of the repository/repositories and accession number(s) can be found in the article/Supplementary Material.
Author Contributions
Yiyang Chen and Xi Ou conceived of the presented idea. Data mining and gene analysis were carried out by Yiyang Chen, and Yiju Gong. Yiyang Chen and Jikui Liu wrote the manuscript. Yiyang Chen, Yiju Gong contributed to the manuscript revision. All authors contributed to the article and approved the submitted version.
Funding
The Sanming Project of Medicine in Shenzhen (Grant no. SZSM201612021), the Science and Technology Developing Project of Guangdong Province (Grant no. 2017B090904010).
Conflicts of Interest
The authors declare that the research was conducted in the absence of any commercial or financial relationships that could be construed as a potential conflict of interest.
Acknowledgments
We want to thank UCSC, GEO for free use.
Declarations
Ethics approval and consent to participate
This study is approved by the Ethics Committee of Peking University Shenzhen Hospital.
Consent for publication
Not applicable
Competing interests
The authors declare that they have no competing interests.
References
- Razek AA, Massoud SM, Azziz MR, El-Bendary MM, Zalata K, et al. (2015) Prediction of esophageal varices in cirrhotic patients with apparent diffusion coefficient of the spleen. Abdom Imaging 40: 1465-1469.
[CrossReff] [Google Scholar] [PubMed]
- Ozakyol A (2017) Global epidemiology of Hepatocellular Carcinoma (HCC Epidemiology). J Gastrointest Cancer 48: 238-240.
[CrossReff] [Google Scholar] [PubMed]
- Wei T, Zhang J, Qin Y, Wu Y, Zhu L, et al. (2015) Increased expression of immunosuppressive molecules on intra-tumoral and circulating regulatory T cells in non-small cell lung cancer patients. Am J Cancer Res 5: 2190-2201.
[Google Scholar] [PubMed]
- Hao Q, Li W, Zhang C, Qin X, Xue X, et al. (2013) TNF alpha induced FOXP3-NF kappa B interaction dampens the tumor suppressor role of FOXP3 in gastric cancer cells. Biochem Biophys Res Commun 430: 436-441.
[CrossReff] [Google Scholar] [PubMed]
- Chen X, Takemoto Y, Deng H, Middelhoff M, Friedman RA, et al. (2017) Histidine decarboxylase (HDC)-expressing granulocytic myeloid cells induce and recruit FOXP3(+) regulatory T cells in murine colon cancer. Oncoimmunology 6: e1290034.
[CrossReff] [Google Scholar] [PubMed]
- Lee JH, Shin HJ, Yoon JH, Kim EK, Moon HJ, et al. (2017) Predicting lymph node metastasis in patients with papillary thyroid carcinoma by vascular index on power Doppler ultrasound. Head Neck 39: 334-340.
[CrossReff] [Google Scholar] [PubMed]
- Campbell C, Rudensky A (2020) Roles of regulatory T cells in tissue pathophysiology and metabolism. Cell Metab 31: 18-25.
[CrossReff] [Google Scholar] [PubMed]
- Haque R, Lei F, Xiong X, Song J (2011) The Regulation of FOXP3-expressing regulatory T cells. Endocr Metab Immune Disord Drug Targets 11: 334-346.
[CrossReff] [Google Scholar] [PubMed]
- Junttila MR, de Sauvage FJ (2013) Influence of tumour micro-environment heterogeneity on therapeutic response. Nature 501: 346-354.
[CrossReff] [Google Scholar] [PubMed]
- Raffin C, Vo LT, Bluestone JA (2020) Treg cell-based therapies: Challenges and perspectives. Nat Rev Immunol 20: 158-172.
[CrossReff] [Google Scholar] [PubMed]
- Yang S, Liu Y, Li MY, Ng CSH, Yang SL, et al. (2017) FOXP3 promotes tumor growth and metastasis by activating Wnt/beta-catenin signaling pathway and EMT in non-small cell lung cancer. Mol Cancer 16: 124.
[CrossReff] [Google Scholar] [PubMed]
- Sun X, Feng Z, Wang Y, Qu Y, Gai Y (2017) Expression of FOXP3 and its prognostic significance in colorectal cancer. Int J Immunopathol Pharmacol 30: 201-206.
[CrossReff] [Google Scholar] [PubMed]
- Mariathasan S, Turley SJ, Nickles D, Castiglioni A, Yuen K, et al. (2018) TGF beta attenuates tumour response to PD-L1 blockade by contributing to exclusion of T cells. Nature 554: 544-548.
[CrossReff] [Google Scholar] [PubMed]
- Yoshihara K, Shahmoradgoli M, Martinez E, Vegesna R, Kim H, et al. (2013) Inferring tumour purity and stromal and immune cell admixture from expression data. Nat Commun 4: 2612.
- Amaral MGD, Sena LSB, Batista AC, MendonCa EF, GordOn NMA, et al. (2020) FOXP3+ regulatory T cells in oral tongue squamous cell carcinoma in young and older patients. Braz Oral Res 34: e096.
- Liu Z, Huang Q, Liu G, Dang L, Chu D, et al. (2014) Presence of FOXP3(+) Treg cells is correlated with colorectal cancer progression. Int J Clin Exp Med 7: 1781-1785.
[CrossReff] [Google Scholar] [PubMed]
- Ohara M, Yamaguchi Y, Matsuura K, Murakami S, Arihiro K et al. (2009) Possible involvement of regulatory T cells in tumor onset and progression in primary breast cancer. Cancer Immunol Immunother 58: 441-447.
[CrossReff] [Google Scholar] [PubMed]
- Weller P, Bankfalvi A, Gu X, Dominas N, Lehnerdt GF, et al. (2014) The Role of tumour FOXP3 as prognostic marker in different subtypes of head and neck cancer. Eur J Cancer 50: 1291-1300.
[CrossReff] [Google Scholar] [PubMed]
- Liang YJ, Liu HC, Su YX, Zhang TH, Chu M, et al. (2011) FOXP3 expressed by tongue squamous cell carcinoma cells correlates with clinicopathologic features and overall survival in tongue squamous cell carcinoma patients. Oral Oncol 47: 566-570.
[CrossReff] [Google Scholar] [PubMed]
- Bates GJ, Fox SB, Han C, Leek RD, Garcia JF, et al. (2006) Quantification of regulatory T cells enables the identification of high-risk breast cancer patients and those at risk of late relapse. J Clin Oncol 24: 5373-5380.
[CrossReff] [Google Scholar] [PubMed]
- Dziobek K, Biedka M, Nowikiewicz T, Szymankiewicz M, Lukaszewska E, et al. (2018) Analysis of Treg cell population in patients with breast cancer with respect to progesterone receptor status. Contemp Oncol (Pozn) 22: 236-239.
[CrossReff] [Google Scholar] [PubMed]
- Pascalau AV, Cheregi CD, Muresan MS, Sandor MI, Huniadi CA, et al. (2021) CD4+ CD25+ regulatory T-cells role in tumor microenvironment of the squamous cell carcinoma. Rom J Morphol Embryol 62: 249-253.
[CrossReff] [Google Scholar] [PubMed]
- Xiao K, Xiao K, Li K, Xue P, Zhu S (2021) Prognostic role of TIGIT expression in patients with solid tumors: A Meta-analysis. J Immunol Res 2021: 5440572.
[CrossReff], [Google Scholar], [PubMed]
- Chauvin JM, Zarour HM (2020) TIGIT in cancer immunotherapy. J Immunother Cancer 8: e000957.
- Chan TA, Yarchoan M, Jaffee E, Swanton C, Quezada SA, et al. (2019) Development of tumor mutation burden as an immunotherapy biomarker: Utility for the oncology clinic. Ann Oncol 30: 44-56.
[CrossReff] [Google Scholar] [PubMed]
- Sorokin M, Rabushko E, Efimov V, Poddubskaya E, Sekacheva M, et al. (2021) Experimental and meta-analytic validation of RNA sequencing signatures for predicting status of microsatellite instability. Front Mol Biosci 8: 737821.
[CrossReff] [Google Scholar] [PubMed]
Citation: Chen Y, Zhou Wb, Gong Y, Liu J, et al. (2022) Comprehensive Pan-cancer Analysis of 33 Human Cancers Reveals the Immunotherapy Value of FOXP3. J Oncol Res Treat S1:004. DOI: 10.4172/aot-7.S1-1000001
Copyright: © 2022 Chen Y, et al. This is an open-access article distributed under the terms of the Creative Commons Attribution License, which permits unrestricted use, distribution, and reproduction in any medium, provided the original author and source are credited.
Share This Article
Open Access Journals
Article Tools
Article Usage
- Total views: 1951
- [From(publication date): 0-2022 - Apr 05, 2025]
- Breakdown by view type
- HTML page views: 1483
- PDF downloads: 468

