Comprehensive Analysis Prediction Prognosis and Immune Therapy Value of Angiogenesis-Associated Genes in Kidney Renal Clear Cell Carcinoma
Received: 27-Dec-2023 / Manuscript No. cmb-23-123702 / Editor assigned: 30-Dec-2023 / PreQC No. cmb-23-123702 / Reviewed: 13-Jan-2024 / QC No. cmb-23-123702 / Revised: 20-Jan-2024 / Manuscript No. cmb-23-123702 / Published Date: 29-Jan-2024
Abstract
Background: Anti-angiogenic therapies and immunotherapy are pivotal treatment options for kidney renal clear cell carcinoma (KIRC). However, the role of angiogenesis-associated genes (AAGs) in tumorigenesis of renal cell carcinoma, their potential as prognostic markers, impact on the tumor microenvironment (TME), and response to immunotherapy remain elusive. Identifying promising prognostic indicators based on AAGs in KIRC may facilitate early detection of recurrence and inform treatment strategies.
Methods: We investigated the expression profiles of 36 angiogenesis-associated genes (AAGs) in patients with clear cell renal cell carcinoma (KIRC), including 536 tumor tissues and 72 adjacent non-tumor tissues obtained from The Cancer Genome Atlas (TCGA) database. Two distinct clusters were identified based on AAG expression patterns, and we comprehensively examined the correlation between angiogenesis and patient risk, overall survival, as well as immune cell proportion within the tumor microenvironment (TME). Subsequently, we evaluated the AAG scores within different clusters and validated their predictive ability for KIRC patients using a risk score model. Finally, we assessed the half maximal inhibitory concentration (IC50) values of twelve chemotherapy and targeted drugs across different AAG score groups.
Results: We observed that four differentially expressed genes (VEGFA, TIMP1, VCAN, and POSTN) were identified as hub genes. Survival analysis indicated that both the low AAG score and low-risk groups exhibited superior overall survival (OS). The high AAG score group showed higher TME scores compared to the low AAG score group. These two clusters encompassed a plethora of metabolism-associated pathways. Furthermore, when combined with the AAG_score, different tumor mutation burden (TMB) subgroups demonstrated that the low TMB+low-risk group had a greater OS. Additionally, there was a significant correlation between the AAG_score and susceptibility to chemotherapy and targeted drugs.
Conclusion: Our findings unveil the substantial predictive role of AAGs as a clinical prognostic signature in KIRC. The association between AAGs and TME holds promise for more potent combination therapy options for patients with KIRC.
Keywords
Kidney renal clear cell carcinoma; Angiogenesis; Bioinformatics; Prognosis; Immunotherapy
Introduction
Kidney cancer ranks 16th among malignant tumors, with KIRC accounting for 70-75% of all cases. Surgery is the primary treatment option for localized RCC; however, approximately 20-40% of patients experience distant metastasis or local recurrence after surgery. Another 30% of patients present with locally advanced metastasis at diagnosis and have a poor prognosis. KIRC is a complex disease characterized by inter-tumor and intra-tumor heterogeneity, which increases its clinical unpredictability and reduces sensitivity to conventional chemotherapy and radiotherapy. Recent genome-wide studies on RCC have confirmed its high molecular complexity. High genomic variability also contributes to treatment failure in patients with advanced renal cancer, including resistance to angiogenic drugs and their poor performance in clinical practice. Therefore, systemic treatments beyond radiotherapy and chemotherapy are necessary for managing advanced or metastatic renal cancer [1-5].
"KIRC is characterized by extensive vascularization, making it a highly vascularized tumor. In recent years, significant progress has been made in the treatment of metastatic RCC (mRCC) through the use of antiangiogenic drugs such as sunitinib, sorafenib, and bevacizumab [6]. These drugs have become the standard first-line treatment for KIRC. However, targeted therapy for advanced renal cell carcinoma still faces major limitations. Tumor resistance typically develops after approximately one year of targeted therapy, and its efficacy in highrisk groups remains uncertain. Therefore, there is an urgent need to identify a novel prognostic signature for patients with mRCC [7]."
KIRC is a highly immunogenic tumor. In recent years, the treatment strategy for metastatic renal cell carcinoma (mRCC) has shifted from molecular-targeted therapy to immune checkpoint inhibitor (ICI) therapy [8,9]. Inhibitors targeting programmed cell death-1 (PD-1), its ligand programmed cell death ligand-1 (PD-L1), and cytotoxic T-lymphocyte-associated protein 4 receptor (CTLA-4) have promising application prospects and demonstrate remarkable efficacy in mRCC treatment [10]. These inhibitors can further enhance patient prognosis after previous targeted therapy failure and effectively prolong survival time. However, the monotherapy effect of ICB is limited, with most patients eventually developing drug resistance [11- 14]. Therefore, overcoming resistance and identifying those who will benefit the most are urgent priorities. Biomarkers play a crucial role in predicting therapeutic effects. Abnormal angiogenesis is a fundamental process in tumors that involves overexpression of proangiogenic factors regulating vascular proliferation while disrupting the balance between proangiogenic and antiangiogenic processes. This disruption leads to abnormal blood vessel proliferation, ultimately creating an immunosuppressive microenvironment characterized by hypoxia and acidosis. Notably, VEGF promotes the generation of abnormal blood vessels, contributing to the formation of an immunosuppressive microenvironment [15-17] that facilitates immune escape and distant metastasis. In recent years, the treatment strategy for metastatic renal cell carcinoma (mRCC) has shifted from molecular-targeted therapy to immune checkpoint inhibitor (ICI) therapy. Inhibitors targeting programmed cell death-1 (PD-1), its ligand programmed cell death ligand-1 (PD-L1), and cytotoxic T-lymphocyte-associated protein 4 receptor (CTLA-4) have promising application prospects and demonstrate remarkable efficacy in mRCC treatment [18,19]. These inhibitors can further enhance patient prognosis after previous targeted therapy failure and effectively prolong survival time. However, the monotherapy effect of ICB is limited, with most patients eventually developing drug resistance. Therefore, overcoming resistance and identifying those who will benefit the most are urgent priorities. Biomarkers play a crucial role in predicting therapeutic effects. Abnormal angiogenesis is a fundamental process in tumors that involves overexpression of proangiogenic factors regulating vascular proliferation while disrupting the balance between proangiogenic and antiangiogenic processes. This disruption leads to abnormal blood vessel proliferation, ultimately creating an immunosuppressive microenvironment characterized by hypoxia and acidosis. Notably, VEGF promotes the generation of abnormal blood vessels, contributing to the formation of an immunosuppressive microenvironment [20-22] that facilitates immune escape and distant metastasis. Antiangiogenic drugs have the potential to normalize tumor blood vessels and alleviate the immunosuppressive state. When combined with ICIs, these drugs can enhance the immune microenvironment, facilitate vascular remodelling, and augment infiltration of immune effector cells, thereby further enhancing antitumor efficacy. Numerous studies have demonstrated that compared to monotherapy, the combination of antiangiogenic therapy and ICIs significantly improves therapeutic outcomes in tumors, making it an appealing strategy for clinical applications [23,24]. However, despite certain indicators such as PDL1 expression level, tumor mutation load, mismatch repair protein status, microsatellite instability, and tumor-infiltrating lymphocytes having some predictive significance for treatment response; more precise biomarkers are still required to identify potential beneficiaries [25]. Previous reports have suggested that AAGs serve as prognostic markers and predictors of treatment response [26]. Nevertheless, their expression patterns and clinical value in solid tumors remain unclear. The objective of this study was to investigate the association between AAG expression and clinicopathological features, prognosis, tumor microenvironment (TME), and sensitivity to anti-angiogenic treatment therapy in KIRC samples, aiming to provide a novel theoretical foundation and potential biological targets for the prevention and treatment of KIRC.
Materials and Methods
Patients and samples
Transcriptome RNA-seq data of 608 KIRC patients (72 in the normal group and 536 in the tumor group) were downloaded from The Cancer Genome Atlas (TCGA) (http://cancergenome.nih.gov/ publications/publicationguidelines). The project ID was TCGAKIRC. This study included patients with complete clinical data and pathologically confirmed clear cell carcinoma of the kidney. Patients with other types of renal cancer with incomplete clinical data were excluded. Thirty-six AAGs were obtained from the MSigDB Team (Hallmark Gene Set), Patient data are shown in Supplementary Figure S1, Supplemental Digital Content.
Analysis of AAG clusters based on angiogenesis scores
The Consensus Cluster Plus package in R was used to perform K-means clustering on 536 KIRC tumor samples based on the expression profiles of 36 AAGs. Two AAG clusters were obtained after 1000 iterations. The R GSVA package was used to the analyze the biological functions of AAG using KEGG gene sets (c2. Cp. KEGG. 7.5.1. Symbols. GMT).
Association of the AAG clusters with clinical features and prognosis of KIRC
Clinical data included age, sex, T stage, and N stage. OS of AAG clusters was analyzed by Kaplan‒Meier, and survival curves were drawn by R’s “Survival” and “Survminer” packages.
Correlation between the AAG cluster and the TME
The CIBERSORT method was used to analyze immune cell infiltration in patients with KIRC, and the role of immune infiltrating cells in different AAG clusters was preliminarily explored. Immune, Stromal and Estimate scores were generated using the Estimate package loaded in R language (version 4.0). We then analyzed the expression of the PD-1, PD-L1, and CTLA-4 genes in the two AAG cluster samples.
Generation of DEGs and functional and pathway enrichment analysis
Gene expression was analyzed using the limma package in R and different expression genes (DEGs) were generated by comparing the two AAG clusters. After log2 (high/low AAG cluster) transformation, DEGs with fold change>1 and false discovery rate (FDR) < 0.05 were considered statistically significant and functional and pathway enrichment analyses were performed using R’s cluster Profiler package and mapping of the identified DEGs.
Associations between DEG clustering and clinical features and prognosis
The Consensus Cluster Plus package in R was used to perform K-means clustering on 613 DEGs in 536 KIRC samples, and two gene clusters were obtained after 1000 iterations. The overall survival among different gene clusters was analyzed by Kaplan‒Meier, and survival curves were plotted by R’s “Survival” and “Survminer” packages. At the same time, the clinical characteristics of the gene clusters were compared. We also studied differences in the expression s of 36 AAGs in different gene clusters.
Assessing the AAG_score and constructing the risk assessment model
We randomly divided the 536 KIRC tumor samples into a training set (268 samples) and a test set (268 samples). Univariate Cox regression analysis was performed to identify prognostic genes in the training set, which were further selected using the LASSO Cox regression analysis. The corresponding coefficients were obtained using multi-Cox regression. The final AAG score was calculated as follows: (βm RNA1×expression of mRNA1)+(βm RNA2×expression of mRNA2)+⋯+ (βm RNAn×expression of m RNAn). The R package (survival and survminer) was used to determine the best cutoff value to divide the samples into different risk groups.
Evaluation of the prognostic and classification effect of the AAG score
To further evaluate the prognostic effect of the AAG_score, we performed validation in the test dataset and confirmed whether the AAG_ score was significantly different between the AAG and gene clusters. At the same time, R’s MAf Tools package was used to analyze differences between the TMB, MSI, CSC Score, and the two risk groups in the MAF format.
Construction and validation of a nomogram for predicting survival outcomes
A nomogram was established using R packages, such as survival and rms to demonstrate the prognostic effect of different clinical characteristics including age, sex, T stage, N stage, and risk group. Survival analysis was used to compare the OS of KIRC patients in the high-and low-risk groups, and receiver operating characteristic (ROC) curves were used to investigate the accuracy of the model prediction.
Predicting immunotherapy response in different risk score groups
We used the tumor immune dysfunction and exclusion (TIDE) algorithm and immunophenotype score (IPS) in patients with KIRC to predict the immune response of the risk score. To predict chemotherapy and target therapy responsiveness in the different risk score groups, we assessed the semi-inhibitory concentration (IC50) value of KIRC samples against chemotherapy and target therapy drugs using the pRRophetic package in R.
Statistical analysiss
R software (version 4.1.10) and its relevant packages are applied to process, analyze and present the data. A two-sided P <0.05 was deemed valuable. p<0.0001****,p<0.001***,p<0.01**,p<0.05 *,p>0.05 ns(not significant).
Results
Identifying DEGs, genetic and CNV mutations of AAGs in patients with KIRC
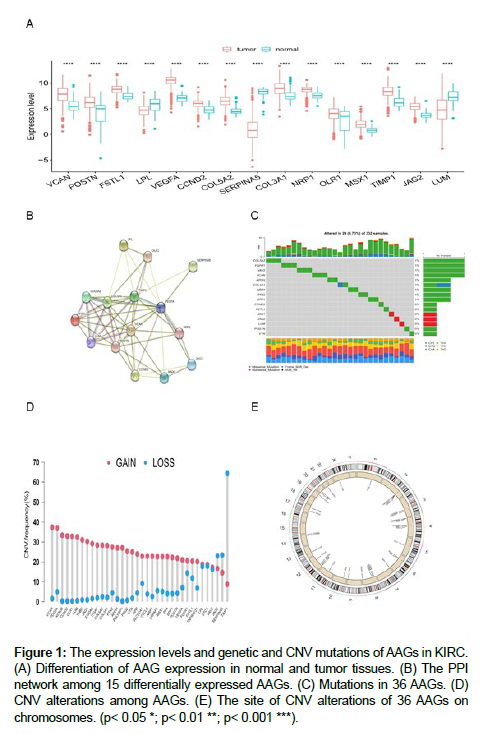
First, we investigated the expression of 36 AAGs in KIRC and normal tissues, and identified 15 DEGs (Figure 1A). Interestingly, we found that most DEGs were upregulated in KIRC. After constructing the PPI network of DEGs using the STRING (https://cn.string-db. org/) website, four hub genes (VEGFA, TIMP1, VCAN, and POSTN) were obtained from cross analysis (Figure 1B). Next, we analyzed the mutations and copy number variants (CNVs) in 36 AAGs. Mutations were found in 16 of the 36 (44.44%) AAG gene present in 29 (8.73%) KIRC samples (Figure 1C). TEMP1, SERPINA5, and JAG2 had the highest numbers of mutations. Figure 1D and 1E show CNV alterations in the 36 AAGs and alteration positions of 36 AAGs on chromosomes.
Figure 1: The expression levels and genetic and CNV mutations of AAGs in KIRC. (A) Differentiation of AAG expression in normal and tumor tissues. (B) The PPI network among 15 differentially expressed AAGs. (C) Mutations in 36 AAGs. (D) CNV alterations among AAGs. (E) The site of CNV alterations of 36 AAGs on chromosomes. (p< 0.05 *; p< 0.01 **; p< 0.001 ***).
Clustering KIRC samples
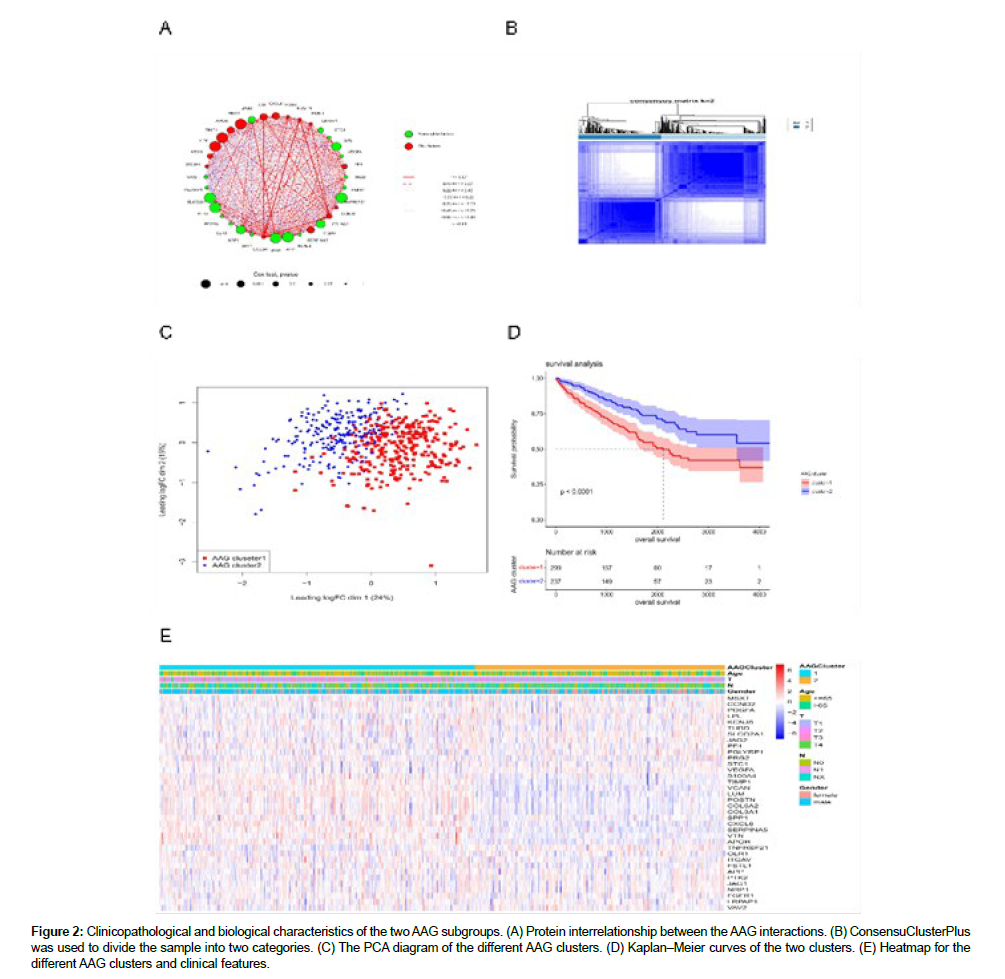
The clinical information of the 536 patients with KIRC (Figure S2) was explored in this study. The results of the univariate Cox regression analysis of the 36 AAGs are shown in Figure S3. The correlation networks among the 36 AAG interactions, as well as their prognostic relationship with KIRC samples, are displayed in Figure 2A. A total of 536 KIRC samples were divided into two clusters (299 samples in Cluster 1 and 237 samples in Cluster 2) (Figure 2B). The principle component analysis (PCA) diagram confirmed that the two clusters were well separated (Figure 2C). The OS time showed significant differences in the survival of samples from the two clusters (Figure 2D). The differential expression and clinicopathological characteristics of AAGs in the two clusters are shown in Figure 2E.
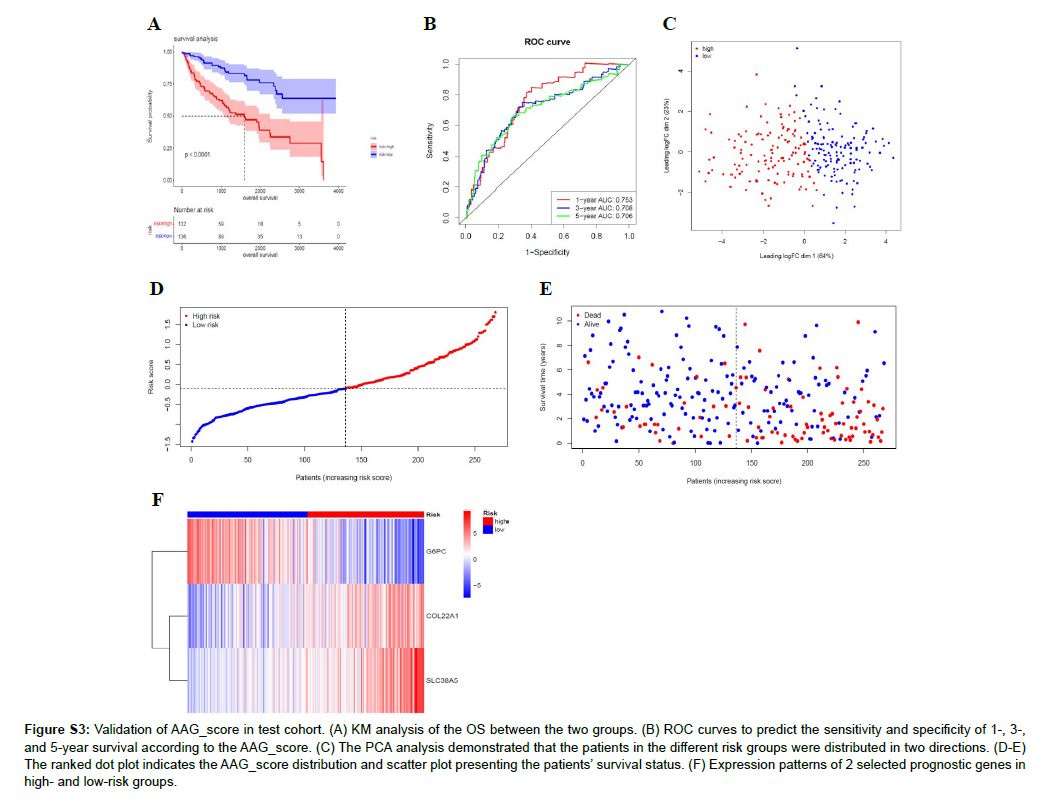
Figure S3: Validation of AAG_score in test cohort. (A) KM analysis of the OS between the two groups. (B) ROC curves to predict the sensitivity and specificity of 1-, 3-, and 5-year survival according to the AAG_score. (C) The PCA analysis demonstrated that the patients in the different risk groups were distributed in two directions. (D-E) The ranked dot plot indicates the AAG_score distribution and scatter plot presenting the patients’ survival status. (F) Expression patterns of 2 selected prognostic genes in high- and low-risk groups.
Figure 2: Clinicopathological and biological characteristics of the two AAG subgroups. (A) Protein interrelationship between the AAG interactions. (B) ConsensuClusterPlus was used to divide the sample into two categories. (C) The PCA diagram of the different AAG clusters. (D) Kaplan‒Meier curves of the two clusters. (E) Heatmap for the different AAG clusters and clinical features.
Role of AAGs in the TME
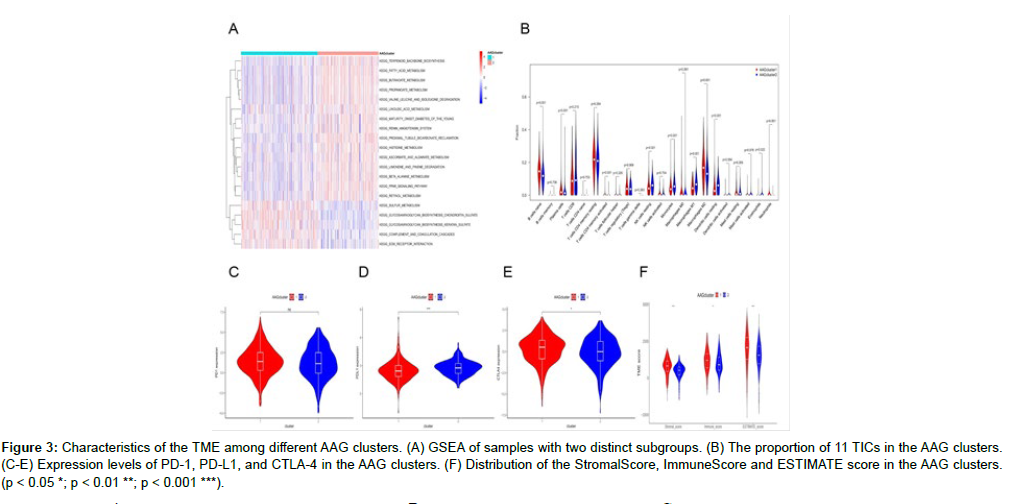
GSEA software was used to analyze the different AAG clusters. The results indicated that Cluster 1 was significantly enriched in mucopolysaccharide biosynthesis, sulfur metabolism and other biological pathways. Alanic acid, retinol, and other metabolic pathways were mainly enriched in cluster 2 (Figure 3A and Figure S4). Both clusters were metabolically associated pathways. To further confirm the correlation between AAG expression and the TME, we analyzed the proportion of 22 immune cells between the two clusters (Figure S5). The results of differential analysis showed that a total of 11 immune cells were associated with the expression of AAGs (Figure 3B), indicating that AAGs may be a potential marker of the immune status of the TME. Figure 3C-E displays the expression of three important immune checkpoint (ICP) genes (PD-1, PD-L1, and CTLA-4) in the two AAG clusters. As shown in the figure, there were significant differences in the expression of PD-L1 and CTLA4 genes in the two AAG clusters. A higher ImmuneScore or StromalScore indicated more immune or stromal components in the TME. The ESTIMATE score is the sum of the ImmuneScore and StromalScore and indicates the comprehensive proportion of the two components in the TME. These scores were significantly different between the two AAG clusters, and the patients in cluster 1 had higher TME scores (Figure 3F). These results suggest that the ratio of immune to stromal components is related to angiogenesis progression.
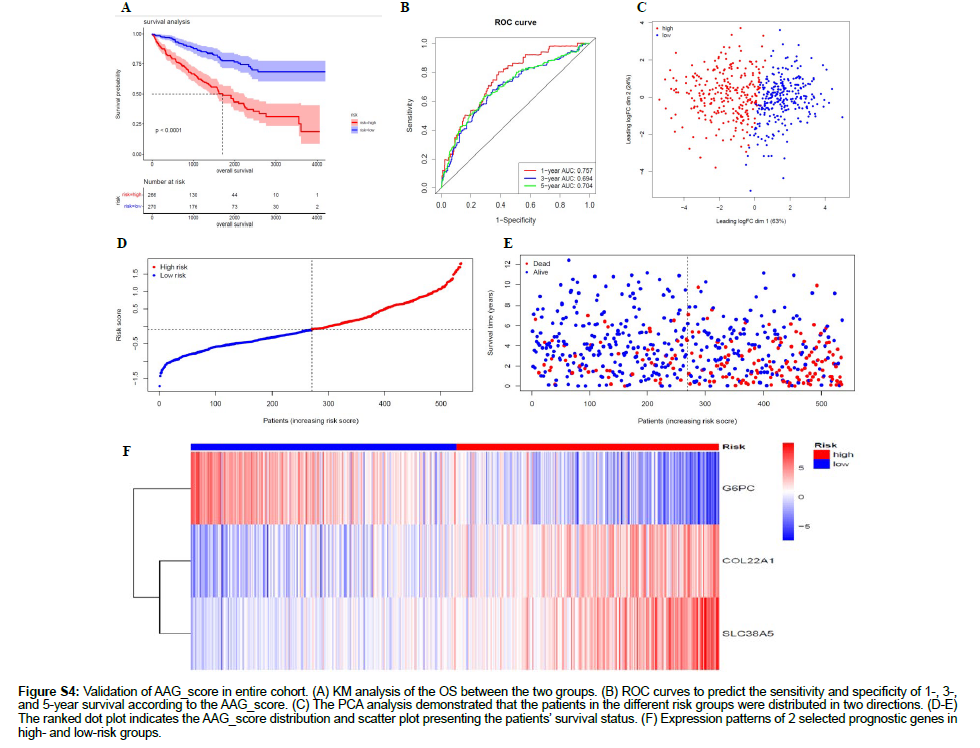
Figure S4: Validation of AAG_score in entire cohort. (A) KM analysis of the OS between the two groups. (B) ROC curves to predict the sensitivity and specificity of 1-, 3-, and 5-year survival according to the AAG_score. (C) The PCA analysis demonstrated that the patients in the different risk groups were distributed in two directions. (D-E) The ranked dot plot indicates the AAG_score distribution and scatter plot presenting the patients’ survival status. (F) Expression patterns of 2 selected prognostic genes in high- and low-risk groups.
Figure 3: Characteristics of the TME among different AAG clusters. (A) GSEA of samples with two distinct subgroups. (B) The proportion of 11 TICs in the AAG clusters. (C-E) Expression levels of PD-1, PD-L1, and CTLA-4 in the AAG clusters. (F) Distribution of the StromalScore, ImmuneScore and ESTIMATE score in the AAG clusters. (p < 0.05 *; p < 0.01 **; p < 0.001 ***).
Gene clusters were identified based on DEGs between the two AAG clusters
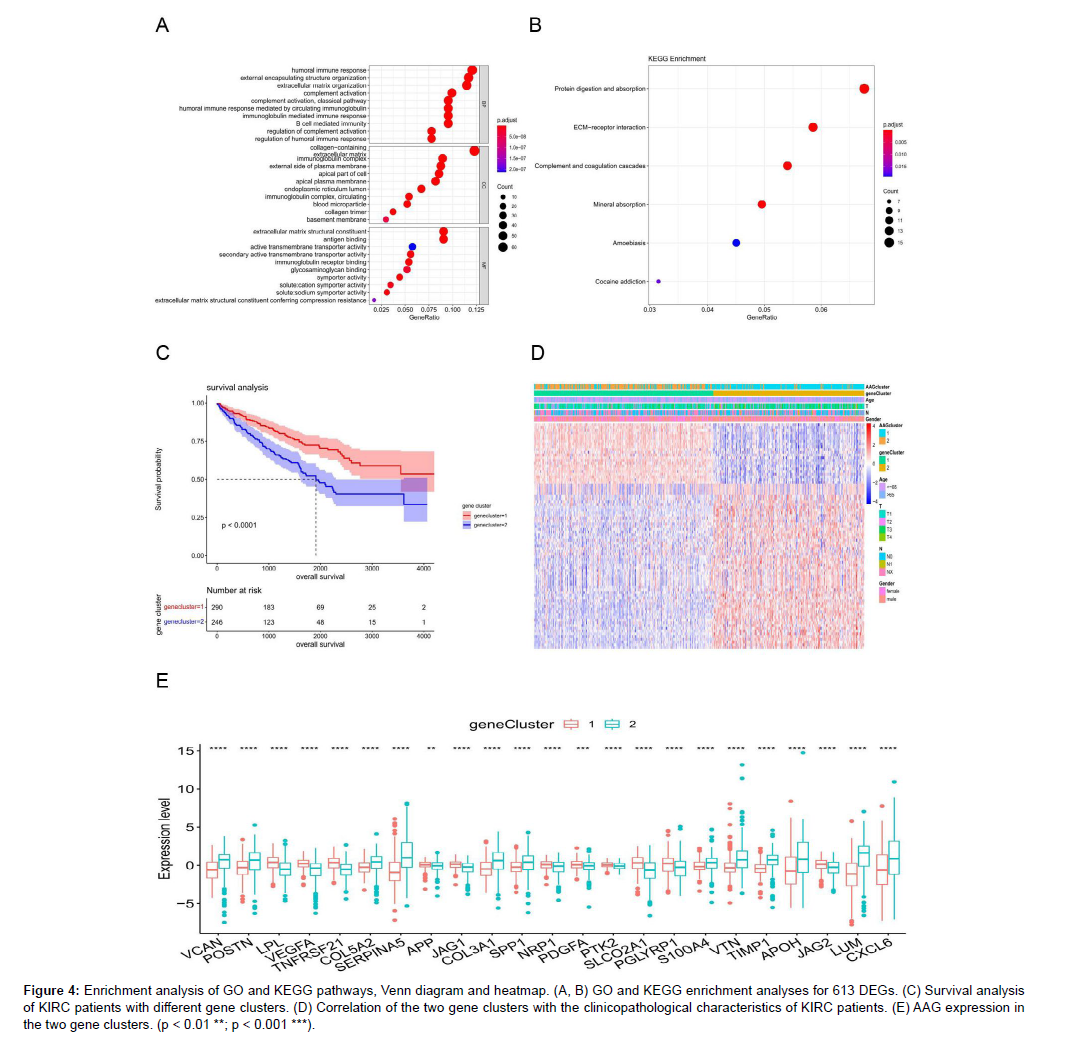
We identified 613 differentially expressed genes (DEGs) between the two AAG clusters. The enrichment analysis results of GO and KEGG are listed in Figures S6 and S7, respectively DEGs were mainly enriched in some immune-related GO items (Figure 4A). KEGG enrichment analysis showed that the differentially expressed genes were involved in mineral absorption, protein digestion, and absorptionrelated pathways (Figure 4B). These results suggested that angiogenesis is highly related to tumor immunity and metabolism, and we further selected 82 genes from 613 DEGs to satisfy | logFC | > 2 and FDR < 0.05. We clustered 536 KIRC samples and obtained two gene clusters, with 290 samples in Gene Cluster 1 and 246 samples in Gene Cluster 2. The OS of patients with Gene Cluster 1 was significantly lower than that of patients with Gene Cluster 2 (Figure 4C), suggesting that Gene Cluster 1 is not conducive to the prognosis of patients with KIRC. Figure 4D displays the Gene Cluster correlation with the clinicopathological staging characteristics of patients with KIRC and indicates that gene cluster 2 was related to T classification. Twenty-three of the 36 AAG genes were significantly different between the two gene clusters (Figure 4E).
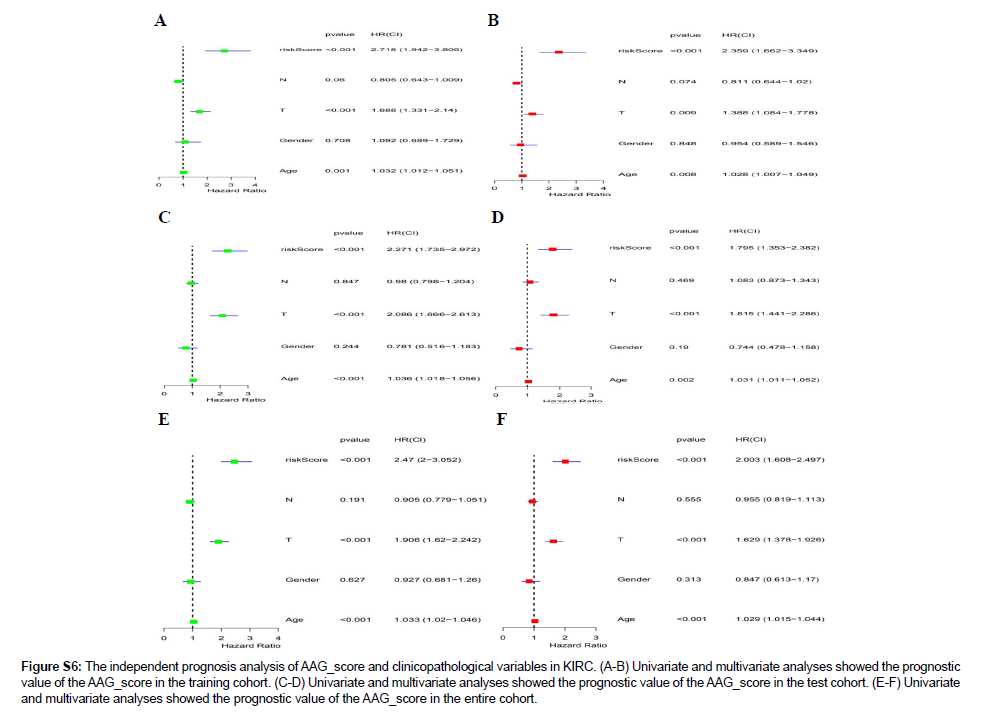
Figure S6: The independent prognosis analysis of AAG_score and clinicopathological variables in KIRC. (A-B) Univariate and multivariate analyses showed the prognostic value of the AAG_score in the training cohort. (C-D) Univariate and multivariate analyses showed the prognostic value of the AAG_score in the test cohort. (E-F) Univariate and multivariate analyses showed the prognostic value of the AAG_score in the entire cohort.
Figure 4: Enrichment analysis of GO and KEGG pathways, Venn diagram and heatmap. (A, B) GO and KEGG enrichment analyses for 613 DEGs. (C) Survival analysis of KIRC patients with different gene clusters. (D) Correlation of the two gene clusters with the clinicopathological characteristics of KIRC patients. (E) AAG expression in the two gene clusters. (p < 0.01 **; p < 0.001 ***).
The establishment and application of a nomogram model based on the AAG score for the prognosis of KIRC
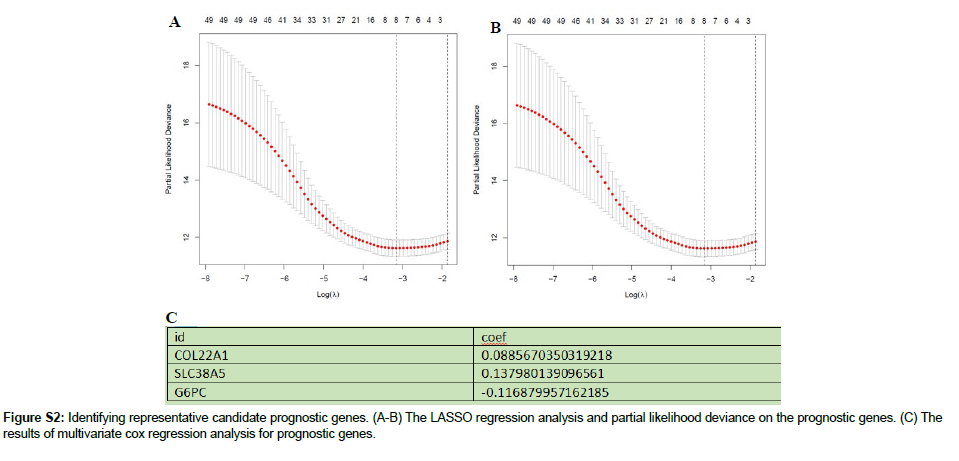
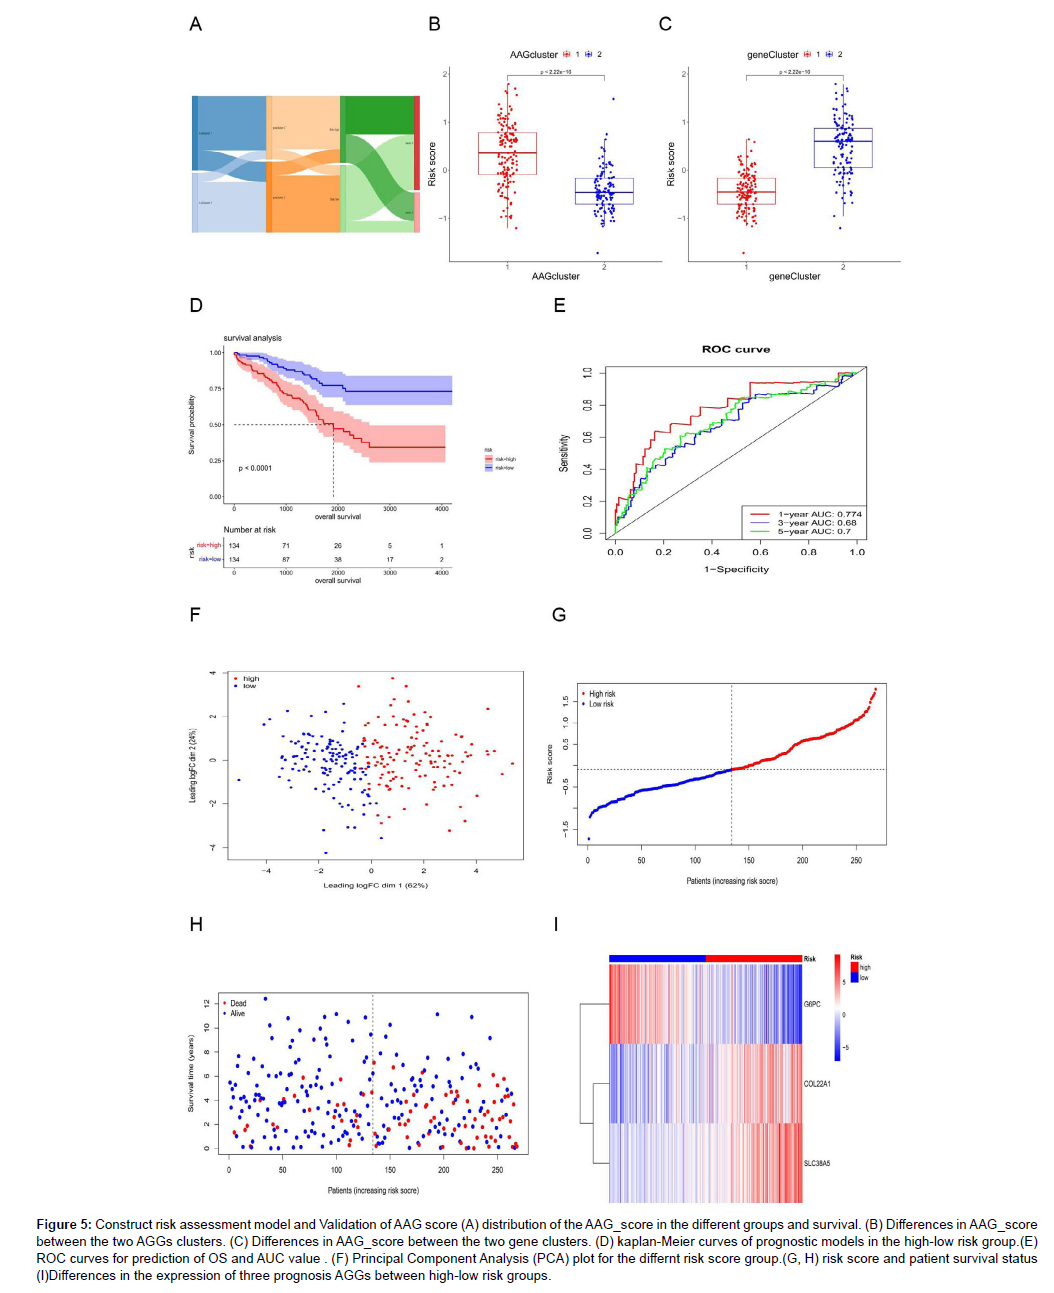
We randomly assigned 536 KIRC samples to the training and test cohorts, with 268 samples in each group at a ratio of 1: 1. Univariate Cox regression (UniCox) was performed for 82 DEGs in the training set. Significant genes were analyzed by Least absolute shrinkage and selection operator (LASSO) regression to determine the optimal gene set Using LASSO Cox regression model coefficients (β), and linear combinations of regression coefficients were obtained to the AAG score as follows: AAG_score=(0.089×expression of COL22A1)+(0.1380×expression of SLC38A5)+(0.116×expression of G6PC). Figure S2 shows the details of this model. As shown in Figure 5A, AAG Cluster 1 roughly corresponded to Gene Cluster 2, which was a high-risk group divided by the AAG score of 218 samples in the training set. We found that AAG_score was significantly different between the two AAG clusters (Figure 5B) and between the two gene clusters (Figure 5C). Survival analysis revealed that the OS of the highrisk group was significantly shorter than that of the low-risk group (Figure 5D). ROC analysis showed that the AUC of survival was 0.774 for 1-year survival, 0.68 for 2-year survival, and 0.7 for 3-year survival was predicted by the AAG score (Figure 5E). PCA revealed that the high-risk group could be clearly distinguished from the lowrisk group (Figure 5F). The risk plot of the AAG_score indicated that as the risk score increased, the survival time decreased and mortality increased (Figure 5G-H). A heatmap of the expression of these three genes is shown in Figure 5I. The expression levels of these three genes were significantly different between the two risk groups. To evaluate the reliability of the model, we validated it on the training and test sets (Figure S3 and S4). We also performed survival analysis and PCA to predict 1-year, 3-year and 5-year survival rates. It can be seen from the results that the AAG_score has a good AUC value. Indicated a good prognostic effect for both datasets.
Figure 5: Construct risk assessment model and Validation of AAG score (A) distribution of the AAG_score in the different groups and survival. (B) Differences in AAG_score between the two AGGs clusters. (C) Differences in AAG_score between the two gene clusters. (D) kaplan-Meier curves of prognostic models in the high-low risk group.(E) ROC curves for prediction of OS and AUC value . (F) Principal Component Analysis (PCA) plot for the differnt risk score group.(G, H) risk score and patient survival status (I)Differences in the expression of three prognosis AGGs between high-low risk groups.
Establishment of a predictive nomogram including the risk score
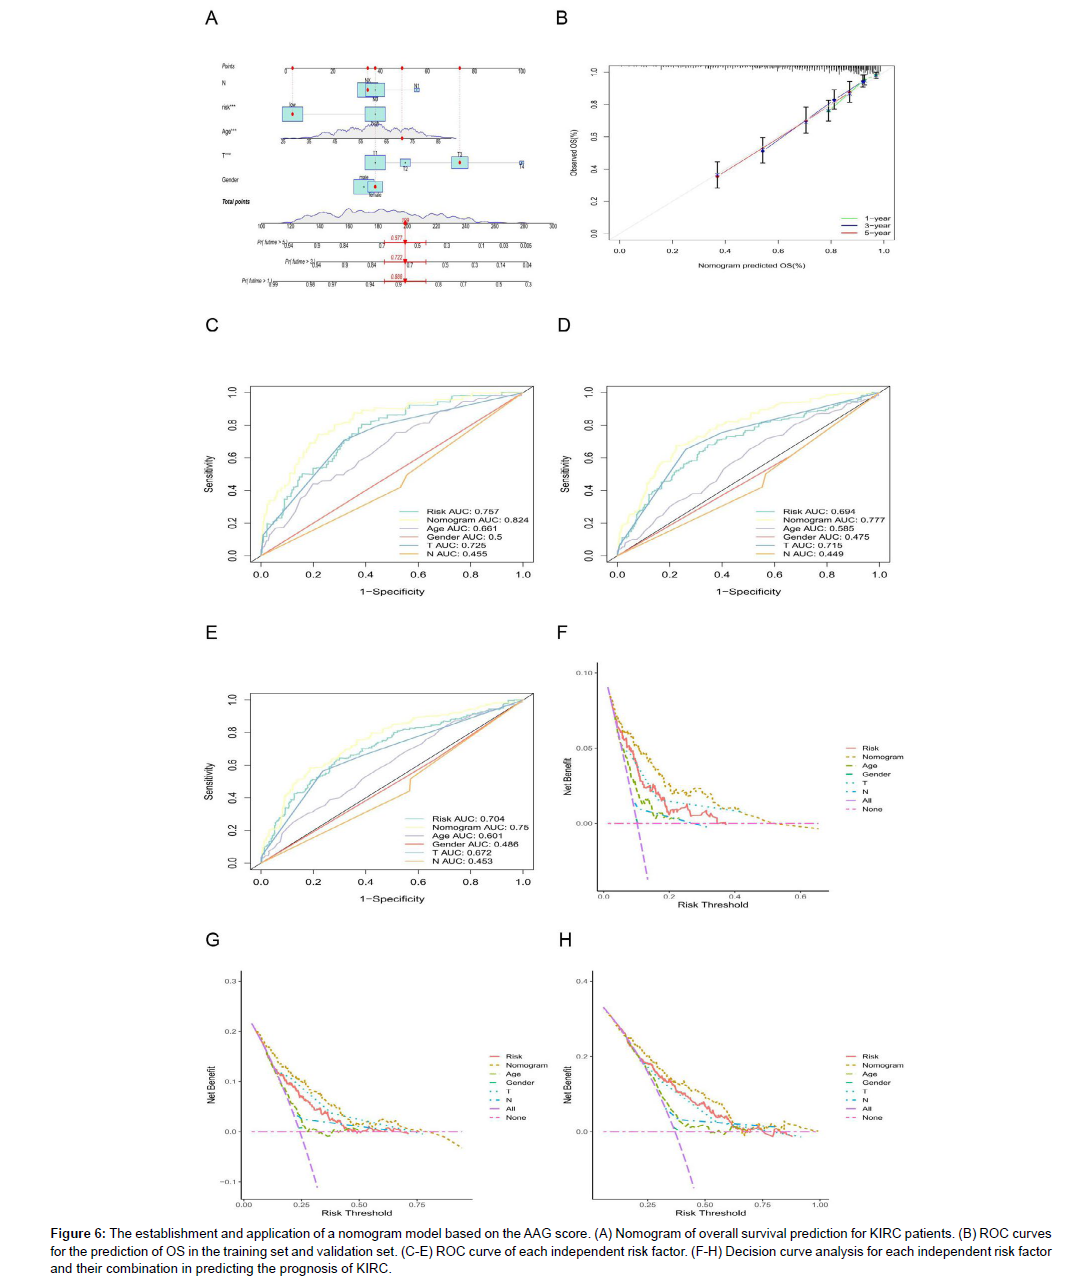
In this study, we established a nomogram prediction model based on clinical characteristics and risk factors (Figure 6A). The calibration curves for the prediction of OS in the model and validation sets showed a high agreement (Figure 6B). In addition, we used the AUC values of clinical features to predict OS (1, 2, and 3 years) (Figure 6C-E), and the results indicated that the nomogram had the best prognostic performance (the AUC was higher than that of other clinical features). The nomogram comprehensively considers all clinical factors and AAG scores mentioned above. We also found that the more nomogram factors included in the prognostic model, the greater the net benefits the model would have compared to each factor alone (Figures 6F-H).
Figure 6: The establishment and application of a nomogram model based on the AAG score. (A) Nomogram of overall survival prediction for KIRC patients. (B) ROC curves for the prediction of OS in the training set and validation set. (C-E) ROC curve of each independent risk factor. (F-H) Decision curve analysis for each independent risk factor and their combination in predicting the prognosis of KIRC.
Correlation of the AAG score with the immune infiltration level
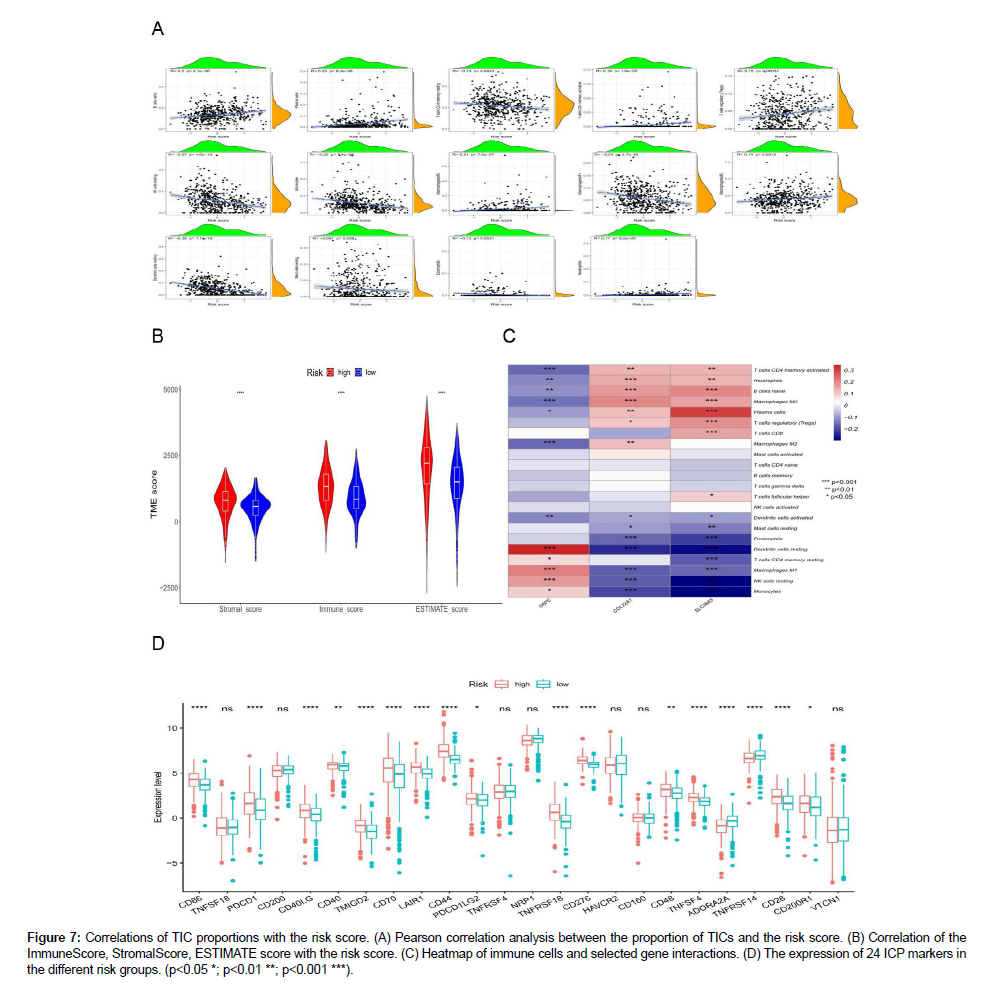
As depicted in Figure 7A, the scatter plot shows a correlation between the 14 tumor-infiltrating immune cells (TICs) ratios and the AAG score. The infiltration levels of naive B cells, plasma cells, activated memory CD4 T cells, and regulatory T cells (Tregs) were positively correlated with AAG expression, whereas most of them,such as resting memory CD4+ T cells, resting NK cells, monocytes, M1 macrophages, resting dendritic cells, resting mast cells and eosinophils, were significantly negatively correlated with KIRC. These results further confirmed that the level of AAGs affects the Immune activity of the TME and AAGs may be potential markers of the immune status of TME. We also found that the high AAGscore group had the highest StromalScore, ImmuneScore, and ESTIMATE scores (Figure 7B), indicating that AAGs play a substantial role in regulating the TME status during KIRC progression. In our model, most immune cells were significantly correlated with three genes (G6PC, COL22A1, and SLC38A5) (Figure 7C). Finally, we assessed the expression differences of 24 immune checkpoint (ICP)-related genes in the different risk groups and found that most genes significant differences (Figure 7D).
Figure 7: Correlations of TIC proportions with the risk score. (A) Pearson correlation analysis between the proportion of TICs and the risk score. (B) Correlation of the ImmuneScore, StromalScore, ESTIMATE score with the risk score. (C) Heatmap of immune cells and selected gene interactions. (D) The expression of 24 ICP markers in the different risk groups. (p<0.05 *; p<0.01 **; p<0.001 ***).
TMB, MSI, and CSC scores in the different risk score groups
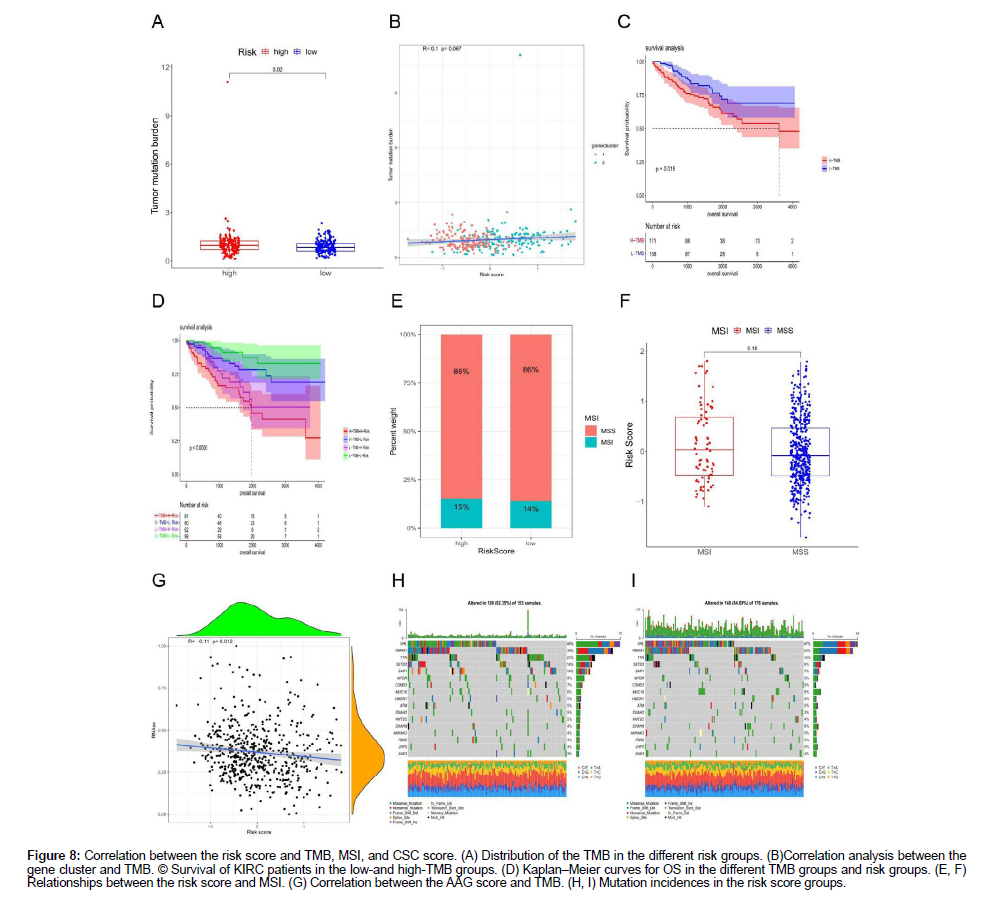
Our study demonstrated that the high-risk group had higher TMB than the low-risk group (Figure 8A). However, the positive correlation between the AAG score and TMB was not significant (Figure 8B). Median TMB value in KIRC sample was used as a cutoff to divide the KIRC sample into H-TMB and L-TMB groups, and survival analysis found that the OS of the low-TMB group was higher than that of the high-TMB group (Figure 8C). Furthermore, by combining the AAG_ score and TMB, we divided the samples into four groups, and performed a survival analysis indicated that the OS of the L-TMB+Lrisk group was superior to that of the H-TMB+H-risk group (Figure 8D). No correlation was found between AAG_score and microsatellite instability (MSI) status in the KIRC samples (Figure 8E-F), which may explain why renal cancer was not significantly related to MSI. In general, there is a high correlation between MSI and colorectal, breast, and gastric cancers. Figure 8G displays the correlation between the AAG score and tumor xerogenesis. There was a significant negative correlation between AAG_score and cancer stem cells (CSCs), indicating that renal cancer cells with a lower AAG_score further promote self-renewal and vasculogenic mimicry formation. Finally, we studied the distribution of somatic mutations in the two risk groups (Figure 8H-I). The highest number of mutations in VHL, PBRM1, TTN and SETD2 was found in the two groups, among which VHL and PBRM1 had more mutations in the low-risk group.
Figure 8: Correlation between the risk score and TMB, MSI, and CSC score. (A) Distribution of the TMB in the different risk groups. (B)Correlation analysis between the gene cluster and TMB. © Survival of KIRC patients in the low-and high-TMB groups. (D) Kaplan‒Meier curves for OS in the different TMB groups and risk groups. (E, F) Relationships between the risk score and MSI. (G) Correlation between the AAG score and TMB. (H, I) Mutation incidences in the risk score groups.
Drug sensitivity analysis
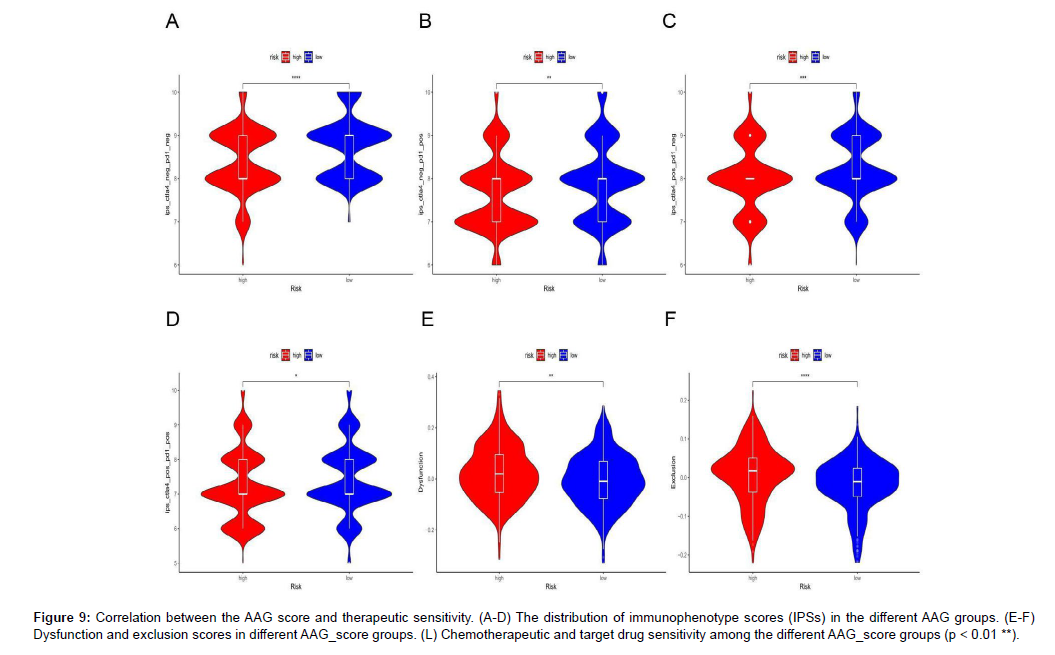
The distribution of different immunophenotype scores (IPSs) in the different risk groups is displayed in Figure 9A-D, and the results indicated that the IPSs in the low-risk group were higher than those in the high-risk group, indicating that patients in the low-risk group were more likely to be treated with anti-immune checkpoint therapy. The distribution of TIDE scores in the high-and low-risk groups is displayed in Figure 9E-F. The high-risk group had higher dysfunction and exclusion scores than the low-risk group did. Finally, we predicted the IC50 value of KIRC samples for 138 drugs to compare the sensitivity of different risk groups to these drugs (Figure 9G-L).
Figure 9: Correlation between the AAG score and therapeutic sensitivity. (A-D) The distribution of immunophenotype scores (IPSs) in the different AAG groups. (E-F) Dysfunction and exclusion scores in different AAG_score groups. (L) Chemotherapeutic and target drug sensitivity among the different AAG_score groups (p < 0.01 **).
The results indicated that sensitivity to most chemotherapy drugs, including docetaxel, gefitinib, gemcitabine, and paclitaxel, and targeted therapy drugs, including pazopanib, sunitinib, nilotinib, vorinostat, temsirolimus, bosutinib and tipifarnib, were superior in patients with high AAG scores.
Discussion
Angiogenesis is a critical process in the progression of malignant tumors and is one of the hallmarks of cancer development. Under normal physiological conditions, when an organism is mature, the vascular system remains in a stationary phase for a long time. As tumors continue to grow, the demand for oxygen and nutrients gradually increases, and angiogenesis satisfies the metabolic demands of tumor cells. Several independent research groups have found that angiogenesis is significantly upregulated in most cancers. Dhar et al. [27] found that angiogenesis was significantly increased in differentiated thyroid carcinoma and that DFS was significantly shorter (P<0.05) in patients with hyper vascular tumors. Mohammed et al [28] indicated that a high level of angiogenesis is closely related to the metastasis and recurrence of colorectal cancer, as well as a high mortality. Those evidence demonstrates that angiogenesis is correlated with tumor growth and progression. As a solid tumor, high vascularization is one of the most marked characteristics of KIRC, and with the development of KIRC, the expression of VEGF and PDGF increases [29]. Therefore the inhibition of angiogenesis has proven to be an effective and promising treatment option for advanced KIRC. This evidence has demonstrated that angiogenesis is correlated with tumor development and therapy. At present, the study of AAGs has become a research hotspot because of its important significance in the treatment and prognosis of many tumors, which has attracted the attention of many researchers. However, these studies were limited to single AAGs, and the holistic impact of AAGs on KIRC remains unknown. Therefore, it is necessary to explore the integral controlled action of AAGs in KIRC.
In our research, we studied the transcriptional expression, mutations and CNV alterations in AAGs. We obtained 15 differentially expressed AAGs, and most DEGs were upregulated in KIRC. Evident of CNV alterations and the highest mutation incidence of AAGs imply that, as oncogenes, these genes drive the evolution of tumorigenesis, and the TCGA_KIRC dataset was divided into AAG Cluster 1 and AAG Cluster 2. Comparing the OS between the two subgroups, Kaplan‒Meier analysis results showed that the OS of patients with low AAGs_scores was better than that of patients with high AAGs_scores, and a high AAG_score was associated with poor prognosis, indicating that AAG_scores had a superior predictive performance. The GSEA findings demonstrated a close relationship between AAGs and metabolism-associated pathways. As a metabolic disease, mutations in key genes involved in the development of KIRC, such as VHL and MET, are closely related to metabolic pathways and reprogramming of metabolic networks. These results confirmed that AAGs can regulate the metabolism-related activities of RCC through different pathways.
Recent studies have confirmed the promising efficacy of ICIs in the treatment of KIRC. However, only some patients benefit from ICIs. One of the reasons may be the existence of an immunosuppressive tumor microenvironment (TME) in RCC. Studies have shown that the TME in KIRC is widespread compared with that in other solid tumors. Such abnormal pathologic vessel formation in the tumor with flexion, disorder, and high leakage can create an immunosuppressive state of hypoxia, acidosis and elevated interstitial pressure in the TME [30]. Evidence indicates that pro-angiogenic factors are involved in immunosuppressive activity [31], and inhibition of abnormal blood vessel formation can reverse this immunosuppressive state and enhance the efficacy of immunotherapy. Immunoinvasiveness and highly vascularized characteristics, which are the basis for immunotherapy in RCC, also have a substantial impact on the treatment response of patients through complex effects. Therefore, our study further explored the relationship between AAGs and the TME and aimed to provide a theoretical basis for the combination of immunotherapy and targeted therapy. CTLA4, PD-1 and its death-ligand 1 (PD-L1), as targets of immune checkpoint inhibitors, have made breakthrough progress in the treatment of a variety of advanced tumors, bringing survival benefits to patients; however the clinical treatment response of different patients is variable. This study showed that the AAG score was not related to PD-1 expression in KIRC but was related to PD-L1 and CTLA4 expression. The results indicated that the TME is involved in many important biological processes and that the AAG_score can accurately predict the immunotherapeutic effect of KIRC. The ImmuneScore and StromalScore assessed using the ESTIMATE method can be used to predict tumor purity and describe the proportion of immune cells and stromal cells. Our study demonstrated that the high AAG_score group had higher immune and stromal Scores, suggesting that angiogenesis could be associated with immune cell infiltration and that the stromal cell content affected KIRC invasion and migration to a certain extent. The TME includes a large number of immune cells and can be further divided into killer cells, which are related to tumor killing, and immunosuppressive cells, which are related to tumor evasion from immune surveillance. Immunosuppressive cells include tumorassociated macrophages (TAMs), myeloid-derived suppressor cells (MDSCs) and regulatory T-cells (Tregs). Tregs also play an important role in tumor evasion by suppressing the activity of immune killer cells by secreting TGF-β and IL-10, and reducing the activation of effector T cells by downregulating the expression of dendritic cell costimulatory molecules. Tregs are also associated with poor survival [32]. This study demonstrated that patients with high AAG scores had abundant Tregs. In addition, the previous results showed that high AAGs were associated with poor survival, which is consistent with our findings. Therefore, the combination of antiangiogenesis and immunotherapy should theoretically have a synergistic antitumor effect. This study further investigated the relationship between the AAG score and response to immunotherapy and targeted therapy. An increased mutation rate is a distinctive feature of cancers. Accumulation of gene mutations leads to carcinogenesis. As TMB has gradually been developed as a biomarker for predicting ICI efficacy, numerous studies have described changes in TMB levels in different tumor types and histology. In a study by Chalmers et al. [33], TMB levels varied widely among tumors, with melanoma having the highest TMB levels, whereas leukemia and childhood tumors had the lowest TMB levels, and cancers such as breast and ovarian cancer showed moderate TMB levels. In previous studies, higher TMB levels were associated with poor outcomes in patients, and low TMB levels of may be better for the prognosis of patients [34- 40]. It is generally believed that immune infiltration caused by tumor antigens generated by tumor-specific mutations is a prerequisite for ICI function. The TMB of RCC was moderate to low. Many studies have indicated that TMB in RCC alone cannot be used as a predictor of ICI drug response [41,42]. Carcinogenesis, caused by gene mutations, is associated with angiogenesis. Therefore, exploring the correlation between the AAG score and gene mutations in RCC is helpful in revealing the mechanism of ICI therapy and evaluating its important efficacy value. Our results showed that patients with lower TMB have favorable outcomes. Although there was no significant difference, there was a positive association trend between the AAG score and TMB. We performed survival analysis of KIRC with the combined TMB and AAG scores and found that the low AAG score+low TMB group had better OS than the high AAG score+high TMB group, suggesting that the AAG score combined with TMB effectively predicts responsiveness to immunotherapy.
The extensive immune infiltration, bnormal vascularization and highly fibrotic TME in RCC provide the material basis for tumor cell proliferation and metastasis and limit the immune surveillance of tumor killer cells, finally leading to immunotherapy drug resistance. By reducing the permeability of tumor blood vessels to reduce vascular pressure, improve tissue hypoxia, induce vascular normalization and inhibit the formation of abnormal blood vessels, the state of immune suppression can be reversed [43] and the efficacy of immunotherapy is enhanced. In contrast, ICIs can activate CD4+T lymphocytes, CD8+T lymphocytes, and Th1 cells, which secrete antitumor cytokines, such as interferon γ (IFN-γ) and tumor necrosis factor (TNF), to regulate the immune microenvironment and play a role in anti-abnormal angiogenesis and the promotion of vascular normalization [44,45].At present, there is still a lack of effective predictors of ICI efficacy in KIRC. Most patients with KIRC either had no initial response to antiangiogenic therapy and ICIs (primary resistance) or were in relapse after a period of treatment (acquired resistance). Investigating the sensitivity of different AAG_score groups to chemotherapy and target drugs helps to identify biomarkers that could predict the response, so that it could be used only in patients who would benefit from it. The TIDE score showed that patients with low-AAG scores had low dysfunction and ESTIMATE scores and high IPSs, suggesting that patients with low-AAG scores could present better efficacy after ICI treatment, thus obtaining a greater survival benefit.
This study also has some limitations: (1) This study is a singlecenter retrospective study, and there is a certain selection bias in the study subjects, which may mean that the results are not universally applicable.(2)The sample size included in this study was not large enough. (3) This study lacks external verification and needs to be continuously improved in future clinical study. On the whole, as a clinical prognostic signature, AAGs exhibit a higher predictive accuracy and provide more comprehensive and useful suggestions for the development of personalized therapies for patients with KIRC.
Abbreviations
AAGs: Angiogenesis-associated Genes; TME: Tumor Microenvironment; TMB: Tumor Mutation Burden; OS: Overall Survival; ICI: Immune Checkpoint Inhibitor; PD-L1: Ligands Programmed Cell Death Ligand-1; CTLA-4: Cytotoxic T-lymphocyteassociated protein 4 receptor; LASSO: LEAST Absolute Shrinkage and selection operator; DEGs: Different Expression Genes; ROC: Receiver Operating Characteristic; TIDE: Tumor Immune Dysfunction and Exclusion; IPS: Immunophenotype Score; IC50: Semi-inhibitory Concentration; CNVs: Copy Number Variants; PCA: Principle Component Analysis; AUC: Area Under the Curve; TICs: Tumorinfiltrating Immune Cells; MSI: Microsatellite Instability; CSCs:Cancer Stem Cells.
Data Availability
The datasets analyzed during the current study are available in The Cancer Genome Atlas (http://cancergenome.nih.gov) repository.
Founding
This work was supported by the Xin Jiang Natural Science Foundation (2018D03013).
Author Contributions
All the authors contributed to the study’s conception and design of the study. Abulaiti Maimaitiming collectef and analyzed the data. Xiaoyan Dong wrote this manuscript. Ruili Zhang and Ainiwaer Aimudula polished and revised the manuscript. All authors have commented on the previous versions of the manuscript and have read and approved the final manuscript.
Competing Interests
The authors declare no competing interests. The TCGA and GEO databases belong to public databases. Ethical approval was obtained from the patients involved in the database. Users can download relevant data free of research, and publish relevant articles. Our study was based on open-source data; therefore, there were no ethical issues.
References
- Rebecca L, Kimberly D, Ahmedin J (2020) Cancer statistics. CA Cancer J Clin. 70: 7-30.
- Eric J, Chery LW, Kimryn R (2021) clear cell renal cell carcinoma ontogen and mechanisms of lethality. Nat Rev Nephrol. 17: 245-261.
- Ahrens M, Hartmann A, Bergmann L (2020) what is new in the diagnosis and therapy of renal cell carcinoma? Dtsch Med Wochenschr. 145: 734-739.
- Zhou X, Hou W, Gao L, Shui L, Yi C, Zhu H (2020) Synergies of Antiangiogenic Therapy and Immune Checkpoint Blockade in Renal Cell Carcinoma: From Theoretical Background to ClinicalReality. Front Oncol. 10: 13-21.
- Jens B, Viktoria S, Arnulf S, Bernhard B (2018) Immunotherapy for kidney cancer: status quo and the future. Curr Opin Urol. 28: 8-14.
- Rosa G, Charles-HL, Gorka L, Javier-CA, Rafael P, et al (2018) High levels of intratumorheterogeneity characterize the expression of epithelial-mesenchymal transition markers in high-grade clear cell renal cell carcinoma. Ann Diagn Pathol 34: 27-30.
- Christopher JR, W Marston L (2018) Multi-regional Sequencing Elucidates the Evolution of Clear Cell Renal Cell Carcinoma. Cell 173: 540-542.
- Ricketts CJ, Linehan WM (2018) The origin, evolution and route to metastasis of clear cell RCC. Nat Rev Nephrol. 14: 538-540.
- Aly-Khan AL, Bradley-AM, Laurence A, Toni-KC, Robert M, et al (2019) Systemic Treatment of Metastatic Clear Cell Renal Cell Carcinoma in 2018: Current Paradigms, Use of Immun otherapy and Future Directions. Eur Urol. 75:100-110.
- Zoe G, Marie A, Yann V, Stephane O, Dominique H, et al (2022) Renal Carcinoma and Angiogenesis: Therapeutic Target and Biomarkers of Response in Current Therapies. Cancers (Basel) 14: 61-67.
- Takemura K, Yuasa T, Fujiwara R, Masaya I, Hiroaki S, et al (2020) Prognostic Significance of the Controlling Nutritional Status (CONUT) Score in Patients with Advanced Renal Cell Carcinoma Treated with Nivolumab after Failure of Prior Tyrosine Kinase Inhibitors. J Urology, 204: 1166-1172.
- Robert-JM, Thomas P, Michael-BA, Bernard E, David-FM, et al (2022) Final Overall Survival and Molecular Analysis in IMmotion151, a Phase 3 Trial Comparing Atezolizumab Plus Bevacizumab vs Sunitinib in Patients With Previously Untreated Metastatic Renal Cell Carcinoma. JAMA Oncol 8: 275-280.
- Bosma NA, Warkentin MT, Gan CL, Karim S, Heng DYC, et al (2022) Efficacy and Safety of First-line Systemic Therapy for Metastatic Renal Cell Carcinoma: A Systematic Review and Network Meta-analysis. Eur Urol Open Sci. 37: 14-26.
- Quhal F, Mori K, Bruchbacher A, Resch I, Mostafaei H, et al (2021) First-line Immunotherapy-based Combinations for Metastatic Renal Cell Carcinoma: A Systematic Review and Network Meta-analysis. Eur Urol Oncol. 4: 755-765.
- Lombardi P, Filetti M, Falcone R, Di Bidino R, Iacovelli R, et al (2022) New first-line immunotherapy-based combinations for metastatic renal cell carcinoma: A systematic review and network meta-analysis. Cancer Treat Rev. 106: 102-377.
- Rini BI, Atkins MB, Valerie HL, James JH (2020) The Efficacy of Lenvatinib Plus Everolimus in Patients with Metastatic Renal Cell Carcinoma Exhibiting Primary Resistance to Front-Line Targeted Therapy or Immunotherapy. Clin Genitourin Cancer 18: 252-257.
- Robert JM, Bernard E, Saby G, Hans JH, Sandhya S, et al (2020) Nivolumab versus everolimus in patients with advanced renal cell carcinoma: Updated results with long-term follow-up of the randomized, open-label phase 3 CheckMate 025 trial. Cancer 126: 4156-4167.
- David AB, Ziad B, Laure H, Ronan F, Eliezer MV, et al (2021) Beyond conventional immune-checkpoint inhibition - novel immunotherapies for renal cell carcinoma. Nat Rev Clin Oncol. 18: 199-214.
- David MG, Neeraj A (2017) Cancer immunotherapy: A paradigm shift in the treatment of advanced urologic cancers. Urol Oncol 35: 676-677.
- Shafqat A, Omer MH, Ahmed EN, Mushtaq A, Ijaz E, et al (2023) Reprogramming the immunosuppressive tumor microenvironment: exploiting angiogenesis and thrombosis to enhance immunotherapy. Front Immunol 14: 20-41.
- Augustin RC, Leone RD, Naing A, Fong L, Bao R, et al (2022) Next steps for clinical translation of adenosine pathway inhibition in cancer immunotherapy. J Immunother Cancer.10: 40-89.
- Noman MZ, Desantis G, Janji B (2014) PD-L1 is a novel direct target of HIF-1α, and its blockade under hypoxia enhanced MDSC-mediated T cell activation. J Exp Med 211: 781-790.
- Hegde PS, Wallin JJ, Mancao C (2018) Predictive markers of anti-VEGF and emerging role of angiogenesis inhibitors as immunotherapeutics. Semin Cancer Biol 52: 117-124.
- Ramjiawan RR, Griffioen AW, Duda DG (2017) Anti-angiogenesis for cancer revisited: Is there a role for combinations with immunotherapy. Angiogenesis 20: 185-204.
- Mizuki N, Nikhil HR, Hiroto H, Stephen H (2017) Monitoring immune checkpoint blockade: response evaluation and biomarker development[J]. Nat Rev Clin Oncol 14: 655-668.
- Qing X, Xu WJ, Liu SL, Zhencheng Chen ZC, Ye CP, et al (2022) Molecular Characteristics, Clinical Signifificance, and Cancer Immune Interactions of Angiogenesis Associated Genes in Gastric Cancer. Front Immunol 13: 43-77.
- Dhar DK, Kubota H, Kotoh T (1998) Tumor vascularity predicts recurrence in differentiated thyroid carcinoma. Am J Surg 176: 442-7.
- Mohammed AA, Arif SH, Pity IS (2020) P53 expression and micro-vessel density in relation with 5-year survival in patients with colorectal cancer. Ann Med Surg 57:311-4.
- Yongli S, Xu QY, Li Deng L, Zhu Y, Gao RX, et al (2022) System analysis of VEGFA in renal cell carcinoma: The expression, prognosis, gene regulation network and regulation targets. J Biol Marker 37: 90-101.
- Ramjiawan RR, Griffioen AW, Duda DG (2017) Anti-angiogenesis for cancer revisited: is there a role for combinations with immunotherapy. Angiogenesis 20: 185-204.
- Ren SJ, Xiong XX, You H, Shen JF, Zhou PH (2021) The combination of immune checkpoint blockade and angiog -enesis inhibitors in the treatment of advanced non-small cell lung cancer. Front Immunol 12: 89-132.
- Goschl L, Scheinecker C, Bonelli M (2019) Treg Cells in Autoimmunity: From Identification to Treg-Based Therapies. Semin Immunopathol 41: 301-14.
- Chan TA, Yarchoan M, Jaffee E, Swanton C, Quezada SA, et al (2019) and Peters S. Development of tumor mutation burden as an Immunotherapy biomarker: utility for the oncology clinic. Ann Oncol 30: 44-56.
- Wu HX, Wang ZX, Zhao Q, Chen DL, He MM, et al (2019) Tumor mutational and indel burden: a Systematic pan-cancer evaluation as prognostic biomarkers [J]. Ann Transl Med 7: 640.
- Sachin GP, Benedito AC, Young KC, Ricardo LC, Aparna K, et al (2017) Correlation of tumor mutational burden and treatment outcomes in patients with colorectal cancer. J Gastrointest Oncol 8: 858-866.
- Eder T, Hess AK, Konschak R, Stromberger C, Johrens K, et al (2019) Interference of tumour mutational burden with outcome of patients with head and neck cancer treated with definitive chemoradiation: a multicentre retrospective study of the German Cancer Consortium Radiation Oncology Group. Eur J Cancer116: 67-76.
- Zhang LZ, Li BW, Peng Y, Wu F, Li QX, et al (2020) The prognostic value of TMB and the relationship between TMB and immune infiltration in head and neck squamous cell carcinoma: A gene expression -based study. Oral Oncol 110: 40-43.
- Zhang CJ, Li ZT, Qi F, Hu X, Luo L (2019) Exploration of the relationships between tumor mutation burdens with immune infiltrates in clear cell renal cell carcinoma. Ann Transl Med 7: 648.
- Lv J, Zhu YZ, Ji AL, Qi Z, Liao GD (2020) Mining TCGA database for tumor mutation burden and their clinical significance in bladder cancer. Biosci Rep 40: 4.
- Wu ZL, Wang MR, Liu QG1, Liu YX, Zhu KJ, et al (2020) Identification of gene expression profiles and immune cell infiltration signatures between low and high tumor mutation burden groups in bladder cancer. Int J Med Sci 17: 89-96.
- Robert MS, Chung HL, Alexander NS, Matthew DH, Ronglai S, et al (2019) Tumor mutational load predicts survival after immunotherapy across multiple cancer types. Nat Genet 51: 202-206.
- David AB, Hou Y, Ziad B, Miriam F, Miriam SA, et al (2020) Interplay of somatic alterations and immune infiltration modulates response to PD-1 blockade in advanced clear cell renal cell carcinoma. Nat Med 26: 909-918.
- Ramajiawan RR, Griffioen AW, Duda DG (2017) Anti-angiogenesis for cancer revisited: is there a role for combinations with immunotherapy. Angiogenesis 20: 185-204.
- Lin T, Amit G, Hai W, Hin CL, Ik SK, et al (2017) Mutual regulation of tumour vessel normalization and immunostimulatory reprogramming. Nature 544: 250-254.
- Thomas K, Christian F, Ainhoa A, Christian I, Dana B, et al (2017) Tumour ischaemia by interferon-γ resembles physiological blood vessel regression. Nature 545: 98-102.
Google Scholar, Crossref, Indexed at
Google Scholar, Crossref, Indexed at
Google Scholar, Crossref, Indexed at
Google Scholar, Crossref, Indexed at
Google Scholar, Crossref, Indexed at
Google Scholar, Crossref, Indexed at
Google Scholar, Crossref, Indexed at
Google Scholar, Crossref, Indexed at
Google Scholar, Crossref, Indexed at
Google Scholar, Crossref, Indexed at
Google Scholar, CrossRef , Indexed at
Google Scholar, Crossref, Indexed at
Google Scholar, Crossref, Indexed at
Google Scholar, Crossref, Indexed at
Google Scholar, Crossref, Indexed at
Google Scholar, Crossref, Indexed at
Google Scholar, Crossref, Indexed at
Google Scholar, Crossref, Indexed at
Google Scholar, Crossref, Indexed at
Google Scholar, Crossref, Indexed at
Google Scholar, Crossref, Indexed at
Google Scholar, Crossref, Indexed at
Google Scholar, Crossref, Indexed at
Google Scholar, Crossref, Indexed at
Google Scholar, Crossref, Indexed at
Google Scholar, Crossref, Indexed at
Google Scholar, Crossref, Indexed at
Google Scholar, Crossref, Indexed at
Google Scholar, Crossref, Indexed at
Google Scholar, Crossref, Indexed at
Google Scholar, Crossref, Indexed at
Google Scholar, Crossref, Indexed at
Google Scholar, Crossref, Indexed at
Google Scholar, Crossref, Indexed at
Google Scholar, Crossref, Indexed at
Google Scholar, Crossref, Indexed at
Google Scholar, Crossref, Indexed at
Google Scholar, Crossref, Indexed at
Google Scholar, Crossref, Indexed at
Google Scholar, Crossref, Indexed at
Google Scholar, Crossref, Indexed at
Google Scholar, Crossref, Indexed at
Google Scholar, Crossref, Indexed at
Google Scholar, Crossref, Indexed at
Citation: Maimaitiming A, Dong X, Zhang R, Aimudula A (2024) ComprehensiveAnalysis Prediction Prognosis and Immune Therapy Value of Angiogenesis-Associated Genes in Kidney Renal Clear Cell Carcinoma. Cell Mol Biol, 69: 303.
Copyright: © 2024 Maimaitiming A, et al. This is an open-access article distributedunder the terms of the Creative Commons Attribution License, which permitsunrestricted use, distribution, and reproduction in any medium, provided theoriginal author and source are credited.
Select your language of interest to view the total content in your interested language
Share This Article
Recommended Journals
Open Access Journals
Article Usage
- Total views: 1516
- [From(publication date): 0-2024 - Nov 18, 2025]
- Breakdown by view type
- HTML page views: 1217
- PDF downloads: 299
