Comparison of Spatio-Temporal Variations of Various Pollutants Levels at Residential, Industrial and Vehicular Sites of Lahore, Pakistan
Received: 03-Nov-2017 / Accepted Date: 27-Nov-2017 / Published Date: 04-Dec-2017 DOI: 10.4172/2573-458X.1000144
Abstract
Nowadays air over major cities has become over burdened with gases produced by automobiles throughout the world. The present study was conducted to investigate and monitor the ambient air quality. The results indicated the following mean concentrations (μg/m3): PM2.5 (138.25, 214.5, 234.5), NO2 (218, 170.4, 230.9), SO2 (196.5, 184.3, 189), CO (108.5, 82.04, 81.7) and O3 (680.2, 525.38, 590.5) for residential, industrial and vehicular sites in the respective order. Most of the pollutants were found to increase in winter except SO2 and CO which showed high concentrations in spring and autumn respectively. The results suggested that there was strong positive bivariate correlation being observed between each pair of pollutants (PM2.5, NO2, SO2, CO and O3 with p<0.01 or p<0.05). Pearson Correlation is applied to evaluate the correlation between different pollutants. The results depicts that increased concentration levels of pollutants (PM2.5, NO2) being observed at vehicular site on the other hand elevated concentration level of pollutants (SO, CO, O3) was seen at residential site.
Keywords: Air quality; Ambient air pollution; Particulate matter; Oxides of nitrogen and sulphur; Carbon monoxide; Ozone; Air pollution calculation
Introduction
The entire atmosphere is full of useful constituents present in the air and the environment possesses particulates, flora or fauna and alters the temporal variations [1]. A healthy ambient air is generally made up of 79% nitrogen (N2), 20% oxygen (O<sub>2</sub>), and 1% fusion of carbon dioxide (C), water vapors and little amount of numerous additional gases [2].
Fresh and sterilized air is regarded as a crucial need for humans and animals, however, unclean atmosphere cause a major risk for the whole world [3]. At present, the human health and healthy environment directly correlates with each other [2,4].
A review of the ambient air quality is very necessary because it completely effects on individual well-being [5,6]. The present atmosphere contains air, water and ground pollution. About 76% of the entire particulate matters result in air pollution as a whole. There are several main reasons of worst urban air quality such as bad quality of fuel, vast number of old vehicles, insufficient assessment and conservation plans [7].
Due to the presence of contaminants in the environment disturbs the weather conditions. Increase in contaminant’s level reaches the temperature range at dangerous zone in urban areas [7,8]. The harmful particles present in the environment and emissions arise from contaminants fluctuate with the time period disturb the natural ecosystem [9,10]. Destruction of the environment by natural or human induced processes is a dilemma and there is a need to cope with challenges of the present world. The main necessities for every air cleanup procedure are the elimination of the filthy smell and lethal gases of harmful particles [11]. Air pollutants level is increasing day by day [2].
The atmosphere is full of those elements or pollutants that emits during manufacturing or destruction of buildings which is clearly visible [12]. Particulate matter (PM2.5), Nitrogen dioxide (N), Sulphur dioxide (S) and Carbon monoxide (CO) are the harmful pollutants which deteriorates the environment [7,13]. These particles interrelate to develop another secondary air pollutant for example, Ozone (O3) which is extremely reactive and occur naturally in air.
PM2.5 particles are made up with a composite jumble of living and non-living materials (solid, liquid) present in the atmosphere. The main constituents of PM2.5 are sodium chloride, black carbon, mineral dust and water. The harmful elements are the one with 10 μm thick or less easily enter and stay within the lungs. The long-lasting contact with contaminants resides in the atmosphere linked with health effects. Sources of PM2.5comprise incineration, industrial units, destruction, farming actions and automobiles. After a while, sufficient intake of PM2.5 boosts up the possibility of chronic respiratory syndromes [14]. PM2.5 contaminant becomes lethal when it comes into contact with additional contaminants such as N and O3 [15].
N is a rosy-brunette gas with a pungent smell. The crucial causes of this gas are automobiles and their emissions. Heavy inhalation diminishes vision power and amplifies the danger of pulmonary diseases. Source of N is due to the burning of fossil fuels. It evolves from group of oxides of nitrogen (NOx). NOx merge with additional amalgams such as ammonia and humidity to create minute particles able to infiltrate into the lungs [14].
S is colorless, disgusting and have bitter smell. Source of SO2 is the ignition of fuels (e.g., oil and coal). Sulphur dioxide is important and prevalent contaminant enters in lungs and results in respiratory disease such as Chronic Obstructive Pulmonary Disease (COPD) [16]. It triggers the inflammation in lung tissues and spoils health of living beings. CO is neutral, colorless gas produce from the partial ignition of fuels. Consequently, the dominant causes of CO nowadays are automobiles. Infiltration of this gas lessens the quantity of in the blood vessels and elevated levels results in headaches, faintness, coma and collapse [14].
N combines with hazardous substances and high beam rays to generate ground- stage O3 level [15]. Ozone (O3) is a minor contaminant arises when sunbeams bring about photochemical reactions containing NOx and volatile organic compounds. Increase in levels is likely to rise in the afternoon. It affects like inflammation of eyes, increase risk of respiratory diseases and ultimate destruction of plants and animals [14]. Internationally, atmospheric contamination was most important ecological matter which disturbed pulmonary system of human beings [17].
Northern Italy has among the top dirtiest regions of Europe. The appropriate and instant socioeconomic growth, China has been facing critical atmospheric pollution matters [17,18]. The goal of the study is to assess the degree of air pollution in the surrounding areas that have been identified to monitor the air pollutants parameters, i.e., PM2.5, N, S, CO and O3 which influence ambient air quality also, find the correlation between various air pollutants and showed comparison among different contaminants at various sites.
Methodology
Plan of work
This chapter contains information about how this research work has been conducted in assessment of ambient air quality. It further highlights all the methods employed to calculate air quality and the ways data collected for accounting all the air pollutants. The present study was designed to accomplish an assessment of the air pollutants parameters to monitor air quality which led to severe health impacts and compared the monitored values with the National Ambient Air Quality Standards of five most important pollutants like PM2.5, N, S, CO and O3.
The year comprised of four seasons to analyze the seasonal and temporal differences: Winter, spring, summer and autumn. The weather of Lahore such as summer is scorching and damp whereas winter is cool and dry. Similarly, spring is less hot, temperature amplifies steadily and flowers blossom and autumn is neither hot nor cold because temperature decreases slowly. The winter is comprised the months of January, February, December, spring begun from March, April, May, summer started from June, July, August and autumn season come in the months of September, October and November as per local meteorological conditions.
Sampling area
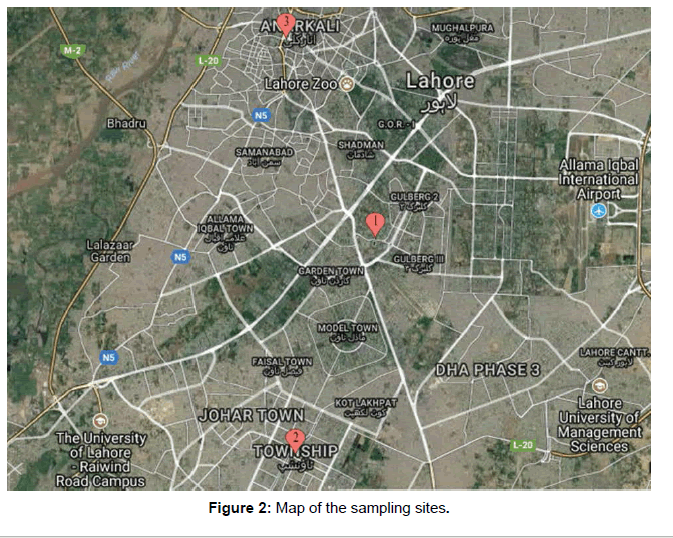
The study zone consists of three different sites from where air quality data has been monitored such as residential, industrial and vehicular sites. The residential is extended between 31°30'42.49''N latitude and 74°20'08.76''E longitude elevated at about 704 ft nearby National Hockey Qaddafi Stadium, Ferozpur Road Lahore.
The industrial area is extended between 31°26'08.49''N Latitude and 74°18'50.42''E Longitude elevated at about 685 ft.
The vehicular area/lower mall is extended between 31°34'17.48''N latitude and 74°18'34.39''E longitude elevated at about 715 ft.
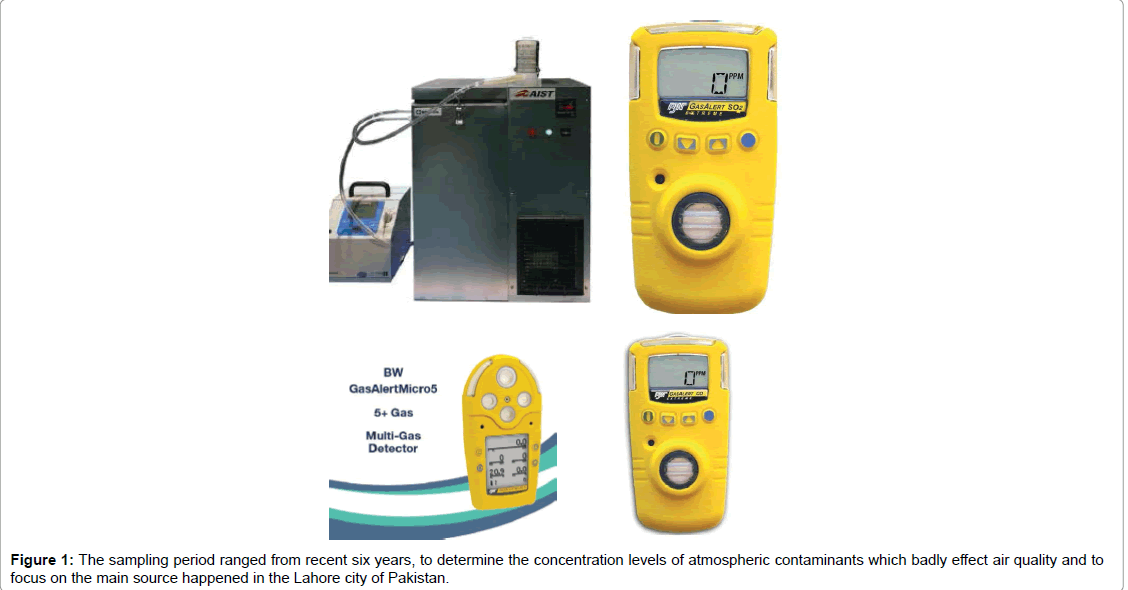
Sampling apparatus is carried out during air quality monitoring. Low Volume Air Sampler IMD-5IMP (SIBATA HV-1000F) would be used to check the concentration (μg/m3) levels of air pollutants like PM2.5 at designated sites. The NO2, SO2 and O3 was calculated with the help of portable detector BW Gas Alert NO2 extreme, BW Gas Alert SO2 extreme, and BW Gas Alert O3 extreme respectively. CO was collected with the help of portable instrument Neotronics Impulse XT. All the devices were placed at location for obtaining the maximum level of PM2.5, NO2, SO2, CO and O3 in the air (Figures 1-4).
| Correlations | |||||
|---|---|---|---|---|---|
| PM2.5 Conc. | NO2 Conc. | SO2 Conc. | CO Conc. | O3 Conc. | |
| PM2.5 Conc. | 1 | 0.587** | 0.463* | 0.501* | 0.943** |
| NO2 Conc. | 1 | 0.732** | 0.789** | 0.623** | |
| SO2 Conc. | 1 | 0.984** | 0.382 | ||
| CO Conc. | 1 | 0.439* | |||
| O3 Conc. | 1 | ||||
**. Correlation is significant at the 0.01 level (2-tailed)
*. Correlation is significant at the 0.05 level (2-tailed).
Table 1:Correlation within pollutants’ concentrations (µg/m3); a=Residential site, b=Industrial site, c=Vehicular site.
This Figure 2 shows the map of desired sampling sites in Lahore Punjab, Pakistan.
Data analysis
The study involved is descriptive and quantitative analysis. Descriptive analysis is used to depict and elucidate the analysis of both tables and figures. Quantitative analysis brought out by means of IBM SPSS 24.0 version statistical software. Correlation analysis is to get the relationship (correlation) between air pollutants. The data obtained were presented in tabular form. Likewise, the obtained results were compared with National Ambient Air Quality Standards limit to testify the levels of contaminants.
Results and Discussion
This portion assesses and elaborates the findings of the current research. The results were dependent on analysis of air quality parameters and their correlation analysis through SPSS 24.0 software. They were used to determine the concentration of particular five respective pollutants such as PM2.5 (μg/m3), NO2 (μg/m3), SO2 (μg/m3), CO (μg/m3) and O3 (μg/m3).
Concentration (μg/m3) levels of air pollutants at residential site
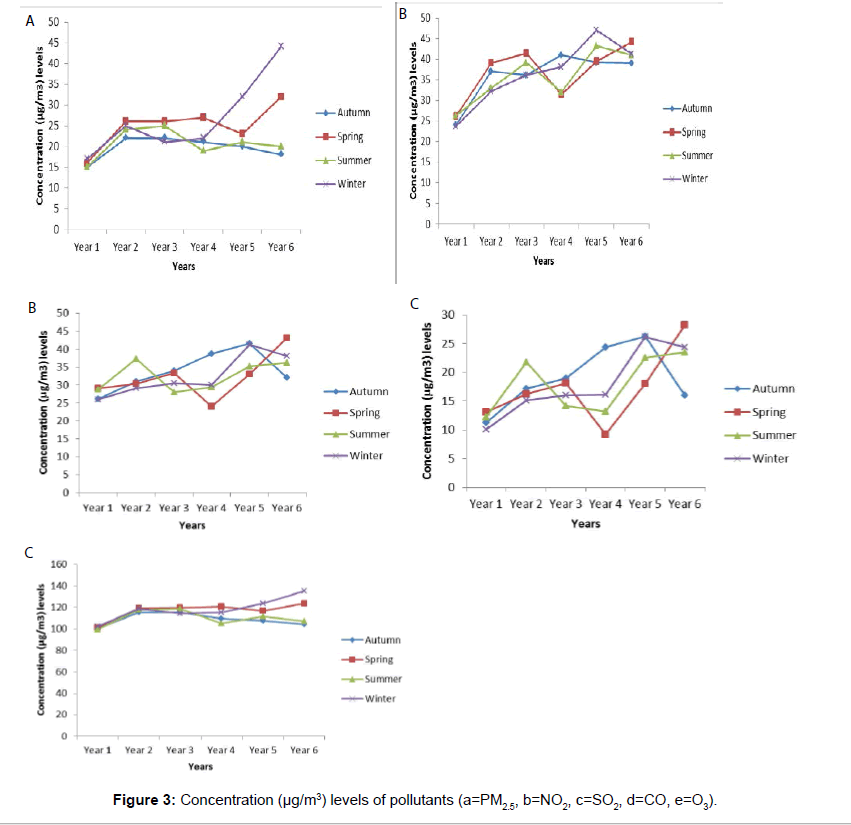
Multiple readings of every pollutant were reported in various seasons. PM2.5, SO2, CO and O3 concentrations showed an increasing trend i.e. 17-44 (μg/m3), 29.02-43.12 (μg/m3), 13.1-28.19 (μg/m3) and 102.07-135 μg/m3) respectively whereas NO2 reported decreasing trend, i.e., 47.1-44.17 (μg/m3) only in year 6, SO2 in year 3, i.e., 37.26-34.06 (μg/m3). In year 1, 5-6, the maximum concentrations of PM2.5 and CO were achieved higher in winter whereas from year 2-4, spring season showed the highest value being measured. For NO2 the maximum concentration is achieved in year 1 whereas spring season showed elevated intensity level in years 2-3 and 6. Autumn and winter showed elevated concentrations of NO2 in years 4-5, respectively. There were elevated intensity levels in years 1, 2 and 6, NO2 and CO in spring and summer. The maximum concentrations of NO2, SO2 and CO have been achieved in autumn from year 3-5. The concentration levels of O3 rose in winter, summer and autumn in six years as shown in Figure 3a. The annual mean concentrations (μg/m3) of PM2.5, NO2, SO2, CO and O3 in different seasons were 138.25, 218.03, 196.54, 108.05 and 680.20 at this site have been monitored, respectively.
Concentration (μg/m3) levels of air pollutants at industrial site
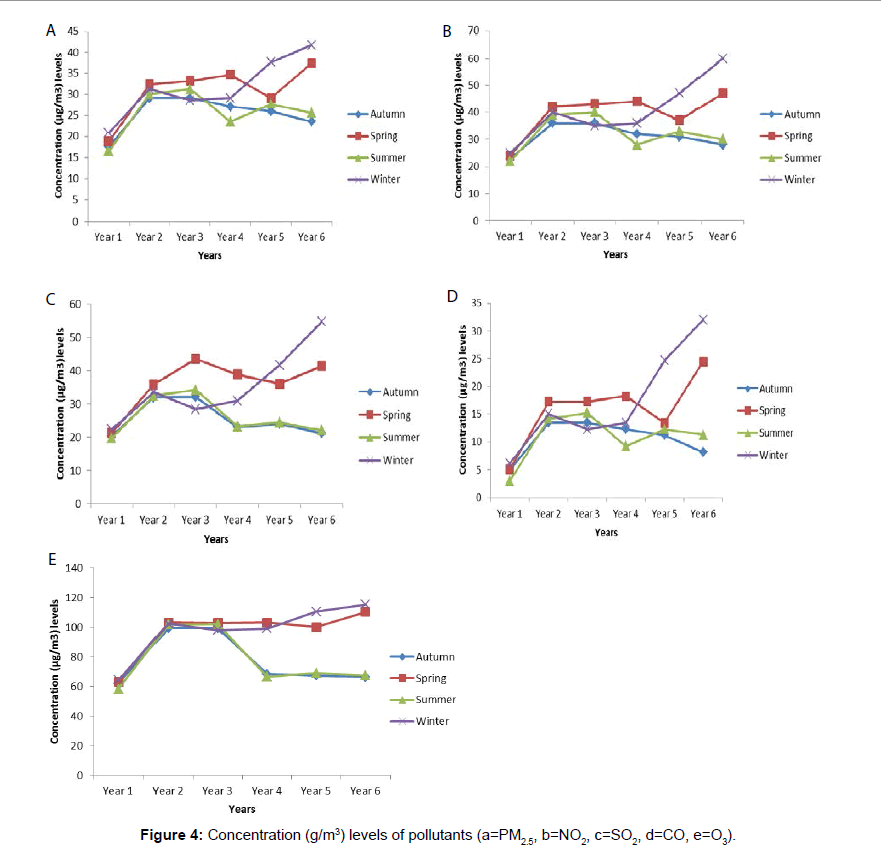
The multiple seasonal readings in recent study period of six years were carried out to check out the air pollutants levels reside in the atmosphere. At designated sites, multiple readings of each pollutant were recorded in different seasons. The data was represented in the form of simple line-bar charts/graphs. PM2.5, NO2, SO2, CO and O3 concentrations showed an increasing trend in all years, i.e., 25-60 (μg/ m3), 20.09-41.7 (μg/m3), 22.3-54.6 (μg/m3), 6.2-32 (μg/m3) and 64.2- 115.3 (μg/m3), respectively whereas O3 reported showed decreasing trend only in first two years at this site. In years 1, 5-6, the maximum concentrations of PM2.5, NO2 SO2, CO and O3 were achieved higher in winter whereas from years 2-4, spring season showed the highest value being measured as shown in Figure 3b. The annual mean concentrations (μg/m3) of PM2.5, NO2, SO2, CO and O3 in different seasons were 214.5, 170.37, 184.31, 82.04 and 525.39 at this site have been monitored respectively (Figure 4).
Concentration (μg/m3) levels of air pollutants at vehicular site
Multiple readings of each pollutant were reported in different seasons. PM2.5, NO2, SO2 and CO concentrations showed an increasing trend, i.e., 30-53 (μg/m3), 28.54-57.36 (μg/m3), 24.73-39.12 (μg/m3), 19.26-21.48 (μg/m3) respectively whereas SO2, CO and O3 reported decreasing trend only in year 6 during the study period of six years. In years 1, 5-6, the maximum concentrations of PM2.5, NO2 and O3 were achieved higher in winter whereas from years 2-4, spring season showed the highest value being measured. For SO2 summer season has the highest value in year 1, autumn in 4, winter in 5 and from years 2-3 and 6, spring has elevated concentration levels. For CO, autumn has greater concentration level from years 1, 3-5. In the same way, years 2 and 6 has higher intensity levels in spring and summer, respectively. The maximum concentration level of O3 is achieved in year 5, i.e., 126.5μg/ m3 as shown in Figure 3c. The annual mean concentrations (μg/m3) of PM2.5, NO2, SO2, CO and O3 in different seasons were 234.5, 230.97, 189, 81.72 and 590.50 at this site have been monitored, respectively.
In previous studies, the mean concentration of PM2.5 has obvious seasonal variation characteristics, the lowest value in summer and the higher value in winter and autumn. The seasonal characteristics with high concentration in winter and autumn but low in summer mainly could be attributed to the stable atmosphere in Changsha in autumn and winter [19]. Air pollution levels are the highest in the winter and the lowest in the summer observed in 32 major cities of China [20].
Photochemical associations of pollutants (NOx and VOCs) are mainly because of the greater intensity of sunbeams led to elevated O3 concentration levels [21]. Numerous reports from Brazil indicated that in those zones where atmospheric pollution level was led by sugar cane incineration directly correlated with PM2.5 concentrations [22].
Correlation within pollutants
Five major particular pollutants that were need to be monitored and correlated within those specific pollutants because one specific pollutant may increase or harm the other pollutant/environment. Significant association was found within pollutants at three different sites (residential, industrial and vehicular sites). The results suggested that there was strong positive bivariate correlation being observed between each pair of pollutants (PM2.5, N, S, CO and O3 with p<0.01 or p<0.05) in Tables 1-3.
| PM2.5Conc. | NO2 Conc. | SO2 Conc. | CO Conc. | O3 Conc. | ||
|---|---|---|---|---|---|---|
| PM2.5 Conc. | 1 | 0.981** | 0.966** | 0.980** | 0.895** | |
| NO2 Conc. | 1 | 0.926** | 0.973** | 0.892** | ||
| SO2 Conc. | 1 | 0.930** | 0.905** | |||
| CO Conc. | 1 | 0.829** | ||||
| O3 Conc. | 1 | |||||
**. Correlation is significant at the 0.01level (2-tailed).
Table 2: Correlation within pollutants’ concentrations (µg/m3); a=Residential site, b=Industrial site, c=Vehicular site.
The increased concentration levels of pollutants (PM2.5, NO2) being observed at vehicular site on the other hand elevated concentration level of pollutants (SO, CO, O3) was seen at residential site. There was a study of Shanghai, China evaluate correlation coefficients which is quite similar to this study. Several current findings indicated that there was a strong connection between specific air contaminants [19].
All the pollutants (PM2.5, NO2, SO2, CO and O3 depicted positive correlation within the pollutants at all sites (a, b and c) except PM2.5 and NO2 showed negative bivariate correlation with CO in the Table 3.
| PM2.5 Conc. | NO2 Conc. | SO2Conc. | CO Conc. | O3 Conc. | |
|---|---|---|---|---|---|
| PM2.5 Conc. | 1 | 0.990** | 0.599** | -0.292 | 0.402 |
| NO2 Conc. | 1 | 0.585** | -0.292 | 0.410* | |
| SO2 Conc. | 1 | 0.177 | 0.791** | ||
| CO Conc. | 1 | 0.062 | |||
| O3 Conc. | 1 |
** Correlation is significant at the 0.01 level (2-tailed)
* Correlation is significant at the 0.05 level (2-tailed).
Table 3: Correlation within pollutants’ concentrations (µg/m3); a=Residential site, b=Industrial site, c=Vehicular site.
Conclusion
Most of the pollutants (PM2.5, NO2 and O3) were found to increase in winter season except SO2 and CO which showed high concentration in spring and autumn seasons respectively. The questionnaire survey results have been shown that the health status was good of those people that were not living nearby industrial area. Kendall’s tau-c test is applied on questionnaire results shows that all the factors indicated a significant association with health facilities, health status, air quality and the trends of air pollution level over last 10 years. Air purifiers are also need to be introduced in the environment which may help to reduce pollution all over the Pakistan. Use of Public Transportation, buy energy efficient vehicles, make use of Solar Energy, quit smoking which might purify the air. Grow Own Fruits and Vegetables in home and banned on cutting down of forests would be a great way to stop air pollution. It will be a major challenge to reduce the negative environmental effects and environmental risk factors can be mitigated, leading to improved health outcomes in patients with pulmonary diseases. By eliminating the source of the problem the level of pollution can be controlled. There should a need of preventive measures to be performed for safeguarding the health of the humans.
References
- Veremchuk LV, Yankova VI, Vitkina TI, Nazarenko AV, Golokhvast KS (2016) Urban air pollution, climate and its impact on asthma morbidity. Asian Pac J Trop Biomed 6: 76-79.
- Mabahwi NAB, Leh OLH, Omar D (2014) Human health and well-being: Human health effect of air pollution. Procedia Soc Behav Sci 153: 221-229.
- Sousa SIV, Pires JCM, Martins EM, Fortes JDN, Alvim-Ferraz MCM, et al. (2012) Short-term effects of air pollution on respiratory morbidity at Rio de Janeiro — PART I: Air Pollution Assessment. Environ Int 44: 18-25.
- Botkin DB, Keller EA (2007) Environmental science: Earth as a living planet. Hoboken, NJ: Wiley.
- Plaia A, Ruggieri M (2011) Air quality indices: A review. Rev Environ Sci 10: 165-179.
- Chen R, Wang X, Meng X, Hua J, Zhou Z, et al. (2013) Communicating air pollution-related health risks to the public: An application of the air quality health index in Shanghai, China. Environ Int 51: 168-173.
- Gulia S, Nagendra S, Khare M, Khanna I (2015) Urban air quality management - A review. APR 6: 286-304.
- Gokhale S, Khare M (2005) A hybrid model for predicting carbon monoxide from vehicular exhausts in urban environments. Atmos Environ 39: 4025-4040.
- Balogun VS, Orimoogunje OOI (2015) An assessment of seasonal variation of air pollution in Benin City. Atmos Clim Sci 5: 209-218.
- Dadhich AP, Goyal R, Dadhich PN (2017) Assessment of spatio-temporal variations in air quality of Jaipur city. The Egyptian Journal of Remote Sensing and Space Science.
- Muller CO, Yu H, Zhu B (2015) Ambient air quality in China: The impact of particulate and gaseous pollutants on iaq. Procedia Engineering 121: 582-589.
- Brugha R, Grigg J (2014) Urban air pollution and respiratory infections. Paediatr Respir Rev 15: 194-199.
- Wang SX, Hao JM (2012) Air quality management in China: Issues, challenges and options. J Environ Sci 24: 2-13.
- Daly A, Zannetti P (2007) An introduction to air pollution–definitions, classifications, and history. Ambient Air Pollution, pp: 1-14.
- Johannson KA, Balmes JR, Collard HR (2015) Air pollution exposure. Chest 147: 1161-1167.
- Ozcan NS, Cubukcu KM (2015) Evaluation of air pollution effects on asthma disease: The case of Izmir. Proc Soc Behav Sci, pp: 448-455.
- Guan WJ, Zheng XY, Chung KF, Zhong NS (2016) Impact of air pollution on the burden of chronic respiratory diseases in China. Lancet 388: 1939-1951.
- Zhang S, Li G, Tian L, Guo Q, Pan X (2016) Short-term exposure to air pollution and morbidity of COPD and asthma in East Asian area. A systematic review and meta-analysis. Environ Res 148: 15-23.
- Huang R, Chun I (2017) Seasonal variation characteristics and forecasting model of PM2.5 in Changsha, central city in china. J Environ Anal Toxicol
- Zhou M, He G, Liu Y, Yin P, Li Y, et al. (2015) The associations between ambient air pollution and adult respiratory mortality in 32 major Chinese cities, 2006-2010. Environ Res 137: 278-286.
- Wan Mahiyuddin WR, Sahani M, Aripin R, Latif MT, Thach TQ, et al. (2013) Short term effects of daily air pollution on mortality. Atmos Environ 65: 69-79.
- Brunekreef B (2010) Air pollution and human health: from local to global issues. Procedia Soc Behav Sci 2: 6661-6669.
Citation: Aslam H (2017) Comparison of Spatio-Temporal Variations of Various Pollutants Levels at Residential, Industrial and Vehicular Sites of Lahore, Pakistan. Environ Pollut Climate Change 1:144. DOI: 10.4172/2573-458X.1000144
Copyright: © 2017 Aslam H. This is an open-access article distributed under the terms of the Creative Commons Attribution License, which permits unrestricted use, distribution, and reproduction in any medium, provided the original author and source are credited.
Select your language of interest to view the total content in your interested language
Share This Article
Recommended Journals
Open Access Journals
Article Tools
Article Usage
- Total views: 5201
- [From(publication date): 0-2017 - Dec 03, 2025]
- Breakdown by view type
- HTML page views: 4135
- PDF downloads: 1066


