Research Article Open Access
Comparison between Immunological and Molecular Based Methods for Diagnosis of Mycobacterium Infections in Cattle, Buffaloes and Human in Egypt
Elsayed MSA1*, Elkerdasy AF2,3, Akeila MA4 and Elsayed AA51Department of Bacteriology, Mycology and Immunology, University of Sadat City, Minufyia, Egypt
2Department of Biochemistry, University of Sadat City, Minufia, Egypt
3Department of Biomedical Science, College of Pharmacy, Shaqra University, Al-Dawadmi, Saudi Arabia
4Department of Microbiology, Alexandria University, Egypt
5Department of Internal medicine and Animal Infectious Diseases, Cairo University, Egypt
- *Corresponding Author:
- Elsayed MSA
Department of Bacteriology
Mycology and Immunology
University of Sadat City, Egypt
Tel: +20 48 2607037
E-mail: mohamed.sabry@vet.usc.edu.eg
Received date: August 03, 2016; Accepted date: August 22, 2016; Published date: August 27, 2016
Citation: Elsayed MSA, Elkerdasy AF, Akeila MA, Elsayed AA (2016) Comparison between Immunological and Molecular Based Methods for Diagnosis of Mycobacterium Infections in Cattle, Buffaloes and Human in Egypt. Cell Mol Biol 62: 125. doi: 10.4172/1165-158X.1000125
Copyright: © 2016 Elsayed MAS, et al. This is an open-access article distributed under the terms of the Creative Commons Attribution License, which permits unrestricted use, distribution, and reproduction in any medium, provided the original author and source are credited.
Visit for more related articles at Cellular and Molecular Biology
Abstract
Pathogenic mycobacteria are notorious for infections in animals and human their diagnosis hampered by atypical types. Animal products consumption is responsible for majority of diseased cases worldwide. Comparison between diagnostic tests appears to be lacking in Egypt. Therefore, this study aimed to evaluate diagnostic values of Flow-cytometry, Immuno-chromatography, Low-cost Density Microarray (LCD) array, High-Performance Liquid Chromatography (HPLC) and multiplex Polymerase Chain Reaction (PCR). Comparative Intradermal Tuberculin Test result was 1.31%. M. bovis and M. kansasii were high from animal samples while, M. chelonae and M. malmoense from human samples using LCD array, HPLC and multiplex PCR confirmation. Serological tests estimated with differences regarded to different antigens. Chembio DPP VetTB Assay gave the highest sensitivity result 94.8% while, TB-ST (Tuberkulose Schnell test) test kit showed the lowest 82%. Flow-cytometry, CD2, CD4, CD8 and δγ WC1+ cells were high in tuberculin-positive cases and low in negative proving pathogenic mycobacterial infections of tuberculin-positive cases. (LCD) array, (HPLC) and multiplex (PCR) proved sensitive discriminatory methods while; serologic assays and flow-cytometry represent rapid diagnostic tools. Further investigations required to improve the sensitivity and specificity of these tests. These results elucidate the importance of different diagnostic tests and considered backbone for future researches.
Keywords
Mycobacterium; Flow-cytometry; Immuno-chromatography; LCD array; PCR; HPLC
Introduction
Bovine tuberculosis is a paramount notifiable disease in dairy herds caused by M. bovis, crucial bacteria of wide host spectrum; affects many mammal species, humans, and wild animals those act as a reservoir and hamper its eradication [1-7]. It belongs to Mycobacterium tuberculosis Complex MTC which includes M. tuberculosis, M. bovis, M. caprae, M. microti, M. canettii, M. pinnipedii, and M. africanum. Perception of M. bovis pathogenesis elucidates its presence, propagation, and transmission [8-14]. Ante-mortem screening basically relies on tuberculin skin test, serologic tests, cytokine assays as indirect diagnostic methods. These tests may be limited by lack of species-specific reagents and validation, frequent captures to administer and record results, animal injuries (i.e., TST) and sample-handling requirements [15- 18]. Although the sensitivity and specificity of serological assays may increase using specific antigens constituting alternative TB diagnostic tools [4]. Cell-Mediated immune response is the major host response to Mycobacterium infections and is complicated by many significant differences. A common problematic theme is the prolonged latent asymptomatic period which can last for many years. Fundamentally, T cells are cells of major concern in this immune response. Centering upon T helper-1cells (Th-1) it plays vital role during latency that correlates to the control of pathogen proliferation and progression. Many studies focused on the protective role attributed to CD4, CD8, and γδ T cells [7] and CD2. Detection of changes in these cells considered as diagnostic markers for Mycobacterium infection [15]. Moreover, Low-Cost and Density DNA microarrays (LCD) considered easy to use, sensitive and specific molecular tools for diagnosis of mycobacterial infections [6]. Furthermore, High-Performance Liquid Chromatography (HPLC) could be used for Mycobacterium identification through analysis of mycolic acids with great specificity [10].
Hence, this study was planned to compare Flow-cytometry, Immuno-chromatography, Low-cost Density Microarray (LCD) and High-Performance Liquid Chromatography (HPLC) for rapid detection of Mycobacterium in samples and isolates from cattle, buffaloes, and human cases.
Methodology
Tuberculin test
Comparative Intradermal Tuberculin Test of 6000 Holstein- Frisian cattle and native breed buffaloes. Briefly, after shaving two sites on one side of the neck (12 cm apart) and recording skin thickness initially, 0.1 ml of avian tuberculin PPD‚??A (Avian PPD 25,000 IU/ml) was injected intradermal into the upper site and an equivalent dose of (Mammalian or bovine PPD tuberculin: 2 mg/ml) injected into the lower site of the neck, 72 h post injection the skin thickness measured again and recorded. The corresponding thickness ≥1 mm to <4 mm, ≥1 mm to <3 mm, and ≥1 mm to <2 mm classified as doubtful result. The result considered negative if skin response <1 mm and positive if skin fold thickness of ≥4 mm [2].
Sampling and Cultivation
Animal samples: Blood samples collected from 120 cattle and buffaloes (79 tuberculin positive, 41 tuberculin negative). 10 ml blood in sterile McCartney tubes for serum, 37 ml mixed with 12.5 ml acid citrate dextrose (anticoagulant) for lymphocytes separation. Tuberculin positive slaughtered (according to Egyptian law) then subjected to postmortem examination. Mandibular, mediastinal, left and right bronchial, hepatic and mesenteric lymph nodes were collected. Tissue samples from lungs, liver, spleen and intestine as well. Samples classified to the visible lesion (VL) and nonvisible lesion (NVL) then processing for cultivation [16-20] as well as for DNA extraction after concentration.
Human sputum samples from diagnosed cases: Three first morning sputum specimens of 5-10 ml after a deep productive cough for three consecutive days into a sterile cap. The specimens kept at 4°C before processing with N-acetyl-L-cysteine-NaOH (NALC-NaOH).
Cultivation: Animal samples cultivated onto Modified Lowenstein -Jensen pyruvate media (LJ-P) while, human samples cultivated onto Modified Lowenstein -Jensen glycerol media (LJ-G) [19-25].
DNA extraction and molecular examination by LCD array
QIAamp DNA extraction Mini prep Kit for extraction of DNA. Molecular typing and LCD array performed according to [6]. Confirmation of the M. bovis by multiplex Polymerase Chain Reaction using primers targeting Miru [26], VNTR 3232, Miru [24], QUB 4156c and QUB 1451 [26].
Flow-cytometry
Animal blood sampling for Flow-cytometry: 1st group of 4 Holstein Frisian cattle (tuberculin positive), 2end control group of 4 Holstein Frisian cattle (tuberculin negative). 3rd group 4 native breed buffalos (tuberculin positive) and the 4th control group of 4 native breed buffalo (tuberculin negative).
Direct Immunofluorescence Staining according to Bio-Rad AbD Serotec protocol
Blood lysis by adding 2 ml freshly prepared erythrolyse red cell lysing buffer and mix well. Incubate for 10 minutes at room temperature. Centrifuge at 300-400 g for 5 minutes at room temperature and discard the supernatant. Wash with 2 ml room temperature PBS/ BSA, centrifuge at 300-400 g for 5 minutes and discard the supernatant. Adjust the cell suspension to a concentration of 1 × 10⁷ cells/ml with cold (4°C) PBS/BSA buffer. Aliquot 100 μl of the cell suspension into as many test tubes as required. Add antibody at the vendor-recommended dilution. Mix well and incubate at 4°C for at least 30 minutes, avoiding direct light. Wash cells with 2 ml cold (4°C) PBS/BSA, centrifuge at 300-400 g for 5 minutes at 4°C, and discard the resulting supernatant. Resuspend cells in with 200 μl of 0.5% paraformaldehyde in PBS. The cells were analyzed using Becton Dickinson FACS Caliber flow cytometer equipped with argon and red lasers. This machine connected to Macintosh 5 computer, with Cell Quest software (Becton Dickinson Immunochemistry systems, San Jose CA) at the Flow-cytometry Unit, Department of Clinical Pathology, Faculty of Medicine, Minufyia University. FCS express software (De Novo software, Thornton, Ontario) used to analyze the data (Table 1).
| Product Code | Ig isotype | Specificity |
|---|---|---|
| MCA1653F | IgG2a | CD4 |
| MCA837F | IgG2a | CD8 CD8 alpha |
| MCA838G | IgG2a | WC1+ δγ TCR1 chain |
| MCA833F | IgG1 | CD2 |
Table 1: Utilized monoclonal antibodies.
Serological testing and Immunochromatography
Using Acon rapid test for diagnosis of M. tuberculosis. Chembio DPP Vet TB test for M. tuberculosis and M. bovis. TB-ST (Tuberkulose Schnelltest) test Lionex diagnostics and therapeutics GmbH and Diavita tuberculosis rapid test according to the manufacturer instructions.
High-performance liquid chromatography (HPLC)
The HPLC performed after LCD array for confirmation. Bacterial growth in LJ medium collected by a swab and saponified with 2 ml KOH 25% in methanol: H2O (v:v). Autoclaved for 1 h at 121°C, 15 psi, to cleave the mycolic acids bound to the cell wall and HPLC fulfilled according to [8] Reproducible chromatographic diagnostic peaks using reference strains (M. bovis ATCC 19210, M. chelonae ATCC 35752, M. kansasii, ATCC 12478, M. malmoense ATCC 29571, M. tuberculosis ATCC 25177). HPLC System Agilent 1100 Series used.
Data Analysis
Data analyzed by Statistical Analysis System software package SAS for Windows, version 8 (SAS Institute, Cary, NC). Independent t-test used and the significant differences between flow-cytometer means represented by Mean ± SE and comparison between data to detect significant difference between that of tuberculin positive and negative cases.
Results
Ante-mortem intradermal testing and slaughter house examination
There found low proportions of tuberculin-positive cases which was detected by comparative tuberculin testing 79/6000 (1.31%). Significant difference was found between VL and NVL (<0.0001) (Table 2).
| Place of collected samples | No. of animals | Tuberculin +ve | PM finding | |||||
|---|---|---|---|---|---|---|---|---|
| VL | NVL | |||||||
| No | % | No | % | No | % | |||
| Different localities at Alexandria, El-Behira, El-Gharbia, Kafr El-Sheikh and Menofyia Governorate (within two years) | Cattle and buffaloes | 6000 | 79 | 1.31% | 60 | 75.94% | 19 | 24.05% |
Table 2: Results of tuberculin test and post mortem examination. (Significant difference between VL and NVL is <0.0001).
Isolation and identification of Mycobacterium species from various lesions
There located weak downhill (negative) linear relationship (r): -0.173 between animal lesions, culture, and microscopy. It was found that only 51/89 (57.3%) were positive for isolation due to the absence of isolation from calcified pulmonary and digestive lesions and diminished isolation from NVL. On the other hand, human samples gave highest isolation 10/10 (100%) from (Table 3).
| Post-mortem findings | No. of samples | Culture and microscopy | |
|---|---|---|---|
| No | % | ||
| Generalized (VL) | 7 | 7 | 100% |
| Localized head lymph nodes (VL) | 8 | 7 | 87.5% |
| Pulmonary calcified (VL) | 15 | -ve | 0.0% |
| Pulmonary uncalcified (VL) | 8 | 8 | 100% |
| Digestive (VL) | 10 | -ve | 0.0% |
| Mixed (VL) | 12 | 12 | 100% |
| Non Visible Lesion (NVL) | 19 | 7 | 15.78% |
| Total | 89 | 51 | 57.3% |
| Human | 10 | 10 | 100% |
Table 3: Results of bacteriological examination of animal and human samples. [Weak downhill (negative) linear relationship (r) = 0.173 between collected samples isolation and microscopy].
Molecular identification of Mycobacterium isolates by LCD array, HPLC and multiplex PCR
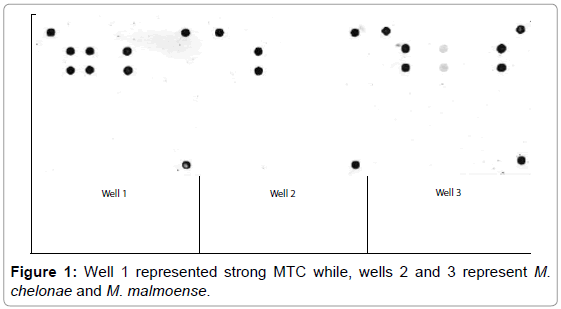
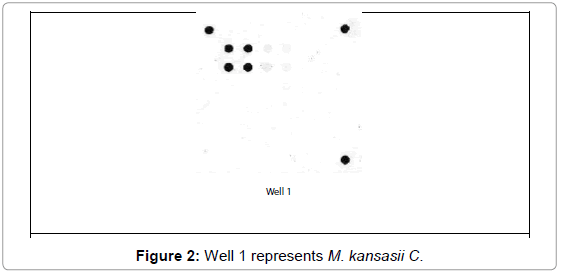
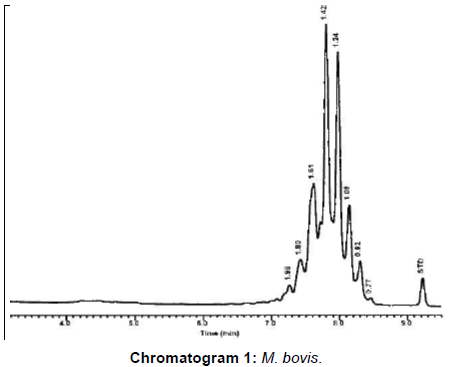
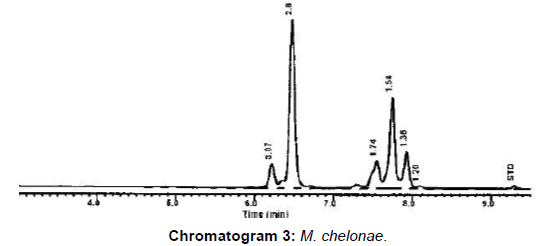
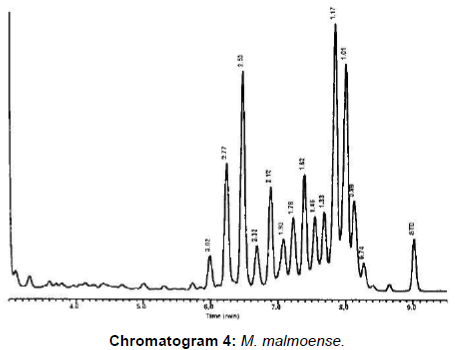
M. bovis represented 20 (80%) and 3 (42.9%) from VL and NVL isolates for M. kansasii only 4 (16%) from VL. M. chelonae and M. malmoense expressed 2 (20%) and 1(10%). Perfect uphill (positive) linear relationship (r): +1 between LCD array on tissue and corresponding isolates added to that, between LCD array, HPLC and multiplex PCR (Table 4), (Figures 1 and 2) Chromatograms (1, 2, 3 and 4).
| Type of samples | No. of isolates | The result of LCD array | The result of HPLC on culture | The multiplex PCR | |
|---|---|---|---|---|---|
| Tissue | Culture | ||||
| Cattle and buffaloes VL. | 25 | 20 (80%) MTC | 20 (80%) MTC. | 20 (80%) MTC. | 20 (80%) M. bovis |
| 4(16%) M. chelonae chelonae kansasii | 4(16%) M. kansasii. | 4 (16%) M. kansasii | Not performed | ||
| 1 (4%)* | 1 (4%)* | 1 (4%) No similarity | Not performed | ||
| Cattle and buffaloes NVL. | 7 | 3 (42.9%) MTC | 3 (42.9%) MTC | 3 (42.9%) MTC | 3 (42.9%) M. bovis |
| 4 (57.1%)* | 4 (57.1%)* | 4 (57.1%) No similarity | Not performed | ||
| Human samples. | 10 | 2 (20%) M. chelonae | 2 (20%) M. chelonae | Not performed | |
| 2 (20%) * | 2 (20%) No similarity | Not performed | |||
| 1(10%) M. malmoense | 1 (10%) M. malmoense | Not performed | |||
| 5 (50%) Negative | 5 (50%) Negative | Not performed | |||
Untypable (means got mycobacterium DNA but not similar to LCD patterns, HPLC no similarity (means gave curve but not similar to listed species). Perfect uphill (positive) linear relationship (r): +1 between LCD array on tissue and corresponding isolates and between LCD array and HPLC.
Table 4: Molecular identification by LCD array, HPLC and multiplex PCR confirmation of Mycobacterium tuberculosis complex.
Clinical evaluation of sensitivity, specificity, positive and negative predictive values of antigen rapid TB test kits
Chembio DPP VetTB Assay gave the highest sensitivity results with 94.8% while, TB-ST (Tuberkulose Schnelltest) test kit was the lowest with 82%. Furthermore, Acon test gave the highest specificity 96% and Chembio DPP VetTB Assay was the lowest 88.9% (Table 5).
| Type of serological test | Acon test | Chembio DPP VetTB Assay | TB-ST (Tuberkulose Schnell test) test kits |
|---|---|---|---|
| Sensitivity | 93% | 94.8% | 82% |
| Specificity | 96% | 88.9% | 92.5% |
| Positive Predictive Value | 28% | 34% | 12% |
| Negative Predictive Value | 100% | 100% | 100% |
Table 5: Results of rapid bovine TB serological tests. Sensitivity, specificity, positive predictive and negative predictive were calculated against the isolation as gold standard.
Flow-cytometric evaluation of tuberculin positive and negative animals proved a noticeable increase in tuberculin-positive cattle. CD2+ cells soared over than 3 times, CD4 was twice that of tuberculinnegative cattle. Moreover, from tuberculin positive buffaloes CD2+ and CD8 were twice more the counts of their counterparts from tuberculin negative buffaloes.
Significant difference (P<0.0001) present between the counts of CD2+, CD4, CD8 and WC1+δγ of tuberculin-positive from counts of tuberculin- negative animals (Table 6).
| Animal type | CD4 | CD8 | WC1+δγ | CD2+ |
|---|---|---|---|---|
| Tuberculin positive (4) cattle | 3400 ± 173 | 2150 ± 663 | 1350 ± 144 | 3900 ± 692 |
| Tuberculin negative (4) cattle | 1700 ± 404 | 1950 ± 144 | 850 ± 144 | 1150 ± 28 |
| Tuberculin positive (4) buffaloes | 2525 ± 558 | 3800 ± 273 | 2450 ± 202 | 4555 ± 1228 |
| Tuberculin negative (4) buffaloes | 2400 ± 115 | 1900 ± 404 | 2275 ± 390 | 2050 ± 606 |
Table 6: Flow-cytometry results of direct labeling of CD2+, CD4, CD8 and WC1+δγ cells. (Significant difference between cells of tubercuiln positive and negative animals is P<0.05).
Discussion
M. bovis is a crucial infectious agent of wide host spectrum besides cattle it affects other mammal species including humans. It belongs to Mycobacterium tuberculosis Complex members [14-16]. Interestingly, the overall incidence level of Mycobacterium in Table 2 was 1.31% lower than 2015 records from Egypt [23]. On the contrary, nearly similar to obtained results at Mozambique [27]. This low percentage attributed to regular commitment with test and slaughter program of the authorities to control the spread of infections.
Notably, the obtained VL and NVL results were analogous to that from Ireland 2013 [25]. In comparison with recent records from Egypt the VL was higher than 2015 records [23] while the NVL lower than these records. Significant difference was found between VL and NVL (<0.0001) that considered a feature of M. bovis infections that cause variation in the shape and distribution of lesions with respect to the isolation rate 57.3% from Table 3 nearly like that from cattle in Ethiopia after 2010 data [3]. The obtained isolation result from human sputum 10/10 (100%) was higher than the 2012 records from Egypt [21]. Isolation and identification of Mycobacterium species from various lesions in different organs
This mainly reflects various routs of infection and even possible secondary spread within the animal body.
Identifying Mycobacterium species using traditional methods is time consuming and expensive. For this reason, LCD array, HPLC and multiplex PCR confirmation performed here as attractive alternatives to the most traditional techniques. That’s mainly due to the high sensitivity and specificity of these diagnostic techniques:
From the results of molecular identification of VL tissue samples and culture (Table 4), Figures 1 and 2 and chromatogram 1, it was found that 20/25 (80%) confirmed to be from MTC members this result comes consistent with results from Brazil during 2014 [1].
And comparing the results from VL and NVL to data from the USA in 2012 [9], the isolation was lower, molecular identification results of MTC were higher while, that for the atypical was lower.
The incidence of non-tuberculous mycobacteria (NTM) infections has increased over the past couple of decades after reports from Canada [5]. Concerning molecular confirmation of results of M. kansasii Table 4, Figure 2 and chromatogram 2 from VL tissue and culture was 4/25 (16%) higher than results reported in USA from 2004 to 2011 [28] But comport with him in the possibility to isolate non-tuberculous mycobacteria from gross tuberculous lesions.
Over and above, the results of molecular identification from NVL tissue samples and culture positive samples Table 4 proved that 3/7 (42.9%) belong to MTC members. The untypable isolates were 4/7 (57.1%) lower than results obtained from Project SE3262), funded by Department of Environment, Food and Rural Affairs, UK (www.defra. gov.uk) [25].
From Table 4, Figure 1 and chromatogram 3, the molecular confirmation of mycobacterial DNA from human samples and isolates M. chelonae represented 2/10 (20%) comply with data reported from northeastern USA [24].
Moreover, only 1/10 (10%) (Table 4), Figure 1 and chromatogram 4 proved M. malmoense which confirmed by reports from Canada [5] Great correlation expressed between LCD array, HPLC and multiplex PCR as stated after results from Texas Department of Health USA [11]. M. bovis was most often isolated from cattle and buffaloes besides atypical species as M. kansasii. M. chelonae and M. malmoense reported from human cases with no evidence of pathogenic Mycobacterium infection.
From Table 5, sensitivity and specificity of Acon test nearly comparable to results from Pakistan [12]. The results of DPP VetTB assay and TB-ST (Tuberkulose Schnell test) higher than published data from National Animal Disease Center USA, and Brazil [17-22], the variability in readings of different serological tests could be attributed to the stage of Mycobacterium infection and the different antigens contained in each test.
With regard to data obtained in Table 6, it was trenchant that CD2, CD4, CD8 and δγ WC1+ from M. bovis infected cattle and buffaloes higher than tuberculin negative cases. This basically confirms infection with pathogenic Mycobacterium especially M. bovis and comes in agreement with results gained from the UK and USA [13-29]. This evidence indicates in vivo activation of these populations and great probability of being a diagnostic markers of pathogenic Mycobacterium infection.
Conclusion
This is the first report in Egypt about comparing different diagnostic techniques to detect Mycobacterium infections. It is clear that lower rates of pathogenic Mycobacterium species present in Egypt. But, still the low sensitivity of tuberculin test constituting a nightmare which calls for finding rapid, sensitive and specific ante-mortem diagnostic tool. Although (LCD) array, (HPLC) and multiplex (PCR) proved great sensitivity they override culture in being low time consuming methods. Serological tests and flow-cytometry are promising but further investigations using different antigens in different stages of infection are required.
References
- Araújo C. P., Osório A. L., Jorge K. S., Ramos C. A., Filho A. F., Vidal C. E., Vargas A. P., Rocha A. S., Suffys P. N., Júnior A. A., Neto M. R., Cerqueira V. D. & Araújo F. R. Direct detection of Mycobacterium tuberculosis complex in bovine and bubaline tissues through nested-PCR. Braz. J. Microbiol. 2014, 45: 633-640.
- Bezos J., Marques S., Alvarez J., Casal C., Romero B., Grau A., Minguez O., Dominguez L. & De Juan L. Evaluation of single and comparative intradermal tuberculin tests for tuberculosis eradication in caprine flocks in Castilla y Leon (Spain). Res. Vet. Sci. 2014, 96: 39-46.
- Biffa D., Bogale A. & Skjerve E. Diagnostic efficiency of abattoir meat inspection service in Ethiopia to detect carcasses infected with M. bovis: Implications for public health. BMC Public Health. 2010, 10: 462.
- Buddle B.M., Wilson T., Denis M., Greenwald R., Esfandiari J., Lyashchenko S., Liggett K. P. & Mackintosh C.G. Sensitivity, specificity, and confounding factors of novel serological tests used for the rapid diagnosis of bovine tuberculosis in farmed red deer (Cervus elaphus). Clin. Vaccine Immunol. 2010, 17: 626-630.
- Cowan C. D., Hawboldt J. J. & Bader M. Pulmonary infection due to M. malmoense in a patient with Crohn’s disease. Can. J. Hosp. Pharm. 2009, 62: 496-499.
- El Sayed M. S. A. LCD array and IS900 efficiency in relation to traditional diagnostic techniques for diagnosis of M. avium subspecies paratuberculosis in cattle in Egypt. Int. J. Mycobacteriol. 2014, 14: 101-107.
- Flynn J. L. & Chan J. Immunology of tuberculosis. Annu. Rev. Immunol. 2001, 19: 93-129.
- Furlanetto L.V., Conte C. A., Figueiredo E. E., Duarte R. S., Lilenbaum W., Silva J. T. & Paschoalin V. M. HPLC protocol for identification of Mycobacterium spp. from clinical samples of human and veterinary. J. Microbiol. Res. 2014, 4: 193-200.
- Guarner J. Detection of microorganisms in granulomas that have been formalin-fixed: review of the literature regarding use of molecular methods. Scientifica. 2012, 12: 494571-16.
- Jeong J., Kim S., Lee S., Lim J., Choi J., Park J., Chang C. L., Choi J.Y., Richman D.D. & Smith D.M. The use of High Performance Liquid Chromatography to speciate and characterize the epidemiology of mycobacteria. Lab. Medicine. 2011, 42: 612-617.
- Jost K.C., Dunbar D.F., Barth S.S., Headley V.L. & Elliot L.B. Identification of M. tuberculosis and M. avium complex directly from smear-positive sputum specimens and Bactec-12B cultures by high performance liquid chromatography with fluorescence detection and computer-driven pattern recognition models. J. Clin. Microbiol. 1995, 33: 1270-1277.
- Kakar N., Asmatullah A., Rehman H. U., Ashraf M. & Ullah A. Assessment of newer commercial serological (ICT) test for the diagnosis of active pulmonary tuberculosis in TB endemic areas. I.O.S.R.-J.P.B.S. 2014, 9: 98-102.
- Kennedy H.E., Welsh M.D., Bryson D.G., Cassidy J.P., Forster F.I., Howard C. J., Collins R.A. & Pollock J.M. Modulation of immune responses to M. bovis in cattle depleted of δγ WC1+ T Cells. Infect. Immun. 2002, 70: 1488-1500.
- Kim N., Jang Y., Kim J. K., Ryoo S., Kwon K., Kang S. S., Byeon H. S., Lee H. S., Lim Y. & Kim J. Complete genome sequence of M. bovis clinical strain 1595, isolated from the laryngopharyngeal lymph lode of south korean cattle. Genome Announc. 2015, 3: e01124-15.
- Koo H. C., Park Y. H., Hamilton M. J., Barrington G. M., Davies C. J., Kim J. B., Dahl J. L., Waters W. R. & 18. Davis W. C. Analysis of the immune response to M. avium subsp. para-tuberculosis in experimentally infected calves. Infect. Immun. 2004, 72: 6870-6883.
- Lasserre M., Berná L., Greif G., Díaz-Viraqué F., Iraola G., Naya H., Castro-Ramos M., Juambeltz A. & Robello C. Whole-Genome sequences of M. bovis strain MbURU-001, isolated from fresh bovine infected samples. Genome Announc. 2015, 3: e01237-15.
- Lyashchenko K. P., Greenwald R., Esfandiari J., O’Brien D. J., Schmitt S. M., Palmer M. V. & Waters W. R. Rapid detection of serum Antibody by dual-path platform VetTB assay in white-tailed deer infected with M. bovis. Clin. Vaccine Immunol. 2013, 20: 907-911.
- Maas M., Michel A. L. & Rutten V. P. Facts and dilemmas in diagnosis of tuberculosis in wildlife. Comp. Immunol. Microbiol. Infect. Dis. 2013, 36: 269-285.
- Mackie A. M. & McCartney P. Practical medical microbiology. Churchill liming stone, Medical Division of Longman. Group UK. Limited. 1989.
- Office of International Epizootics. Bovine tuberculosis. OIE Manual of standards for diagnostic tests and vaccines. 2004, 5th edn. pp 451-463.
- Ramadan H., El-Gohary A., Mohamed A. & Nasr E. A. Detection of M. bovis and M. tuberculosis from clinical samples by conventional and molecular techniques in Egypt. Global Veterinaria. 2012, 9: 648-654.
- Sardella I.G., Singh M., Kumpfer S., Heringer R.R., Saad M.H. & Sohler M.P. Evaluation of Lionex TB kits and mycobacterial antigens for IgG and IgA detection in cerebrospinal fluid from tuberculosis meningitis patients. Mem. Inst. Oswaldo Cruz. 2010, 105: 722-728.
- Shereen A. M., Sobhy G. & El- Maghraby A. S. Assessment of routine and detailed inspection of tuberculous lesions in tuberculin reactor cattle. Intern. J. Microbiol. Res. 2015, 6: 155-159.
- Simmon K. E., Brown-Elliott, B. A., Ridge, P. G., Durtschi, J. D., Mann E. S., Slechta L.B., Steigerwalt A.G., Moser B.D., Whitney A.M., Brown J.M., Voelkerding K.V., McGowan K.L., Reilly A.F., Kirn T.J., Butler W.R., Edelstein P.H., Wallace R.J. & Petti C. A. M. chelonae-abscessus complex associated with sinopulmonary disease, North-eastern USA. Emerg. Infect. Dis. 2011, 17: 1692-1700.
- Stewart L. D., McNair J., McCallan L., Gordon A. & Grant I. R. Improved detection of M. bovis Infection in bovine lymph node tissue using Immunomagnetic Separation (IMS)-based methods. Plos One. 2013, 8: e58374.
- Supply P., Allix C., Lesjean S., Cardoso-Oelemann M., Rüsch-Gerdes S., Willery E., Savine E. & De Haas P. Proposal for standardization of optimized mycobacterial interspersed repetitive unit-variable-number tandem repeat typing of Mycobacterium tuberculosis. J. Clin. Microbiol. 2006, 4: 4498-4510.
- Tanner M., Inlameia O., Michel A., Maxlhuza G., Pondja A., Fafetine J., Macucuule B., Zacarias M.,Manguele J.,Moiane I.C., Marranagumbe A.S., Mulandane F., Schoenfeld C., Moser I., Van Helden P. & Machado A. Bovine tuberculosis and brucellosis in cattle and African buffalo in the Limpopo National Park, Mozambique. Transbound Emerg. Dis. 2015, 62: 632-638.
- Thacker T.C., Robbe-Austerman S., Harris B., Van Palmer M. & Waters W. R. Isolation of mycobacteria from clinical samples collected in the United States from 2004 to 2011. BMC Vet. Res. 2013, 249: 100.
- Waters W.R., Palmer M.V., Thacker T.C., Davis W.C., Sreevatsan S., Coussens P., Meade K.G., Hope J.C. & Estes D.M. Tuberculosis immunity: Opportunities from studies with cattle. Clin. Dev. Immunol. 2011, 11: 768542.
Relevant Topics
- Biomolecular Structure and Function
- Cell Biology Junctions
- Cell Biology Techniques
- Cell Cycle
- Cell Death: Apoptosis
- Cell Regeneration
- Cell synthesis
- Cellular and Molecular Biology
- Cellular Biology
- Cellular DNA Studies
- Cellular Dynamics
- Cellular Signalling
- Gene Expression and Regulation
- Methods and Techniques in Molecular Biology
- Molecular Biochemistry
- Molecular Biotechnology
- Molecular Cell
- Molecular Genetics
- Stem Cell Biology
Recommended Journals
- Air and Water Borne Diseases
- Cellular and Molecular Biology
- Archives of Parasitology
- Archives of Science
- Biochemistry & Physiology: Open Acess
- Clinical Pharmacology & Biopharmaceutics
- Diagnostic Pathology: Open Access
- Diagnostic Pathology: Open Access
- Epidemiology: Open Access
- Epidemiology: Open Access
- Journal of Biochemistry and Cell Biology
- Journal of Cell Biology & Immunology
- Journal Cell Science and Apoptosis
Article Tools
Article Usage
- Total views: 12353
- [From(publication date):
August-2016 - Apr 05, 2025] - Breakdown by view type
- HTML page views : 11355
- PDF downloads : 998
