Comparative Study on Seasonal Variations in Hydrobiological Parameters of Gagan River
Received: 22-Oct-2018 / Accepted Date: 12-Nov-2018 / Published Date: 19-Nov-2018 DOI: 10.4172/2573-458X.1000167
Abstract
With the help of hydrobiolological kit and standard chemical methods, various hydrobiological parameters such as pH, BOD, COD, DO and TDS were analysed at Moradabad and nearby areas. The experiments were carried out during 3 seasons (rainy, winter and summer) in year between 2017-2018. The COD values were found ranging from 45 mg/l to 69.5 mg/l, BOD ranged from 18.02 mg/l to 46 mg/l, DO was 1.6 mg/l to 7.65 mg/l and TDS ranging in between 35.5 mg/l to 295 mg/l. The effect of these parameters is not only devastating to people, but also to animals, fish and birds. Polluted water is unsuitable for drinking recreation and agriculture purposes.
Keywords: Water; Industrialization; Global scale; Domestic discharge
Introduction
The demand of water has been increasing tremendously due to increasing industrialization and exploding population. Total amount of water on earth is constant. It is fascinating fact that only 0.01% of total water on earth is in atmosphere. On a global scale, total abundance of water is not the problem; the problem is water’s availability in the right place at the right time and in the right form [1]. Today with the unthoughtful use of water many countries located in arid and semiarid regions have started facing the problem of water crisis because total global population is increasing. Water requirements are steadily increasing and on the other hand, per capita water available on earth is limited.
Today the easy availability of pure water is a major problem. As 80% of our rivers are polluted due to industrial and domestic discharge. With increasing pollution problem in water, availability of pure water is decreasing at a greater rate [2]. Today very rare or no has been spared from industrial discharge. The untreated industrial discharge increases the water pollutants. High BOD, acidity alkalinity, hardness, heavy metals makes the water unfit for human consumption. Organic water from domestic water causes problem of eutrophication, so makes water unsuitable for consumption. Most of the cities of India are facing water crisis and availability of freshwater for human consumption becomes a dream [3-5]. Today it is estimated that about 15-20 lit of water is consumes/person /day and after used by particular person it becomes sewage or waste water. Sewage water includes all he water comes from houses used for washing of toilet wastes while waste water includes the industrial discharges.
Water industry introduced a rapid entry of new technologies for water purification; some of them are membrane filtration, advanced oxidation, ion exchange and biological filtration. Membrane filtration technology is vigorously becoming accepted in the water treatment industry. Low pressure membrane (MF and UF) is now replacing conventional filtration for surface water treatment at several locations [6]. High pressure membrane filtration (both NF and RO) is primarily used for softening and TDS reduction but is being evaluated for the removal of natural organic matter in water treatment [7]. Advanced Oxidation Technologies (AOPs) a process that produces hydroxyl radicals (OH) for the oxidation of organic and inorganic water impurities. AOPs can have multiple uses in water treatment e.g., oxidation of synthetic organic chemicals, color, taste and odour causing compounds. Ion exchange technology- its use has been limited to water softening (Ca2+, Mg2+ removal). The technology is commonly designed like a fixed bed process in which a synthetic resin is packed. As water passes through the bed, contaminant ions present in the water are exchanged with ions on the resin surface. Thus removing the contaminant ions from the water [8].
Method And Material
The samples of water were collected from Gagan river at different sites in different seasons for a period of one year from august 2017 to April 2018 for physic-chemical and biological analysis [9-11]. Water samples were collected in polythene bags. Transparency, temperature were recorded on the spot itself. For the guesstimaton of BOD and DO the samples were fixed on the spot. Later, the illustrations were going from the laboratory for the estimation of DO and for other chemical parameters. Then finally we got results that calculated by taking 3 consecutive readings by titrimetric analysis.
Parameters for water analysis
| Parameters | Site 1 | Site 2 | Site 3 | Site 4 | Site 5 | ||||||||||
|---|---|---|---|---|---|---|---|---|---|---|---|---|---|---|---|
| Summer | Rainy | Winter | Summer | Rainy | Winter | Summer | Rainy | Winter | Summer | Rainy | Winter | Summer | Rainy | Winter | |
| Temperature | 34.5 | 29.7 | 21 | 33 | 30 | 20 | 33.5 | 31.6 | 18.75 | 28.5 | 27.2 | 18 | 34 | 31.7 | 20 |
| Transparency (cm) | 15.1 | 22.6 | 14.13 | 15.22 | 14.25 | 17.88 | 13.76 | 10.13 | 15.375 | 17.02 | 19.5 | 11.1 | 15.02 | 18.875 | 13.285 |
| pH | 7.64 | 8.28 | 8.345 | 7.385 | 7.59 | 7.89 | 7.575 | 6.54 | 7.525 | 6.625 | 7.81 | 7.88 | 7.785 | 7.845 | 7.855 |
| Total Biomass (mg/l) | 1.58 | 3.01 | 6.638 | 4.104 | 3.909 | 11.34 | 3.199 | 4.833 | 7.0215 | 4.36 | 2.903 | 4.361 | 4.198 | 3.781 | 7.188 |
| TDS (mg/l) | 121 | 295 | 276 | 202.5 | 236 | 215 | 173.5 | 245 | 218.5 | 105.5 | 197 | 182 | 35.5 | 59 | 55 |
| DO (mg/l) | 6.25 | 6.21 | 2.15 | 6.75 | 3.2 | 6.15 | 5.45 | 1.75 | 6.55 | 6.35 | 2.05 | 5.45 | 7.65 | 1.6 | 7.1 |
| BOD (mg/l) | 18.2 | 22.1 | 24.25 | 26 | 30 | 18.02 | 43.3 | 46.5 | 29.1 | 37.9 | 44 | 39.5 | 32.5 | 38 | 35.5 |
| COD (mg/l) | 65 | 68.5 | 69.5 | 49.6 | 45.5 | 56.5 | 63 | 56 | 65.5 | 48.5 | 60.5 | 55.5 | 45 | 56 | 53 |
| E.C. (µmoh/cm) | 595 | 268 | 310 | 750 | 520 | 390 | 802 | 535 | 455 | 936 | 445 | 560 | 836 | 475 | 485 |
| Turbidity (NTU) | 135 | 125 | 870 | 120 | 210 | 525 | 150 | 360 | 915 | 90 | 630 | 765 | 150 | 50 | 465 |
| Alkalinity (mg/l) | 263 | 235 | 230 | 317 | 250 | 247.5 | 431 | 255 | 257.5 | 500 | 267.5 | 242.5 | 502 | 265 | 227.5 |
| Calcium (mg/l) | 10.02 | 14.5 | 14.03 | 16.03 | 29.058 | 10.02 | 20.04 | 15.03 | 14.028 | 22.04 | 19.038 | 10.028 | 16.032 | 20.038 | 14.028 |
| Nitrate (mg/l) | 1.01 | 2.31 | 0.77 | 0.815 | 2.225 | 0.515 | 1.4 | 1.9 | 0.9325 | 0.815 | 1.235 | 0.65 | 1.06 | 2.065 | 0.825 |
| Color | Dirty white | Almost transparent | translucent | Almost black | Off white | Light yellow | Almost black | Off white | Light yellow | Almost black | Off white | Mild grey | Almost black | Off white | Mild grey |
Table 1: Parameters for water analysis.
A) Physicochemical analysis of:
1. Color by direct method
2. Temperature by mercury thermometer method
3. Transparency by secchii disk method
4. Alkalinity by physical method
5. pH by pH meter
6. Turbidity by Turbidity meter
7. Electrical conductivity by EC meter
8. Biological Oxygen Demand (BOD) by 5 days incubation method
9. Dissolved Oxygen (DO) by Titration method
10. Chemical Oxygen Demand (COD by Dichromate titration method
11. Total Dissolved Solids (TDS) by Gravimetric method after filtration
12. Calcium (Ca2+) by EDTA titrametric method
13. Nitrate (NO3-) by Ion selective electrode method B) Total Biomass
Result And Discussion
Temperature
Water temperature is a physical property which expresses the hotness or coldness of sample. Water temperature may be defined as “abiotic master factor”. Water temperature greatly influenced the metabolic, physiological activities and life process such as-feeding, reproduction, movement, distribution of aquatic surface water. In the present investigation the maximum value of temperature i.e. 34.5 was recorded at site 1 in summer season and the minimum value i.e. 18.75 was recorded at site 3 in winter season Figure 1.
Transparency
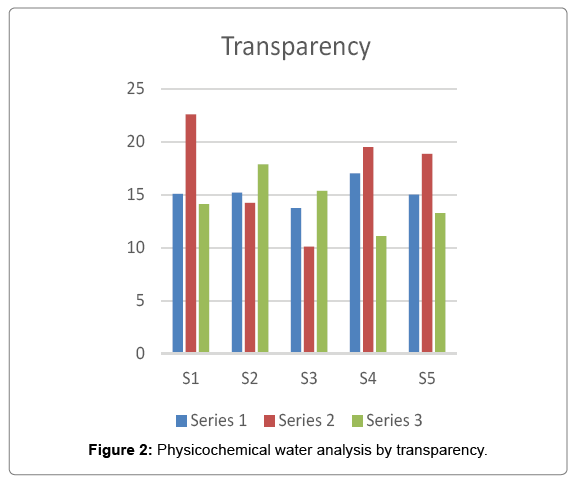
It is the property of clearence of water. The clearer the water, the deeper the sunlight penetrate for zooplankton and phyto planktons. The age of the micro-organisms depend on it. The condition of being clearer or transparent is the Transparency. In the present investigation the maximum value of transparency i.e. 22.6 was recorded at site 1 in rainy season and the minimum value i.e. 10.125 was recorded at site 3 in rainy season Figure 2.
pH
Power of hydrogen is pH and pH is defined as the negative log of H ion concentration in water and waste water. It is the measurement of hydrogen ion in a solution. The variation in pH is an important parameter because most of the aquatic organisms can survive on an average pH and if any change occurs in pH, organisms cannot stand with abrupt change in pH In the present investigation the maximum value of pH i.e. 8.345 was recorded at site 1 in winter season and the minimum value i.e. 6.54 was recorded at site 3 in rainy season Figure 3.
Alkalinity
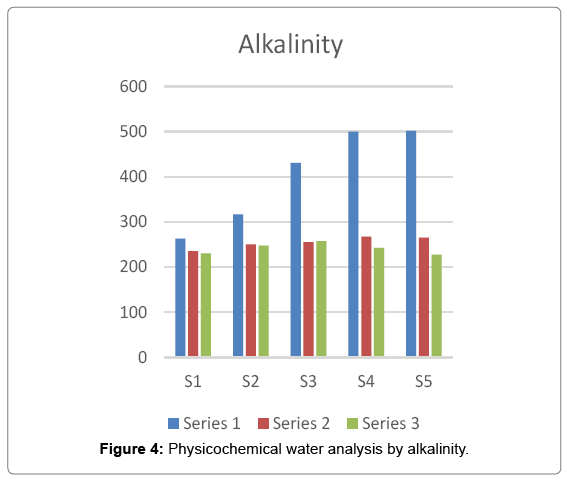
In most natural surface and ground water, alkalinity is derived from dissolution of carbonate minerals and from CO2 present in the atmosphere. Alkalinity is a way of measurement of acid neutralizing capacity of water. It is primarily a measure of water buffering capacity or the ability to resist changes in pH after addition of acids or bases. In the present investigation the maximum value of alkalinity i.e. 502 was recorded at site 5 in summer season and the minimum value i.e. 227.5 was recorded at site 5 in winter season Figure 4.
Conductivity
Conductivity is directly related to the concentration of ions in water. It is the measurement of the ability of water to pass an electric current. It is affected by the amount of inorganic dissolved solids present such as chloride, nitrate, sulfate, calcium etc. In the present investigation the maximum value of alkalinity i.e. 502 was recorded at site 5 in summer season and the minimum value i.e. 227.5 was recorded at site 5 in winter season Figure 5.
Turbidity
Turbidity is the cloudiness of water due to the presence of a huge amount of dispersed and suspended solids that are generally not visible by naked eyes. These solids (clay, matter, slit, algae, and other micro-organisms) obstruct the path of transmittence of light through a sample. In the present investigation the maximum value of turbidity i.e. 915 was recorded at site 3 in winter season and the minimum value i.e. 50 was recorded at site 5 in rainy season Figure 6.
Total dissolved solids
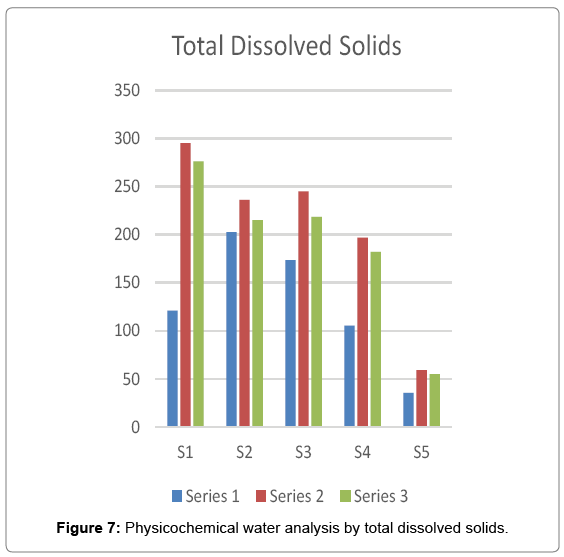
All organic and inorganic substances present in water that can pass through a 2 μ filter are defined as TDS. The sum of cation and anion present in water known as TDS. 500 mg/l is safe from almost all inorganic constituents. If TDS is above 500 mg/l then water should be identified, quantified and evaluated. The solid remaining in water sample is TDS. In the present investigation the maximum value of TDS i.e. 295 was recorded at site 1 in rainy season and the minimum value i.e. 35.5 was recorded at site 5 in summer season Figure 7.
Nitrate (NO3-)
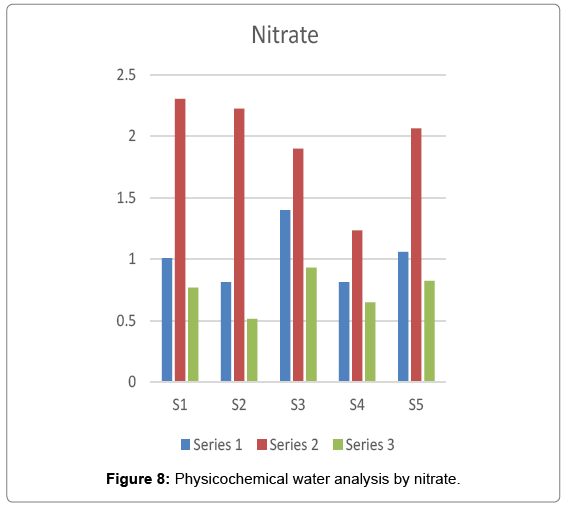
It is the highest oxidized form of nitrogen and best parameter to check the organic pollution. Nitrogenous substances is the major substance in domestic sewage. It is an essential source of Nitrogen in plants. The value of nitrate is 10 mg/l is safe for drinking purpose. Above this value cause potentially fatal blood disorder in infants under six month of age called methemoglobinemia or blue-baby syndrome in which there is a reduction in the oxygen carrying capacity of blood. Nitrate is an essential source of nitrogen for plants. It is chemically nonreactive but it can be reduced by microbial action. In the present investigation the maximum value of nitrate i.e. 2.305 was recorded at site 1 in rainy season and the minimum value i.e. 515 was recorded at site 2 in winter season Figure 8.
Calcium
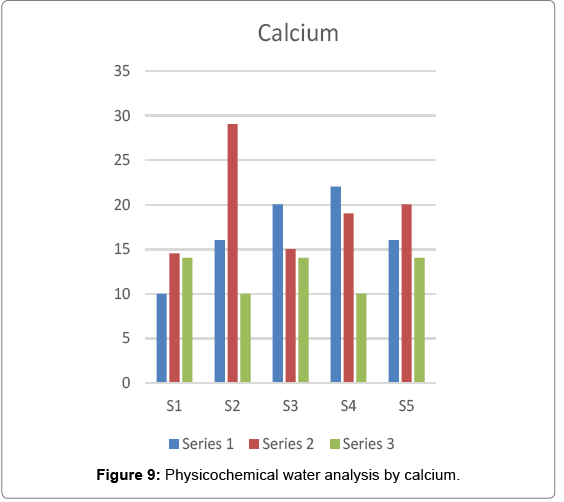
Calcium is an essential component but when one takes large amount of calcium the man it leads negative influence on human health. The lethal dose of oral uptake is about 5-50 mg/kg body weight. Metallic calcium corrodes the skin when it comes in contact with skin, eyes and mucous membrane. In the present investigation the maximum value of calcium i.e. 29.058 was recorded at site 2 in rainy season and the minimum value i.e. 10.02 was recorded at site 1 in summer season Figure 9.
Dissolved oxygen
The amount of gaseous oxygen (O2) dissolved in water is called Dissolved Oxygen dissolves easier in cool water and slower in warm water. Water temperatures directly or indirectly affect the amount of DO. Too much high or too much low level of DO is harmful for aquatic life and it also affect water quality. DO is used by microorganisms for respiration. In the present investigation the maximum value of DO i.e. 7.65 was recorded at site 5 in summer season and the minimum value i.e. 1.6 was recorded at site 5 in rainy season Figure 10.
Biological oxygen demand
BOD is a measure of amount of DO consumed by aerobic biological organisms like bacteria to break organic material present in water at a particular temperature over a period of time. DO used by micro-organisms living in oxygenated water to oxidatively degrade the organic compound releasing energy which is utilized for growth and reproduction. For organic pollution this test is more sensitive. In the present investigation the maximum value of BOD i.e. 46.5 was recorded at site 3 in rainy season and the minimum value i.e. 18.02 was recorded at site 2 in winter season Figure 11.
Chemical oxygen demand
It is a measurement of amount of chemicals in water consumed for oxidation of reduced chemicals in water. It is an indirect method of measurement of amount of organic compound in water. COD measures quantity of organic matter. COD is an indicator of organic pollution in surface water. In the present investigation the maximum value of COD i.e. 69.5 was recorded at site 1 in winter season and the minimum value i.e. 45 was recorded at site 5 in summer season Figure 12.
Total biomass
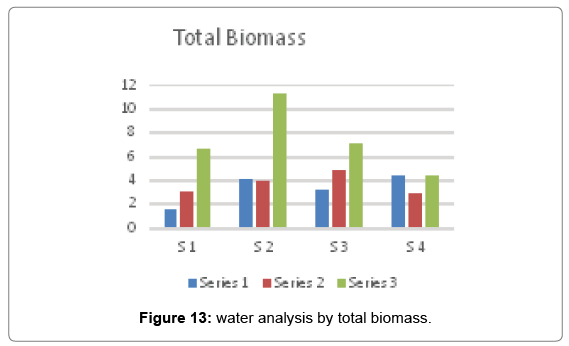
The dry matter of a sample or of an object when completely dried is its biomass. In the present investigation the maximum value of total biomass i.e. 11.339 was recorded at site 2 in winter season and the minimum value i.e. 1.58 was recorded at site 1 in summer season Figure 13.
Color
The color of Gagan River varies greatly in different season. As the season changes from summer to winter by passing through rainy the color of river becomes change from dirty white to translucent.
Conclusion
On the basis of above discussion it may be concluded that the Gagan river is highly contaminated at Moradabad and nearby areas with reference to almost all the water quality physic-chemical parameters studied. Polluted water is unsuitable for drinking, recreation, agriculture, and industry. It is very hazardous to human health. Some proper and effective measures are urgently required to check the level of contamination of Gagan river water to protect the aquatic environment of Gagan River.
References
- Sepehri A, Sarrafzadeh MH (2018) Effect of nitrifiers community on fouling mitigation and nitrification efficiency in a membrane bioreactor. Chemical Engineering and Processing-Process Intensification 128: 10-18.
- Pathak D, Whitehead PG, Futter MN, Sinha R (2018) Water quality assessment and catchment-scale nutrient flux modeling in the Ramganga river basin in North India: An application of INCA model. Sci Total Enviro 632: 201-215.
- Khan MYA, Tian F (2018) Understanding the potential sources and environmental impacts of dissolved and suspended organic carbon in the diversified Ramganga river, Ganges basin India. Proc Int Ass Hydro Sci 379: 61-66.
- Gogi MJ, Majunath NT (2017) Correlation study on physic-chemical analysis of river Bhadra. Int J Innovative Res Sci, Eng Tech 6: 14908-14914.
- Sayeed A, Chandra S, Singh J (2017) Characterization and influence of rainy season on ground water quality of Moradabad city. Int J Adv Res 5: 335-338.
- Yadav P, Bharati DK, Gautam RK (2017) Determination of water quality index and suitability of water bodies in Robertsganj, Sonbhadra district, Uttar Pradesh, India, Asian research consortium. Asian J Res Social Sci Humanities 7: 1-11.
- More RS, Chaubal SS (2017) Evaluation of water quality through studies on the physic chemical characteristics of Mithi River, Mumbai. Asia Pacific J Eng sci Tech 3: 22-27.
- Singh RV, Singh R (2017) Indexing of under groundwater quality in urban area of Moradabad district in Nothern India. IOSR J Applied Chem 10: 58-63.
- Kumar V, Sharma A, Thukral AK, Bhardawaj R (2017) Water quality of river beas India. Current Science 112: 1138-1158.
- Vaishnav S, Sharma D, Saraf A (2017) Estimation of water quality physicochemical and biological parameters of Shivnath river in durg district (Chhattisgarh). Int J Eng Sci Res Tech 6: 288-293.
- Singh R, Rishi M, Sidhu N (2017) Index analysis approach to study the surface water quality of beas river, in Manali and adjacent area, Himachal Pradesh, India. Int J Emerging Tech Adv Eng 7: 382-387.
Citation: Mehnaz B (2018) Comparative Study on Seasonal Variations in Hydrobiological Parameters of Gagan River. Environ Pollut Climate Change 2: 167. DOI: 10.4172/2573-458X.1000167
Copyright: © 2018 Mehnaz B. This is an open-access article distributed under the terms of the Creative Commons Attribution License, which permits unrestricted use, distribution, and reproduction in any medium, provided the original author and source are credited.
Share This Article
Recommended Journals
Open Access Journals
Article Tools
Article Usage
- Total views: 3048
- [From(publication date): 0-2018 - Apr 03, 2025]
- Breakdown by view type
- HTML page views: 2259
- PDF downloads: 789


