Comparative Assessment of Limnochemistry of Dal Lake in Kashmir
Received: 24-Jan-2018 / Accepted Date: 05-Mar-2018 / Published Date: 09-Mar-2018 DOI: 10.4172/2157-7617.1000458
Abstract
A comparative assessment of different water quality parameters of Dal Lake, Kashmir was carried out during 2005 and 2015 in order to assess the changes that have occurred over time. The data was collected from five stations of the Lake during both the years. The results obtained indicate that the water quality of Dal Lake has significantly deteriorated. The different water quality parameters such as dissolved oxygen, chloride, NH4 -N, NO3 -N and total phosphorus showed marked variation from 2005 to 2015 with One Sample t-test showing significant differences (p=0.000) over this period. The NSFWQI ranges from 25-50 for both the years indicating the high pollution level and bad water quality of the Lake. The results of the present comparative investigation reflected increasing nutrient load in the Dal Lake which needs to be monitored for the conservation of Lake ecology.
Keywords: Water quality; Nutrients; Anthropogenic sources; Lake ecology; NSFWQI
Introduction
Aquatic ecosystems especially Lakes are a reflection of the watershed and the topography, soil, geology as well as vegetation determine the kind of materials entering into the Lakes that in turn reflect on the water quality of these ecosystems [1]. In a natural state, aquatic ecosystems are largely controlled by geomorphic and physiographic factors such as geology, geomorphology and hydrology. Centuries of land use has, however, altered the geomorphology and hydrology of many aquatic systems [2]. Such anthropogenic transformation of the catchment area may accelerate the enrichment of nutrients and organic substances of waters, particularly in strongly changed urban landscape [3]. Nutrient enrichment of Lakes is one among the many major environmental problems encountered in the freshwater ecosystems around the world [4]. Though it stimulates the growth of plants (algae as well as higher plants), nutrient enrichment ultimately leads to deterioration of water quality and degradation of the entire ecosystem [5]. The process of nutrient enrichment is accelerated by the human activities in and around the freshwater ecosystems [5,6]. The chemistry of Lake Water is a cumulative reflection of catchment geology, weathering and erosional processes as well as anthropogenic inputs.
Lake ecosystems have been used to study a number of processes that are important in understanding limnological processes and chemical exchange between water and sediments. These ecosystems act as vessels for storing nutrients and sediments from flooding waters as well as surface runoff, thereby reducing the risk of eutrophication of other natural waters like streams and rivers. In present times, the aquatic ecosystems world-wide are being severely altered or destroyed by intensified agricultural practices and other developmental activities at a rate greater than ever known in the human history [7-9]. The activities of the continuously increasing population are causing changes in the Lake ecosystems which challenge the protection of these ecosystems and their use for ecosystem services [10-12]. Most urban and rural Lakes around the world have vanished under the pressure of cultural eutrophication and have led to worldwide environmental concerns [13]. In those Lakes which could endure, drinking water supply has been substantially reduced or become totally non-potable and/or flood absorption capacity is impaired and biodiversity is threatened besides the diminished fish production [14].
The state of Jammu and Kashmir (Lat. 32° 44'N, Long. 74° 54'E) is endowed with a number of lentic and lotic water bodies situated at varying altitudes from 1600 to 4500 (m.a.s.l). The fresh water ecosystems of the state are different in character and exhibit various degrees of trophic evolution, ranging from oligotrophy, through mesotrophy to eutrophy. The Dal Lake situated to the north-east of Srinagar city, is one of the main elements that makes the valley of Kashmir an important and famous tourist resort. This Lake has, since ancient times, been the centre of Kashmiri civilization and has played an important role in the state economy through its attraction of tourists as well as its utilization as a source of food and water. The Lake is under tremendous anthropogenic pressure for the last three decades. The sewage and agricultural runoff from in and around the Lake are directly emptied into it. Moreover, faecal matter from the house-boats located in different basins of the Lake is disposed into the Lake bed. The cumulative impact of these human interferences has resulted in significant alterations to the entire Lake ecosystem. The Lake is moving towards dystrophy due to accelerated nutrient enrichments from different sources. Such activities have resulted in the deterioration of water quality, prolific growth of aquatic macrophytes and siltation. Keeping in view the above cited situation, the present investigation was undertaken to assess the changes in the water chemistry over a period of one decade during 2005-2015.
Materials and Methods
Study area and study sites
The Dal Lake (Lat. 34°-06'N, 74°-45'E) is an urban Lake that lies to the east of Srinagar city, at the foot of Zabarwan Hills, and is situated at an average elevation of 1583 m above mean sea level. Five sampling sites were selected for the determination of various physico-chemical parameters of water in four basins of Dal Lake (Figure 1). The sampling was carried out from January-November on a bimonthly basis during 2005 and 2015.
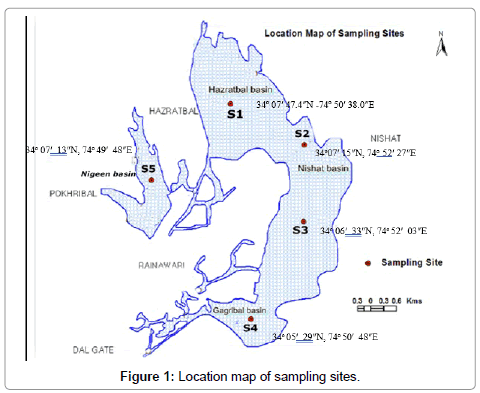
Figure 1: Location map of sampling sites.
Physico-chemical features of water
The samples for physico-chemical characteristics of water were collected on bimonthly basis and were analysed as per the methods described by the Council for Scientific and Industrial Research as per CSIR in 1974 and American Public Health Association [15]. Water temperature was recorded on the spot with Celsius mercury thermometer calibrated up to 0.1°C, whereas samples for dissolved oxygen were fixed on-spot in accordance with the Azide modification of Winkler’s method. Calcium, magnesium, chloride, ammonicalnitrogen and total phosphorus were analysed as per methods given in APHA while nitrate-nitrogen was determined by salicylate method as per CSIR [16]. One sample t-test was done by using statistical software SPSS version 16.
NSF Water Quality Index (NSFWQI)
In order to calculate National Sanitation Foundation (NSF) Water Quality Index, results of five parameters (pH, Temperature, Dissolved Oxygen, Total Phosphorus and Nitrate) were transferred to the weighting curve for each parameter and Quality value (Qi) was obtained. The Qi value obtained was then multiplied by a weighting factor (Wi) for each parameter based on its importance in water quality. The results obtained were then added to arrive at an overall water quality index (WQI). The Water Quality Index was then compared to the WQI ranges defined by Brown et al. [17].
Results
Physico-chemical parameters of water were analyzed and assessed in order compare the variations of the various parameters in the Lake system. The data collected on bi-monthly basis during 2005 and 2015 at the selected sampling stations is depicted in Table 1 with mean and standard deviation values (SD ±). The range values of both investigations during 2005 and 2015 are presented in Table 2. The bimonthly as well as range values reflect the changes in the different physico-chemical parameters that have occurred over a period from 2005-2015.
| 2005 | 2015 | ||||||||||||||||
|---|---|---|---|---|---|---|---|---|---|---|---|---|---|---|---|---|---|
| Parameters | Sites | January | March | May | July | September | November | Mean | SD± | January | March | May | July | September | November | Mean | SD± |
| Water temperature (°C) | S1 | 6 | 12 | 17 | 25 | 19 | 9 | 15 | 7 | 6 | 10.5 | 12.6 | 24 | 16 | 1 | 12 | 8 |
| S2 | 6 | 14 | 19 | 26 | 22 | 5 | 15 | 8.6 | 5.3 | 8.5 | 14.5 | 23 | 15.8 | 4 | 12 | 7.2 | |
| S3 | 4 | 15 | 18 | 24 | 20 | 6 | 15 | 7.9 | 5.2 | 8.6 | 16 | 25.5 | 13.8 | 2.75 | 12 | 8.3 | |
| S4 | 6 | 16 | 19 | 26 | 21 | 6 | 16 | 8.2 | 5 | 8.9 | 16.3 | 17 | 11 | 1.5 | 10 | 6.1 | |
| S5 | 6 | 13 | 19 | 27 | 24 | 8 | 16 | 8.6 | 5 | 8 | 15.9 | 18 | 9.5 | 4.5 | 10 | 5.6 | |
| Depth (m) | S1 | 2.2 | 3.3 | 3.7 | 3.2 | 2 | 1.9 | 3 | 0.8 | 1 | 2.7 | 1 | 1.3 | 1 | 1 | 1 | 0.7 |
| S2 | 1.2 | 1.9 | 2.3 | 2 | 1 | 0.8 | 2 | 0.6 | 4 | 2.9 | 2.5 | 2.5 | 4 | 2.9 | 1 | 0.7 | |
| S3 | 1.8 | 2.8 | 2.7 | 2.2 | 2 | 1.5 | 2 | 0.5 | 2.5 | 1.2 | 1.8 | 3 | 1 | 2.2 | 2 | 0.8 | |
| S4 | 1.7 | 1.9 | 2.8 | 2.4 | 1.8 | 1.5 | 2 | 0.5 | 0.5 | 1 | 1.3 | 0.5 | 0.5 | 1.3 | 1 | 0.4 | |
| S5 | 3.2 | 3.5 | 4.5 | 3.5 | 3.5 | 3 | 4 | 0.5 | 3 | 2.8 | 2.3 | 2.4 | 2.5 | 2 | 3 | 0.4 | |
| pH | S1 | 7.6 | 8.4 | 8.5 | 8.54 | 8.21 | 7.48 | 8 | 0.5 | 7.6 | 7.5 | 7.6 | 7.5 | 6.8 | 6.9 | 7 | 0.4 |
| S2 | 7.85 | 8.55 | 8.79 | 8.05 | 8.37 | 7.58 | 8 | 0.5 | 7.5 | 7 | 7 | 7.6 | 7 | 7 | 7 | 0.3 | |
| S3 | 8.73 | 8.44 | 8.69 | 8.88 | 8.74 | 7.99 | 9 | 0.3 | 7.8 | 8.5 | 7.5 | 7.2 | 7.6 | 7.3 | 8 | 0.5 | |
| S4 | 8.6 | 8.65 | 8.81 | 8.51 | 8.71 | 8.43 | 9 | 0.1 | 8 | 7.5 | 7.6 | 7.2 | 7 | 7.4 | 7 | 0.3 | |
| S5 | 7.7 | 8.29 | 9.45 | 9.2 | 8.89 | 7.95 | 9 | 0.7 | 7 | 8.2 | 8.3 | 8.1 | 7 | 7.5 | 8 | 0.6 | |
| Conductivity (µs) | S1 | 239 | 223 | 228 | 226 | 173 | 279 | 228 | 34 | 230 | 210 | 340 | 200 | 245 | 220 | 241 | 51 |
| S2 | 296 | 104 | 220 | 275 | 161 | 206 | 210 | 71.2 | 200 | 200 | 120 | 180 | 200 | 190 | 182 | 31 | |
| S3 | 172 | 118 | 222 | 228 | 142 | 168 | 175 | 43.4 | 200 | 210 | 360 | 240 | 180 | 190 | 230 | 67 | |
| S4 | 150 | 128 | 216 | 219 | 127 | 168 | 168 | 41.3 | 180 | 200 | 380 | 220 | 195 | 180 | 226 | 77 | |
| S5 | 281 | 393 | 210 | 315 | 233 | 161 | 266 | 82.5 | 110 | 124 | 160 | 120 | 160 | 200 | 146 | 34 | |
| Dissolved oxygen (mg/l) | S1 | 11.2 | 10 | 9.2 | 11.2 | 2.2 | 8.8 | 9 | 3.4 | 3 | 6.4 | 3 | 4 | 6 | 6.8 | 5 | 1.7 |
| S2 | 12 | 7 | 9.4 | 7.6 | 5 | 10.8 | 9 | 2.6 | 5 | 5 | 6 | 6 | 6 | 6 | 6 | 0.5 | |
| S3 | 10.2 | 11.2 | 10.2 | 8.8 | 5.6 | 11.2 | 10 | 2.1 | 4 | 8 | 4.4 | 3 | 4.4 | 4.4 | 5 | 1.7 | |
| S4 | 8.4 | 10.2 | 9 | 7.6 | 4.8 | 7.2 | 8 | 1.8 | 4 | 4 | 4 | 4 | 3 | 2.4 | 4 | 0.7 | |
| S5 | 10.8 | 11.2 | 11.2 | 11.9 | 4 | 8.8 | 10 | 3 | 4 | 6.8 | 6.6 | 4 | 4.8 | 6.2 | 5 | 1.3 | |
| Chloride (mg/l) | S1 | 18 | 26 | 13 | 26 | 10 | 14 | 18 | 6.8 | 20 | 30 | 17 | 33 | 15 | 19 | 22 | 7.4 |
| S2 | 30 | 14 | 12 | 20 | 12 | 16 | 17 | 6.9 | 32 | 22 | 16 | 14 | 27 | 20 | 22 | 6.8 | |
| S3 | 26 | 21 | 15 | 19 | 14 | 14 | 18 | 4.8 | 32 | 27 | 22 | 17 | 18 | 20 | 23 | 5.8 | |
| S4 | 17 | 22 | 31 | 21 | 14 | 16 | 20 | 6.1 | 21 | 28 | 34 | 28 | 21 | 25 | 26 | 5 | |
| S5 | 30 | 36 | 22 | 25 | 18 | 22 | 26 | 6.5 | 33 | 38 | 27 | 29 | 23 | 27 | 30 | 5.3 | |
| Ca2+ (mg/l) | S1 | 32 | 24 | 28 | 18 | 70 | 72 | 41 | 23.9 | 55 | 46 | 36 | 43 | 23 | 28 | 39 | 12 |
| S2 | 33 | 24 | 18 | 25 | 68.8 | 33 | 34 | 18.2 | 45 | 47 | 42 | 54 | 8 | 16 | 35 | 19 | |
| S3 | 28 | 24 | 31 | 24 | 48 | 54 | 35 | 12.9 | 41 | 46 | 38 | 39 | 11 | 18 | 32 | 14 | |
| S4 | 28 | 31 | 26 | 14 | 32 | 38 | 28 | 8 | 41 | 46 | 41 | 40 | 13 | 12 | 32 | 15 | |
| S5 | 42 | 42 | 22 | 16 | 74.4 | 68 | 44 | 23.6 | 24 | 19 | 38 | 25 | 9 | 13 | 21 | 10 | |
| Mg2+ (mg/l) | S1 | 17 | 11 | 4 | 14 | 11 | 26 | 14 | 7.4 | 15 | 12 | 7 | 86 | 7 | 6 | 22 | 29 |
| S2 | 13 | 7 | 5 | 10 | 17 | 27 | 13 | 8 | 12 | 12 | 9 | 12 | 9 | 9 | 11 | 1.5 | |
| S3 | 19 | 12 | 6 | 10 | 14 | 16 | 13 | 4.6 | 10 | 12 | 6 | 22 | 8 | 6 | 11 | 5.5 | |
| S4 | 16 | 14 | 10 | 11 | 11 | 15 | 13 | 2.5 | 11 | 14 | 7 | 37 | 6 | 7 | 14 | 11 | |
| S5 | 23 | 17 | 8 | 17 | 20 | 28 | 19 | 6.7 | 7 | 17 | 4 | 11 | 1 | 1 | 7 | 5.7 | |
| Ammonia (µg/l) | S1 | 110 | 70 | 240 | 114 | 152 | 160 | 141 | 58.3 | 122 | 110 | 260 | 282 | 280 | 120 | 196 | 86 |
| S2 | 320 | 230 | 218 | 82 | 80 | 126 | 176 | 95.9 | 347 | 300 | 235 | 320 | 315 | 220 | 290 | 51 | |
| S3 | 500 | 170 | 198 | 108 | 90 | 122 | 198 | 153.3 | 389 | 175 | 231 | 375 | 140 | 130 | 240 | 116 | |
| S4 | 400 | 170 | 240 | 106 | 110 | 160 | 198 | 110.5 | 431 | 245 | 223 | 358 | 160 | 220 | 273 | 101 | |
| S5 | 160 | 82 | 290 | 79 | 176 | 182 | 162 | 77.8 | 200 | 234 | 210 | 308 | 107 | 100 | 193 | 79 | |
| Nitrates (µg/l) | S1 | 80 | 325 | 160 | 115 | 500 | 130 | 218 | 162.3 | 285 | 1200 | 680 | 55 | 440 | 280 | 490 | 404 |
| S2 | 260 | 352 | 110 | 92 | 580 | 115 | 252 | 190.9 | 290 | 455 | 320 | 145 | 375 | 140 | 288 | 126 | |
| S3 | 106 | 450 | 225 | 91 | 385 | 95 | 225 | 158.3 | 255 | 600 | 1430 | 100 | 60 | 58 | 417 | 537 | |
| S4 | 93 | 165 | 285 | 102 | 550 | 100 | 216 | 179.2 | 145 | 145 | 1250 | 230 | 280 | 85 | 356 | 443 | |
| S5 | 350 | 380 | 155 | 93 | 380 | 240 | 266 | 123.3 | 370 | 330 | 325 | 300 | 525 | 250 | 350 | 94 | |
| Total phosphorus (µg/l) | S1 | 123 | 144 | 240 | 152 | 56 | 216 | 155 | 66.2 | 127 | 288 | 260 | 166 | 200 | 220 | 210 | 59 |
| S2 | 126 | 260 | 216 | 120 | 212 | 108 | 174 | 63.5 | 200 | 230 | 230 | 200 | 200 | 180 | 207 | 20 | |
| S3 | 148 | 172 | 132 | 144 | 136 | 212 | 157 | 30.2 | 210 | 260 | 230 | 185 | 160 | 190 | 206 | 36 | |
| S4 | 196 | 144 | 248 | 118 | 125 | 176 | 168 | 49.3 | 220 | 230 | 220 | 286 | 230 | 225 | 235 | 25 | |
| S5 | 152 | 184 | 164 | 148 | 127 | 196 | 162 | 25.2 | 165 | 200 | 168 | 190 | 160 | 143 | 171 | 21 | |
Table 1: Bi-monthly values of various physico-chemical parameters of water of Dal Lake during 2005 and 2015.
As is evident in Table 2, the overall range values depicted that conductivity, chloride, NH4-N, NO3-N and total phosphorus showed significant increase in concentrations while dissolved oxygen observed a declining trend. The range values of water temperature did not depict Figure 1: Location map of sampling sites. any marked variation between 2005 and 2015.
| Parameters | 2005 | 2015 | ||
|---|---|---|---|---|
| Min | Max | Min | Max | |
| Water temperature (°C) | 4 | 26 | 1 | 26 |
| Depth (m) | 0.8 | 3.7 | 0.5 | 2.9 |
| pH | 7.6 | 9.5 | 6.8 | 8.5 |
| Conductivity (µs) | 104 | 393 | 180 | 380 |
| Dissolved oxygen (mg/l) | 4 | 11.2 | 3 | 8 |
| Chloride (mg/l) | 10 | 36 | 14 | 38 |
| Ca2+ (mg/l) | 14 | 70 | 8 | 54 |
| Mg2+ (mg/l) | 4 | 28 | 1 | 86 |
| Ammonia (µg/l) | 79 | 500 | 110 | 431 |
| Nitrate (µg/l) | 80 | 580 | 58 | 1430 |
| Total phosphorus (µg/l) | 56 | 216 | 143 | 286 |
Table 2: Range values of various physico-chemical parameters of water quality of Dal Lake during 2005 and 2015.
As reflected in Table 3, the NSFWQI values during both the periods (2005 and 2015) fall in the range of 25-50 which is an indication of the bad water quality.
| Parameters | 2005 | 2015 | WQI Ranges (Brown et al., 1970) |
|||||||
|---|---|---|---|---|---|---|---|---|---|---|
| Results | Qi | Wi | QiWi | Test Result | Qi | Wi | QiWi | Range | Quality | |
| pH | 8 | 84 | 0.11 | 9.24 | 7 | 88 | 0.11 | 9.68 | 90-100 | Excellent |
| Change in temp (°C) | 15 | 91 | 0.10 | 9.1 | 11 | 93 | 0.10 | 9.3 | 70-90 | Good |
| DO (% Saturation) | 41.8 | 33 | 0.17 | 5.61 | 32.5 | 21 | 0.17 | 3.57 | 50-70 | Medium |
| Total Phosphorus (mg/L) | 0.163 | 93 | 0.10 | 9.3 | 0.206 | 91 | 0.10 | 9.1 | 25-50 | Bad |
| Nitrate Nitrogen (mg/L) | 0.236 | 97 | 0.10 | 9.7 | 0.38 | 97 | 0.10 | 9.7 | 0-25 | Very bad |
| WQI | 42.95 | WQI | 41.35 | |||||||
| Water Quality | Bad | Water Quality | Bad | |||||||
Table 3: NSF-Water Quality Index (WQI) for different water quality parameters during 2005 and 2015.
While comparing the water quality of the Lake during 2005 and 2015, it was observed that almost each parameter showed wide variations except water temperature in which fewer fluctuations were observed (Figure 2a). In case of depth, the decreasing trend from 2005- 2015 was observed at site-1, site-2, site-4 and site-5 while site-3 showed a slight increase in depth. A significant decrease in depth was recorded at site-1. For depth, the t-test showed significant variation from 2005 to 2015 (Figure 2b). pH was found alkaline at all the sites. Conductivity showed an increased trend at site-1, site-3, and site-4 from 2005-2015 while at site-2 and site-5 it showed a declining trend. The t-test reflected significant variation (P=0.000) in conductivity at all sites during the two study periods (2005 and 2015) (Figure 2c). In the present investigation it was observed that the values for dissolved oxygen depicted significant decline in its concentation during 2015 as compared to 2005 at all sites in the Lake (Figure 2d). During 2005, the minimum dissolved oxygen (8 mg/l) was recorded at site-4 and maximum (10 mg/l) at sites 3 and 4. However, during 2015 the lowest dissolved oxygen concentration (4 mg/l) was again recorded at site-4 while highest concentration (6 mg/l) was recorded at site-2. The t-test reflected a strong significant variation (P=0.000) in dissolved oxygen concentrations in Dal Lake from 2005-2015. The comparative investigation of various physicochemical parameters of Dal Lake showed an increased trend in chloride content at all sites over the period (Figure 2e) which was supported by the significant values of t-test (P= 0.000). It was also observed that calcium and magnessium content showed wide variation at site-1 and site-5 during 2005 and 2015 (Figures 2f and 2g). During 2005, the range values of calcium content fluctuated from 14 mg/l to 70 mg/l as compared to 8 mg/l to 54 mg/l in 2015. The magnesium content also depicted broad variations in range values fluctuating between 4 mg/l- 28 mg/l and 1mg/l- 86 mg/l in 2005 and 2015 respectively.
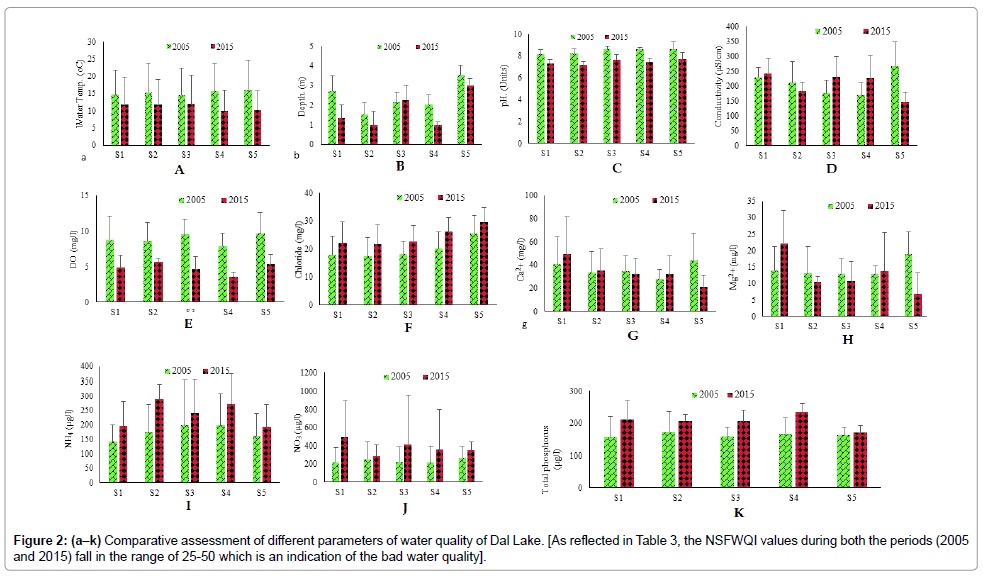
Figure 2(a-k): Comparative assessment of different parameters of water quality of Dal Lake. [As reflected in Table 3, the NSFWQI values during both the periods (2005 and 2015) fall in the range of 25-50 which is an indication of the bad water quality].
The comparative analysis of ammonical nitrogen between 2005 and 2015 depicted increased trend at all sites (Figure 2h) with significant t-test values (P< 0.05). In case of nitrate nitrogen, all the sites exhibited significant increase in the concentration from 2005-2015 (Figures 2i and 2j), which is also supported by the significant values of t-test (P= 0.000). While comparing total phosphorus concentration between 2005 and 2015, it was observed that total phosphorus increased in Dal Lake from 2005 to 2015 almost ateach site (Figure 2k). One sample t-test showed significant differenes (p< 0.05) between the data obtained from 2005 and 2015.
Discussion
The natural Lakes of Kashmir experience varied anthropogenic pressures. This is particularly so in case of Dal Lake. The Lake is of special ecological and socio-economical interest besides being an important tourist attraction. Recently there has been a great concern about the fast deterioration of this Lake ecosystem. The present comparative study depicted an increasing trend from 2005 to 2015 for various water quality parameters such as conductivity, chloride, NH4-N, NO3-N and total phosphorus. It may be due to cumulative impact of all the anthropogenic activities operating in and around the Lake. Water temperature during the present study was observed lowest in winter and highest during summer months. The variations in water temperature may be due to different timings of collection, influence of the season and the effect of atmospheric temperature. In a water body, the depth of water at a particular site is one of the major physical factors which act as a controlling factor for determining the water quality. Depth plays an important role in concentrating ions in water mass, besides being an important determinant for the growth and development of various life forms of vegetation [18]. During the present study the significant decline in depth from 2005-2015 at site 1, 2, 4 and 5 may be attributed to various human induced factors like siltation, unplanned dredging/de-weeding operations, accumulation of de-weeded material, farming activities in floating garden areas (disposal of organic material into Lake bed for manure as well as construction of floating gardens), and direct disposal of solid wastes into the Lake. The decrease in depth in a water body is an indication of evolutionary process and changing its trophic status towards dystrophication [19,20]. pH is an important parameter that determines the suitability of water for various purposes. Although, the pH was alkaline during the present study, however, the values were found to be comparatively lower during 2015 indicating a slight gradual change in the well buffered system which may be attributed to increasing pollution levels in the Lake over the period.
Conductivity has been used for assessing the trophic status of water bodies [21] and has also been regarded as a pollution indicator in shallow Lakes [22]. The conductivity values showed increasing trend from 2005-2015. This might be due to ever increasing anthropogenic inputs of various contaminants in the form of silt, sewage and fertilizers. The high conductivity according to Ramana et al. [23] is due to the large amount of surface runoff containing sediments from the catchment areas having intensive crops and human habitations around. Dissolved oxygen is one of the important parameters in water quality assessment, related to biological activities and trophic status of an aquatic ecosystem. In aquatic systems oxygenation is the result of imbalance between processes of photosynthesis, degradation of organic matter and reaeration coupled with physico-chemical properties of water [24,25]. The significant decline in dissolved oxygen over the period (2005- 2015) might be due to increasing inputs of nutrients which results in luxuriant growth of macrophytes and weeds in the Lake system. The low levels of dissolved oxygen in shallow water bodies may be attributed to the removal of free oxygen through respiration by bacteria and other animals and as well as oxygen demand for macrophytes and for their decomposition Depletion of dissolved oxygen in water probably is the most frequent result of certain forms of water pollution [26]. Chloride is present in nearly all-natural waters with varying concentration, depending on the geochemical conditions of the area. According to Chandrasekhar et al. [27] the presence of chloride concentration in a water body is used as an indicator of organic pollution by domestic sewage. In the present study, higher values of chloride were recorded during 2015 at all sites as compared to 2005. The high concentration of chloride in Dal Lake could be attributed to direct drainage of sewage from houseboats and other human settlements. The sewage discharge in the Lake system is on an increase due to increase in the Dal deweller populations in the Lake interiors as well as increase in number of houseboats from 2005 to 2015. This is in agreement with Blum [28] and Murthuzasab et al. [29] who reported that high chloride content in water bodies could be due to sewage contamination. Thresh et al. [30] related increased chloride to organic pollution of animal origin. In the present investigation, calcium and magnesium content did not show much variation between 2005 and 2015 except at site-1 (Hazratbal basin) and site-5 (Nigeen basin). Higher Ca2+ content in Nigeen and Hazratbal basins may be partly due to increased run off from the catchment area which has predominance of calcareous material. The magnesium content in Hazratbal basin may due to the enhanced agricultural run-off from catchment through Telbal and Boutkol inlets and from floating gardens located in Dal Lake. These findings were in high conformity with the findings of Ishaq and Kaul [31] who reported that higher concentration of both Ca2+ and Mg2+ in Dal Lake can be attributed to their leaching from agricultural soils. They further pointed out that farming procedures followed in the agricultural areas of Telbal sub-catchment are assumed to be responsible. Higher Mg2+ values may be due to release of this cation from macrophytes by decomposition [32,33]. Due to appreciable calcium and magnesium hardness, Dal Lake can be classified as calcium rich [34]. Ca2+ and Mg2+ concentration of freshwater bodies of Kashmir Valley has been associated with thick population of plankton, especially Cyanophyceae [35].
Ammonia in water is produced by microbiological degradation of organic nitrogenous matter. Free ammonia is an important parameter indicating pollution. Surface waters generally have lesser ammonia than bottom waters because it is liberated often from the decomposing organic matter of the Lakes and its release in the deep layers is governed by anoxic conditions [18]. During both the years, ammonical nitrogen showed statistically significant differences between various sites. It is clearly evident from Figure 2i that NH4-N is comparatively higher during 2015. The high ammonical nitrogen concentration in Dal Lake may be attributed to upwelling of bottom ammonical nitrogen to surface by anthropogenic activities viz., dredging and de-weeding operations which were operated at large scale in 2015. According to Wetzel [36] loss of oxidized micro zone at the sediment-water interface under anoxic conditions in hypoliminion releases significant amount of ammonia in overlying waters, thus leading to high concentration of ammonia. Another reason for more amomina nitrogen concentration during 2015 might be due to excessive decomposition of organic wastes and runoffs from floating garden areas as compared to 2005. As per Zuber [37], higher decomposition of organic matter in shallow water bodies accelerates the formation of ammonical nitrogen. Nitrate which is the end product of nitrification and starting point of denitrification is generally present in higher concentrations than nitrite and ammonia. The presence of nitrate in fresh water bodies depends mostly upon the activity of nitrifying bacteria, domestic and organic sources. In the present investigation the values of nitrate nitrogen showed statistically significant differences between the two study periods at all sites. Nitrate-nitrogen depicted marked increased trend from 2005-2015. The high concentration of nitrate-nitrogen during 2015 may be attributed to increasing deweeding and dredging operations. It may also be attributed to rapid fertilizer runoff and direct disposal of untreated sewage from in and around the Lake. The high nitrate concentration in water bodies could be due to leaching and surface run off of nitro-phosphate fertilizers from nearby farm fields into Lake as well as from domestic sewage from barracks being dumped into the Lake [38]. Similar findings by Jeelani and Shah and Bhat et al. [39,40] explain the elevated concentrations of nitrate-nitrogen. Phosphorus is considered to be the critical limiting nutrient, causing eutrophication of fresh water systems [41]. It is a major nutrient that triggers eutrophication and is required by algae in small quantities [42]. Present comparative study depicted strong significant differences between the data obtained during 2005 and 2015. The possible reason might be the increasing levels of eutrophication in the Lake system. The significant increase in total phosphorus from 2005 to 2015 is due to excess runoff from floating gardens as well as from agriculture catchment areas through Telbal and Boutkul streams. Phosphate enters the Lakes through domestic wastewater, accounting for the accelerated eutrophication [43]. Increased concentration of phosphate and nitrate nitrogen in Lakes results in enhanced productivity [44]. The average phosphorus in Dal Lake was recorded as 156 μg/l and as per Welch [45] a water body may be considered as eutrophic if the total phosphorus value ranges between 20-30 μg/l. As per this classification, Dal Lake can be put under eutrophic category.
The results of NSFWQI for Dal Lake waters during both the years are in the range of 25-50 and indicate the bad water quality of the Lake which is further attributed to the continuous inflow of sewage, agricultural run-off and other wastes into the Lake. It also depicts the unsuitable Lake management strategies that are being adopted to restore as well conserve the Lake ecosystem.
Conclusion
The present comparative study on the water quality of Dal Lake concludes that the Lake has been significantly polluted from last few years as a result of direct drainage of sewage, run-off and disposal of solid wastes. Current anthropogenic activities (dredging and deweeding operations, farming activities in and around the Lake) in the Lake are also responsible for its eutrophic status.
The existing situation of the Dal Lake, if not controlled properly, may cause severe ecological harm and lead it to dystrophic status in the near future, As such, attention is invited to look into the management of water quality as well as biological spectrum of the Lake along with the developmental processes and conservation strategies that are in practice in the Lake.
Acknowledgement
The authors extend their acknowledgement to Director, Center of Research and Development, Head, P. G. Environmental Sciences, University of Kashmir and J&K Lakes and waterways Development authority for providing the necessary facilities for carrying out the present work.
References
- Dong JD, Zhang YY, Zhang S, Wang YS, Yang ZH, et al. (2010) Identification of temporal and spatial variations of water quality in Sanya Bay, China by three-way principal component analysis. Environmental Earth Science 60: 1673-1682
- Solimini AG, Cardoso AC, Heiskanen AS (2006) Indicators and methods for the ecological status assessment under the Water Framework Directive. Linkages between chemical and biological quality of surface waters. Institute for Environment and Sustainability Joint Research Center European Communities p: 262
- Kuczynska-Kippen N, Joniak T (2010) Chlorophyll a and physical-chemical features of small water bodies as indicators of land use in the Wielkopolska region (Western Poland). Limnetica 29: 163–169
- Oczkowski A, Nixon S (2008) Increasing nutrient concentrations and the rise and fall of a coastal fishery: A review of data from the Nile Delta, Egypt. Estuarine Coastal and Shelf Science 77: 309-319
- Guyer GT, Ilhan EG (2011) Assessment of pollution profile in Buyukcekmece Watershed, Turkey. Environmental Monitoring and Assessment 173: 211-220
- Zan F, Huo S, Xi B, Li Q, Liao H, et al. (2011) Phosphorus distribution in the sediments of a shallow eutrophic lake, Lake Chaohu, China. Environmental Earth Sciences 62: 1643-1653
- Battarbee RW, Morley D, Bennion H, Simpson GL, Hughes M, et al. (2011) A palaeolimnological meta-database for assessing the ecological status of lakes. J Paleolimnol 45: 405–414
- Bennion H, Fluin J, Simpson GL (2004) Assessing eutrophication and reference conditions for Scottish freshwater lochs using subfossil diatoms. J Appl Ecol 41: 124–138
- Räsänen J, Kauppila T, Salonen VP (2006) Sediment-based investigation of naturally or historically eutrophic lakes – implications for lake management. J Environ Manage 79: 253–265
- Jeppesen E, Meerhoff M, Davidson TA, Søndergaard M, Lauridsen TL, et al. (2014) Climate change impacts on lakes: an integrated ecological perspective based on a multi-faceted approach, with special focus on shallow lakes. J Limnol 73: 88–111
- Jeppesen E, Mehner T, Winfield IJ, Kangur K, Sarvala J, et al. (2012) Impacts of climate warming on lake fish assemblages: evidence from 24 European long-term data series. Hydrobiologia 694: 1–39.
- Moss B, Kosten S, Meerhoff M, Battarbee RW, Jeppesen E, et al. (2011) Allied attack: Climate change and nutrient pollution. Inland Wat 1: 101–105.
- Prasanna MV, Chidambaram S, Gireesh TV, Ali TV (2011) A study on hydrochemical characteristics of surface and sub-surface water in and around Perumal Lake, Cuddalore district, Tamil Nadu, South India. Environmental Earth Sciences 63: 31-47
- Zhang Q, Li Z, Zeng G, Li J, Fang Y, et al. (2009) Assessment of surface water quality using multivariate statistical techniques in red soil hilly region: A case study of Xiangjiang watershed, China. Environmental Monitoring and Assessment 152: 123-131
- APHA (2005) Standard methods for the examination of water and wastewater (19th edn). American Public Health Association, Washington, D.C., USA. p: 1467
- Analytical Guide (1974) Laboratory techniques. CSIR, Pretoria, South Africa.
- Brown RM, McClelland NI, Deininger RA, Tozer RG (1970) Water quality index-do we dare? Water Sewage Works 117: 339-343.
- Kaul V, Handoo JK (1980) Water characteristics of some freshwater bodies of Kashmir. Currt Tre Life Sci 9: 221-246.
- Hayes FR (1957) On the variation in bottom fauna and fish yield in relation to trophic level and lake dimensions. Journal Fisheries Research Board of Canada 14: l-32
- Rawson DS (1953) The standing crop of net plankton in lakes. Journal Fisheries Research Board of Canada 10: 224-237
- Berg K, Anderson K, Christenson T, Elbert F, Lyshede EJ, et al. (1958) Furesundersgelser 1950-54. Limnologiske studies over Fure’sKulturpavikning Folia. Limnol Scand 10: 189.
- Dass R, Samal NR, Roy PK, Mitra D (2006) Role of electrical conductivity as an indicator of pollution in shallow lakes. Asian J Wat Environ Poll 3: 143-146
- Ramana PS, Sankri G (2008) Evaluation of water quality of Magadi Wetland in Gadag District, Karnataka. Sengupta M. and Dalwani R (Eds) Proceedings of Taal. 2007: The 12th World Lake Conference pp: 355-359
- Aston SR (1980) Nutrients, dissolved gases and general bio-geochemistry of estuaries-In. Chemistry and bio-geochemistry of estuaries, edited by Olausson. E. and Cato. I., (Eds) John, Wiley and Sons Ltd, NY, USA. pp: 233-257.
- Granier J, Billen G, Palfner L (2000) Understanding the oxygen budget and related ecological processes in the river Mossel: The Riverstrahler approach. Hydrobiol 410: 151-166
- Srivastava N, Harit GH, Srivastava R (2009) A study of physico-chemical characteristics of lakes around Jaipur. Indian Journal of Environmental Biology 30: 889-894.
- Chandrasekhar JS, Babu KL, Somasekar RK (2003) Impact of urbanization on Bellandurlake - A case study. J Environt Turk Biol 24: 223-227
- Blum JL (1957) An ecological study on Algae of the saline siver, Michigan. Hydrobiol 9: 361- 408
- Murthuzasab MR, Rajashekhar M, Vijaykumar K, Haliked NS (2010) Seasonal variations in Physico-chemical parameters of Hirahaila reservoir, Koppal District Karnataka. Int J Sys Biol 2: 16-20
- Thresh JC, Suckling EV, Vollenweider RA (1944) Advances in defining critical loading levels of ‘P’ in lake eutrophication. Mem Ist Ital Idrobiol 35: 55-83.
- Ishaq M, Kaul V (1989) Phosphorus load-concentration relationship in Dal lake, a high-altitude marl lake in the Kashmir Himalayas. Hydrobiol 74: 321-328
- Choe S, Kwak HS (1971) Chemical water quality of lake Eui-Am. J Oceanol Soci Kor 6: 63-67.
- Kumar N (1990) Altitude related limnological variables in some fish ponds of Jammu province. PhD. Thesis, Jammu University, Jammu.
- Ohle W (1934) Chemischi and physikalischicheuntersuchunger Norddecutscher Seen. Archieve Hydrobiologia 26: 386-464.
- Bhat SA, Pandit AK (2003) Phytoplankton dynamics in Anchar Lake, Kashmir. J Res Dev 3: 71-96.
- Wetzel RG (2001) Limonology: Lake and rivers ecosystems. Academic Press. San Diego. 1006. Wetzel RG, Otsuki A (eds). Limnology WR, Saunders Co, Philadephia, USA
- Zuber SM (2007) Ecology and economic valuation of Lake Mansar, Jammu. Ph.D. Thesis, Department of Zoology, University of Jammu, Jammu.
- Mustapa MK, Omotosho JS (2005) Assessment of physico-chemical parameters of Moro lake Kwara state Nigeria. Afri J App Zoo Envt Biol 7: 73-77
- Bhat RA, Rehman S, Mehmood MA, Dervash MA, Mushtaq N, et al. (2017) Current status of nutrient load in Dal Lake of Kashmir Himalaya. Journal of Pharmacognosy and Phytochemistry 6: 165-169
- Jeelani G, Shah AQ (2006) Geochemical characteristics of water and sediment from the Dal lake, Kashmir Himalaya: constraints on weathering and anthropogenic activity. Environ Geol 50: 12-23
- Bandela NN, Vaidya DP, Lomte VS, Shivanikar SV (1999) The distribution pattern of phosphate and nitrogen forms and their inter-relationships in Barul Dam water. Poll Res 18: 411-414.
- Vyas A, Mishra DD, Bajapai A, Dixit S, Verma N (2006) Environment impact of idol immersion activity in lakes of Bhopal, India. Asian J Exp Sci 20: 289-296
- Pandit AK, Yousuf AR (2002) Trophic status of Kashmir Himalayan Lakes as depicted by water chemistry. J Res Dev 2: 1-12.
Citation: Mushtaq B, Qadri H, Yousuf AR (2018) Comparative Assessment of Limnochemistry of Dal Lake in Kashmir. J Earth Sci Clim Change 9: 458. DOI: 10.4172/2157-7617.1000458
Copyright: © 2018 Mushtaq B, et al. This is an open-access article distributed under the terms of the Creative Commons Attribution License, which permits unrestricted use, distribution, and reproduction in any medium, provided the original author and source are credited.