Comparative Analysis of Nigeria Petroleum Fiscal Systems Using Royalty and Tax Optimization Models to Drive Investments
Received: 19-Jul-2017 / Accepted Date: 08-Aug-2017 / Published Date: 14-Aug-2017 DOI: 10.4172/2151-6200.1000145
Abstract
The adoption of any petroleum arrangement - concessionary or contractual - is a financial issue that is centered on how costs are recovered and profits divided, which is at the heart of taxation and economic rent theories. Hence countries are expected to make the tax system attractive for the IOCs in order to encourage inward investment. The effectiveness of any petroleum arrangement depends largely on the attractiveness of its underlying tax regime which, in turn, depends on the effectiveness of its design and implementation. The uncertainty created by the non-passage of the proposed Petroleum Industry Bill (PIB) over the years has continued to impede investments in the oil and gas sector in Nigeria. Oil producers Trade Section (OPTS) which is the industry representative body for the oil and gas producing companies in Nigeria have expressed concern over the federal government’s intention to change the laws governing the oil and gas industry including the fiscal terms. The aim of the study is to critically examine whether the Nigerian petroleum tax system is appropriately designed and effectively implemented to achieve the benefits the country desires from its petroleum taxation arrangements.
The study reviews the current and post PIB upstream fiscal regimes and undertook a comparative examination of Nigeria’s fiscal regime against selected world fiscal arrangements. The study also determined how Nigeria’s fiscal regime holds up against five key features of importance to government and prospective investors, which are the degree of stability, flexibility, neutrality and how the regime distributes the burden of risk between the resource owner and the oil companies. The study concluded from preliminary studies that the Nigerian tax and royalty fiscal terms have a significant effect on the following profitability index: Actual Value Profit, Discounted Cash flow rate, present value profit and maximum cash impairment; this invariable affects the competitiveness of Nigeria for foreign direct investment.
Keywords: Fiscal regimes; Royalty and tax sensitivity; Nigeria
Abbreviations
P/I: Profit to Investment Ratio; PV: Present Value; PVP: Present Value Profit; NPV: Net Present Value; AVP: Actual Value Profit; NCF: Net Cash Flow; MCI: Maximum Cash Impairment; DCFR: Discounted Cash Flow Rate of Return; IRR: Internal Rate of Return; CAPEX: Capital Expenditure; OPEX: Operational Expenditure
Introduction
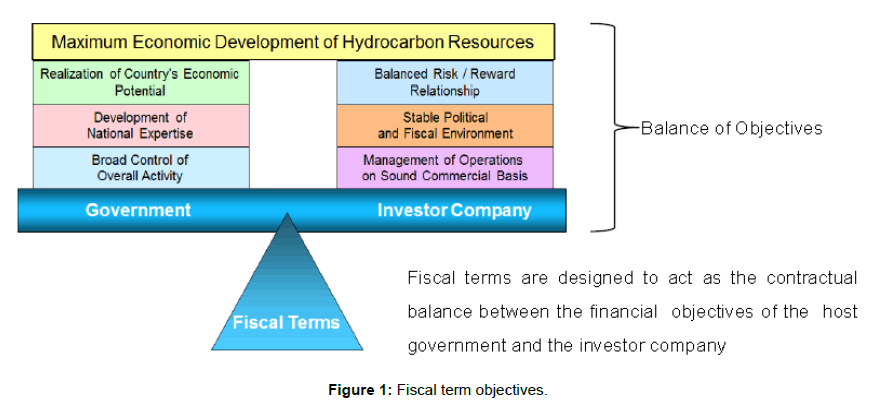
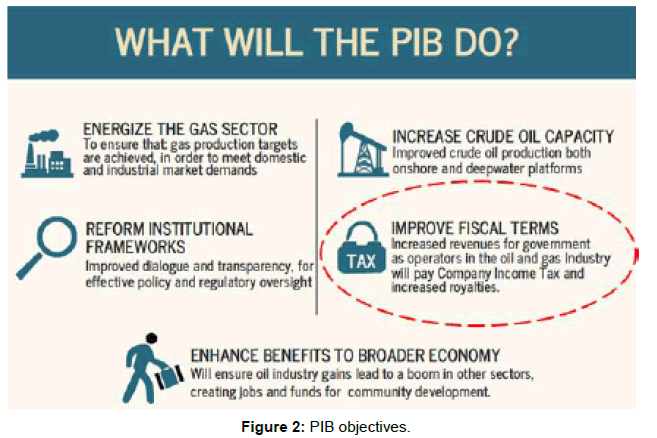
The discovery of oil in Nigeria in 1956 has radically changed the structure of the Nigerian economy from agriculture to oil dependency. In 1960, agriculture contributed 49.8% to Nigeria‘s GDP while oil contributed only 1.1%. Since then, the contribution of oil to the GDP has been rising steadily. This trend continued unabated, and by 2008, oil accounted for 39% of GDP, 83% of government revenues and over 95% of foreign exchange earnings [1]. Like any other host developing country, Nigeria had entered into petroleum exploration and production agreements for the exploitation of its oil resource. Through its national oil company, the Nigerian National Petroleum Corporation (NNPC), Nigeria has been in production partnerships with major International Oil Companies (IOCs) via joint venture (JV) agreements and production sharing contracts (PSC). Fiscal terms are the most important terms of a natural resource contract as they delimit and define the amounts of profit and economic rent that will accrue to each party throughout the life of the contract. For Nigeria these terms are critically important as the country has remained dependent on the industry for the bulk of its foreign exchange earnings for over thirty years (Figure 1). Nigeria needs an appropriate upstream petroleum tax system that is capable of attracting more Foreign Direct Investment (FDI) for the exploitation of its vast petroleum resources without compromising any of its tax objectives which it designed to achieve [2-5]. Petroleum Industry Bill (PIB) was introduced 2008 to establish the legal and regulatory framework, institutions and regulatory authorities for the Nigerian petroleum industry. The Bill has undergone numerous revisions and has been the subject of intense debate from stakeholders. In 2016, the PIB was divided into 4 separate bills namely: the Petroleum Industry Governance Bill (PIGB), the Fiscal Regime Bill, the Upstream and Midstream Administration Bill, and the Petroleum Revenue Bill. The uncertainty created by the non-passage of the proposed Petroleum Industry Bill (PIB) over the years has continued to impede investments in the oil and gas sector. Oil producers Trade Section (OPTS) which is the industry representative body for the oil and gas producing companies in Nigeria have expressed concern over the federal government’s intention to change the laws governing the oil and gas industry including the fiscal terms. OPTS articulated this concern via a 129 page ‘Memorandum’ on the review of the government proposed Petroleum Industry Bill (PIB) which was delivered to ‘The House Joint Committee’ on the PIB in 2009 [6]. The IOCs claim the proposed fiscal terms will affect their bottom line significantly and trigger uncertainties in their investments in the upstream sector. However, federal government claim that the real objectives behind PIB is to Energize the oil and gas sector, Grow crude oil capacity, Reform the institutional frame work and Enhance linkage of the industry to broader economy (Figure 2). It is imperative that the fiscal terms of the PIB be favorable enough to encourage oil and gas investments. There have been delays in some major investment decisions within the industry as a result of the uncertainty with the contents of the PIB that will be eventually passed and the impact that the provisions may have on these decisions.
The specific objectives of this study are
1. To review Nigeria’s current and post PIB upstream fiscal regime;
2. To provide a comparative examination of Nigeria’s fiscal regime against selected world fiscal arrangements; Analyze global competitiveness of investment in Nigeria with main objective of optimizing fiscal terms to drive investments
3. To develop a robust economic analysis model linked to various world fiscal arrangements that can be used to sensitize/drive oil and gas investment decisions.
Arising from the above, this study sets out to address the following main questions
1. “How would the PIB-proposed fiscal terms/design affect upstream investment in the Nigerian petroleum industry?”
2. “Which fiscal parameter can be optimized to drive investments?”
3. “Comparative benefit of investments in Nigeria versus other global fiscal regimes?”
The outcome of this research is to assist policy makers, legislators, industry regulators and other stakeholders to better appreciate the implications of the PIB-proposed fiscal system and terms on investment in the upstream petroleum sector. Investors can also use the optimization model to assess project viability. The study will utilize data from various IOCs projects in Nigeria to develop the base fiscal models. Sensitivity analysis will be conducted for similar global concession models. The following countries with similar concession models were selected for this analysis – Algeria, Australia, Brazil, Colombia, Ghana, Kazakhstan, Mozambique, Namibia, Netherlands, New Zealand, Peru, Romania, Russia and Trinidad. Each of these global fiscal systems will be conditioned to account for local factors that may influence results [7-9].
Nigeria Global Competitiveness Summary
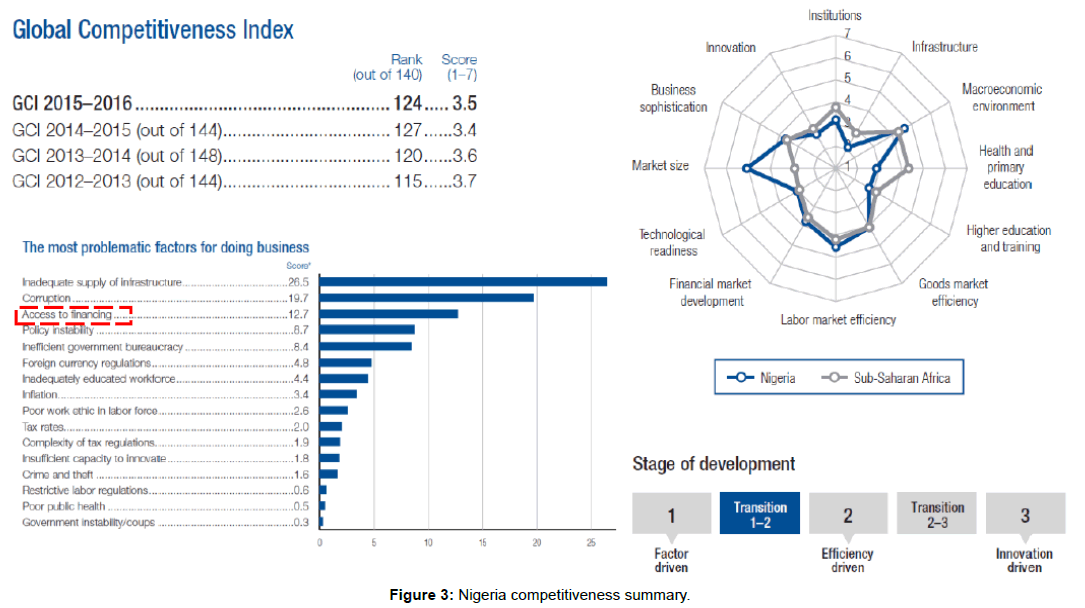
According to the ‘The Global Competitiveness Report 2015- 2016’ compiled by the World Economic Forum, Nigeria’s Global Competitiveness Index (GCI) is 124 out of a total of 140 countries assessed for that year. GCI integrates the macroeconomic and the micro/business aspects of competitiveness into a single index and also measures the set of institutions, policies, and factors that set the sustainable current and medium-term levels of economic prosperity. The report also highlighted ‘access to finance’ as one of the top problematic factors impacting local businesses (Figure 3).
Legal Arrangements In The Petroleum Industry
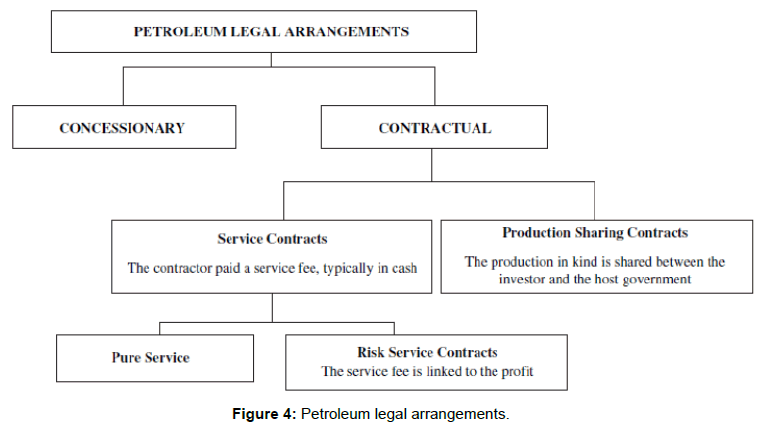
Various legal systems have been developed to address the rights and obligations of host government and of private investors. These can be grouped under two families: concessionary systems and contractual systems (Figure 4). The fundamental difference between concessionary and contractual systems relates to the ownership of the natural resources:
Under a concessionary system, the title to hydrocarbons passes to the investor at the borehole. The state receives royalties and taxes in compensation for the use of the resource by the investor. Title to and ownership of equipment and installation permanently affixed to the ground and/or destined for exploration and production of hydrocarbons generally passes to the state at the expiry, or termination, of the concession (whichever is earlier). The investor is typically responsible for abandonment [10].
Under a contractual system, the investor acquires the ownership of its share of production only at the delivery point. Title to and ownership of equipment and installation permanently affixed to the ground and/ or destined for exploration and production of hydrocarbons generally passes to the state immediately. Furthermore, unless specific provisions have been included in the contract (or in the relevant legislation) the government (or the national oil company, “NOC”) is typically legally responsible for abandonment.
Petroleum Profits Tax
Nigerian law by virtue of the Petroleum Profits Tax Act requires all companies engaged in the extraction and transportation of petroleum to pay tax. The taxable income of a petroleum company comprises proceeds from the sale of oil and related substances used by the company in its own refineries plus any other income of the company incidental to and arising from its petroleum operations [11-14]. The taxable income of a petroleum company is subject to tax at 85%, but this percentage is lowered to 65.75% during the first 5 years of operation. Where oil companies operate under production sharing contracts they will be liable to tax at a rate of 50%. There are however some concessions granted petroleum companies known as, Capital Allowance and Petroleum Investment Allowance; the former is deducted in arriving at the taxable income and entails expenditure on equipment, pipelines, and storage facilities, buildings and drilling costs, these are referred to as qualifying assets. The applicable rate of Capital Allowance for any year is of 20% of the cost of the qualifying assets applied on a straightline basis for the first 4 years and 19% for the 5th year. The latter is regarded as an addition to capital allowance and covers allowance in respect of new investments in assets for petroleum exploration; it is available in the accounting period in which the assets are first used. It must be stated that the deduction of Capital Allowance is restricted, so that for any accounting period, the tax on the company should not be less than 15% of the tax which would have been assessable had no capital allowances been granted the company (Table 1).
| Date and Legislation Fiscal Terms Affected | Details |
|---|---|
| 1999: Deep Offshore and Inland Basin Production Sharing Contracts Decree No. 9: Introduction of PSCs [Deemed to have come into force January 1993] Corporate Income Tax Royalty regime graduated Price Based Taxes | • Corporate Income Tax 50% flat rate on chargeable profits for the duration of the PSCs Chargeable profits are Assessable profits less Capital allowances; Assessable profits are adjusted profits less loss incurred by a company during a previous accounting period; Adjusted profits are the value of profits less outgoings and expenses • Royalty regime graduated Up to 200 mL 16.67%; 201-500 m: 12%; 501-800 m: 8%; 801-1000 m: 4%; 1000 m+: 0%; Inland basin: 10% • Price based Taxes The realizable price as defined in the Production Sharing Contract established by the Corporation or the Holder in accordance with the provisions of the Production Sharing Contract, in respect of crude oil, etc. shall be used to determine the amount payable on royalty and petroleum profit tax in respect of crude oil produced and lifted pursuant to the Production Sharing Contract. |
| 1999: Deep Offshore and Inland Basin Production Sharing Contracts (Amendment) Decree No 26 of 1999 Profit Oil Sharing |
• Profit Oil Sharing If price of oil exceeds $20/barrel, the PSC can be amended to increase the share of the government |
| 2004: Petroleum Profits Tax Act Petroleum Profits Tax Royalty rate for Joint Venture |
• Petroleum Profits Tax [on chargeable profits] First Five years (new companies): 65.75% First Five years (existing companies): 85% Subsequent years (all companies): 85% • Royalty rates for Joint Venture: Onshore Production: 20% Production in territorial waters less than 100 m: 18.5% Offshore production beyond 100 m: 16.67% |
2009: Deep offshore and inland Basin PSC Revisions
2008 – Till Date: Petroleum Industry Bill (PIB)
2015-Till Date: PIB split into 4 bills namely: the Petroleum Industry Governance Bill (PIGB), the Fiscal Regime Bill, the Upstream and Midstream Administration Bill, and the Petroleum Revenue Bill. The PIGB is the only bill that is currently in circulation and has passed its first reading at the Senate.
Table 1: Nigeria Fiscal terms evolution.
Nigeria Petroleum Fiscal Terms Evolution
Nigeria fiscal terms uncertainty
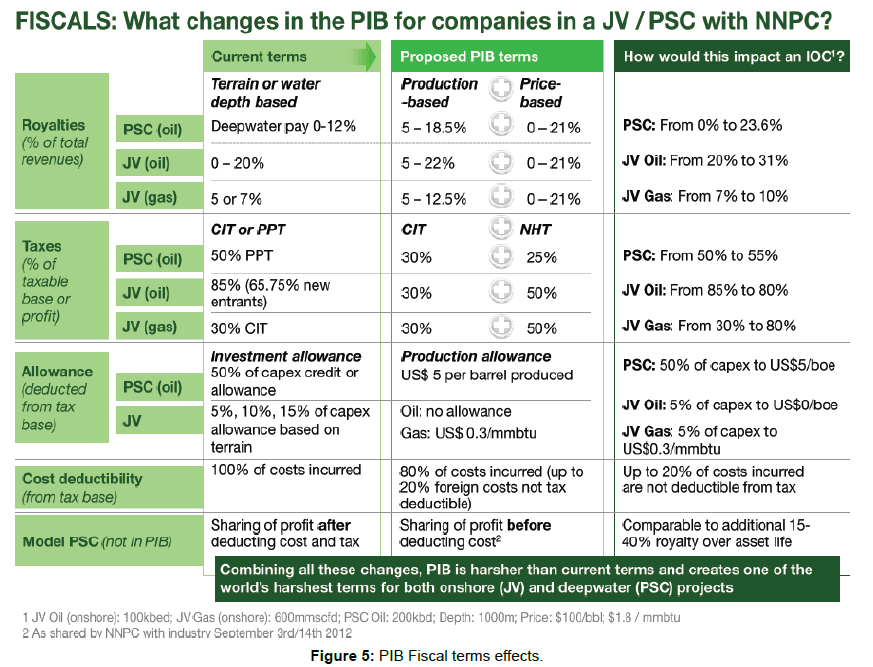
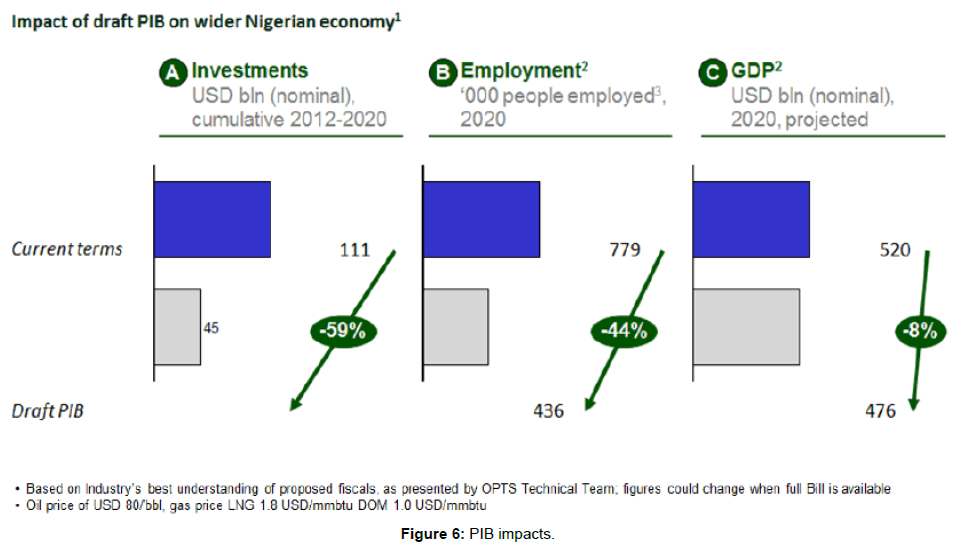
According to OPTS report (2013), PIB terms as currently drafted are not globally competitive and will reduce the economic viability of new oil and gas developments. This is due to a combination of fiscal and non-fiscal terms that challenge project viability and erode investor confidence (Figures 5 and 6). With the draft PIB, investment, employment and GDP growth will be lower than potential [15-18].
Theoretical Development
To evaluate a fiscal system, governments and oil companies use different measures:
Oil companies aim to optimize their portfolio of assets. They use economic measures to compare investment opportunities worldwide and to assess their relative risk-reward profile. During the economic life of an asset, oil companies monitor the revenue generated by it to verify that they have covered the capital investment and expenditures and that the return on capital is consistent with the risk associated with the particular asset and with the strategic objectives of the corporation.
Host governments are interested in evaluating whether a fiscal system responds to its intended objectives. To do so, at a project level host governments use economic and system measures to assess whether the benefits—financial and social-derived from the project are consistent with its risk level and with the objectives of the government’s sector policy. At a country level host governments monitor the impact of the revenue flow generated by the oil sector as a whole on the key macro-economic indicators (mainly inflation, GDP growth, balance of payments).
Economic and fiscal systems measures are project-specific quantities that vary with numerous system parameters unique to the project (including, but not limited to, the size and quality of discoveries, the development and operational plan of the operator, the cost structure; the financing costs, discounts or premia for the particular crude oil stream), as well as non-project specific variables (such as crude oil prices, inflation, currency exchange rates, local and global economic conditions, and regulatory changes). Hydrocarbon price, development cost, technological improvements, demand-supply relations, country risk, and the corporate strategy, all impact investment planning. Hence the accurate computation of the economic and fiscal system measures associated with a field largely depends on the reliability of the assumptions. In effect, only at the end of a field’s economic life, when all revenue, cost, royalty and tax data are known, can the profitability and the division of profits between the host government and the investors be reliably determined. Various economic indicators are used to assess the performance of a project. The most common are the net present value of the project’s cash flow (NPV), the internal rate of return (IRR), and the profitability ratio (PR). The NPV provides an evaluation of the project’s net worth to the investor in absolute terms, while the IRR and the PR are relative measures used to rank projects for capital budgeting. Economic values are not intended to be interpreted on a standalone basis, but should be used in conjunction with other system measures and decision parameters. A combination of indicators is usually necessary to adequately evaluate a contract’s economic performance [19]. One indicator frequently referred to is the division of profits between companies and government (the “take”). The take is a fiscal statistic as opposed to an economic measure. Because the take does not provide a direct indication of the economic performance of a field, it generally matters more to the host government than to the oil companies.
Economic Indicators of Investment Profitability
Basic cash flow
A basic cash flow takes a production estimate and applies price to calculate a revenue stream. From this revenue stream, we subtract royalties and operating expenses to achieve an operating income. Capital is then removed to create a Before-Tax Cash Flow (BTCF). Income taxes are then calculated, and the After-Tax Cash Flow (ATCF) is created.
Revenue=Production Volume × Price
Operating Income=Revenue – (Royalty+Operating costs)
BTCF=Operating Income – Capital expenditures
Taxable Income=Operating Income – Depreciation (DD&A)
ATCF=BTCF – Taxes Payable
Where:
BTCF=Before-Tax Cash Flow
ATCF=After-Tax Cash Flow
DD&A=Depreciation, depletion and amortization.
Prices
Price is the monetary value received for each barrel of oil or cubic foot of gas produced and sold. Secondary by-products (NGLs) may also be sold from some reservoirs. Prices may be kept at a constant value or escalated over time. Escalations are predictions of how the price will change based on market conditions [20-22]. The quality of the hydrocarbon being sold (API density, absence of impurities like H2S, etc.) can also affect the product price.
Royalties
Royalty is value deducted from the revenue stream, which usually has no obligation toward covering expenses. It is considered to come “off the top”, after product quality adjustments, but before operating costs or investments are deducted. Many different formulas are used for the calculation of royalties, which are dependent on the fiscal
Operating costs
Operating costs are the day-to-day costs of operating a property and maintaining production [23]. Typical charges would include fluid processing costs, lease electricity, chemicals, water disposal, and overhead. They are identified with a specific property and might include lease maintenance, treating fluids, general repairs, fuel and electricity, and secondary or enhanced recovery operations. Overhead type charges such as salaries and office costs are usually grouped with operating expenses in a basic cash flow analysis. They are normally deductible for income tax purposes.
Capital investments
Capital consists of investments for drilling, exploration, equipment and facilities.
Usually broken down into Tangible and Intangible categories, they are considered spent in the scheduled year for the Before-Tax Cash Flow, and recovered over time for the After-Tax Cash Flow. Tangible investments are equipment purchases, such as pumping units, pipelines, compressors, and buildings [24-26]. They often have salvage value. Intangible investments are drilling fees, mud and chemicals, logging, and other non-equipment charges. They typically have no salvage value. Costs to abandon an area or location are sometimes grouped with capital investments. Spent at the end of the life of a project, they may be offset by any recoverable equipment sold as salvage.
Income or Federal Taxes
Once an Operating Income has been established, income taxes should be calculated.
It is at this point that tangible assets are depreciated over time, reducing the income stream available to be taxed. The tax rate is applied to Taxable Income, taxes are subtracted, and the After Tax Cash Flow is created.
The economic indicators can be described as follows:
• Net present value (NPV)=present value of cash inflows – present value of cash outflows (or minus initial investment.) Generally a project with positive NPV adds value to the investors in the project, and conversely, a negative NPV will not generate an adequate return.
• Rate of return (ROR) or internal rate of return (IRR) is the single discount rate that produces a NPV of zero. It is also described as the discount rate that equates the present worth of cash flows to be equal to the present worth of the investments.
• Profit to Investment Ratio (PIR) – also known as the Return on Investment (ROI), this indicator is similar to the DPI. It simply divides total NPV by total capital. Known as the “bang for the buck” indicator, it is very useful for ranking projects when capital is limited.
• Discounted Profitability Index (DPI) is a measure of investment efficiency, and is used to evaluate multiple rates of return projects relative to the investment requirements. Consistent use of the same discount rate is necessary when comparing projects by using DPI. This indicator is sometimes called PI.
• Payback period is the time to return an investment. It is calculated from the net cash flow stream. The point at which the cumulative net cash flow stream becomes positive is the Payout [27].
Experimental Procedure
This study generated Economic Model Framework to represent the fiscal system. The choice of these methods is informed by the range of variables in the research questions. Issues concerning cash flow, project NPV and rate of return are more appropriately dealt with using the economic indicators of investment profitability. Figure 7 below shows a schema of the dependent and independent variables for this research.
• The economic analyses involved cash flow modeling, project profitability and sensitivity analysis
• The deterministic and probabilistic approach of economic analysis examined through Monte Carlo simulation using Crystal Ball to determine the influential factors to the project profitability
• The Tornado, Spider and Sensitivity charts analyses of Net Present Value and other economic parameters was used as yardstick to enhance quick and easier decision making. These aid to investigate the effect of changes in economic, technical cost, and production parameters on the net present value and generally accepted economic, finance and technical data about the operating environment.
To use Crystal Ball for this purpose, the following steps are required:
1. Build a discounted cash flow model of the intended project in a spreadsheet.
2. Identify the main uncertainties.
3. Define a realistic statistical distribution for those uncertainties that represent the full range of uncertainty (positive and negative).
4. Generate the distribution of the profitability criteria. The distribution of the profitability indicators will show the estimated likelihood that the project will meet the required profitability criteria.
• The base case for this economic analysis is pre-PIB fiscal terms.
Results and Discussion
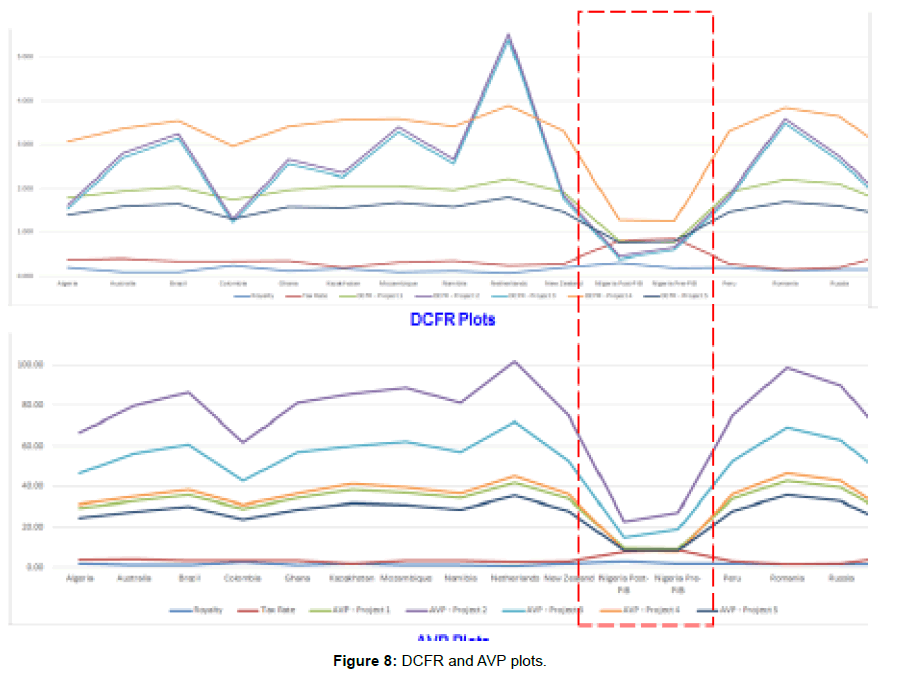
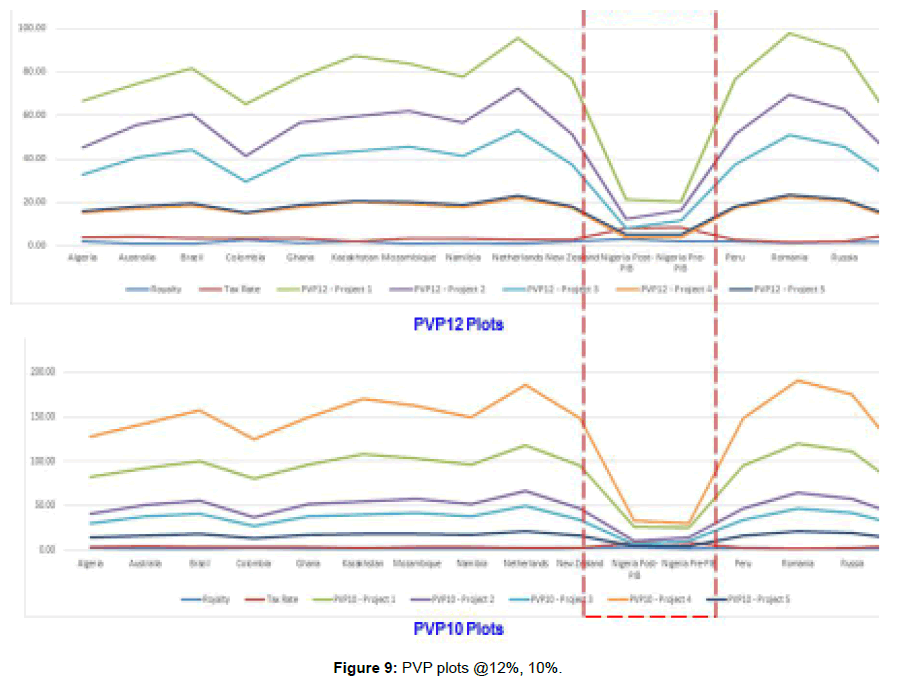
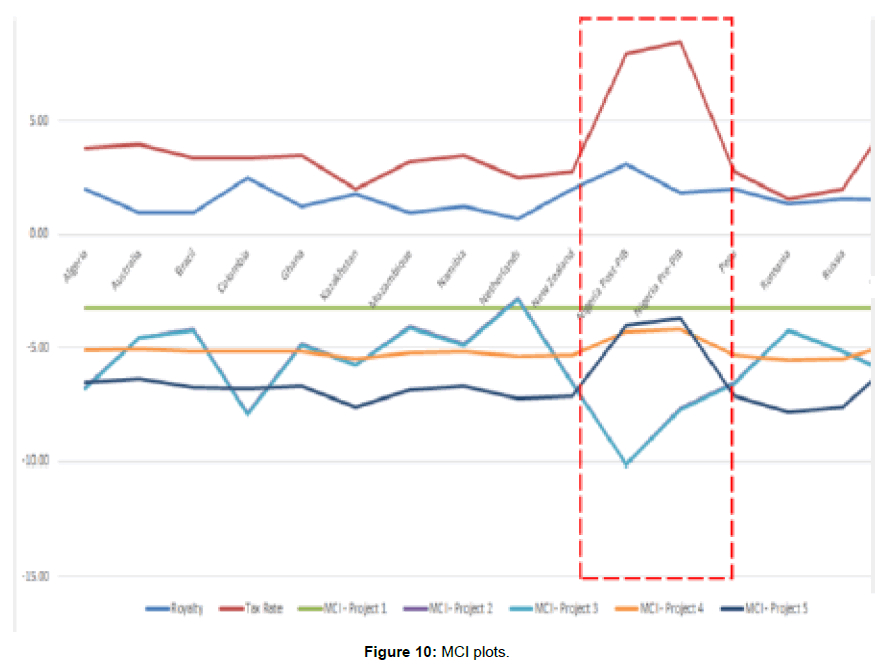
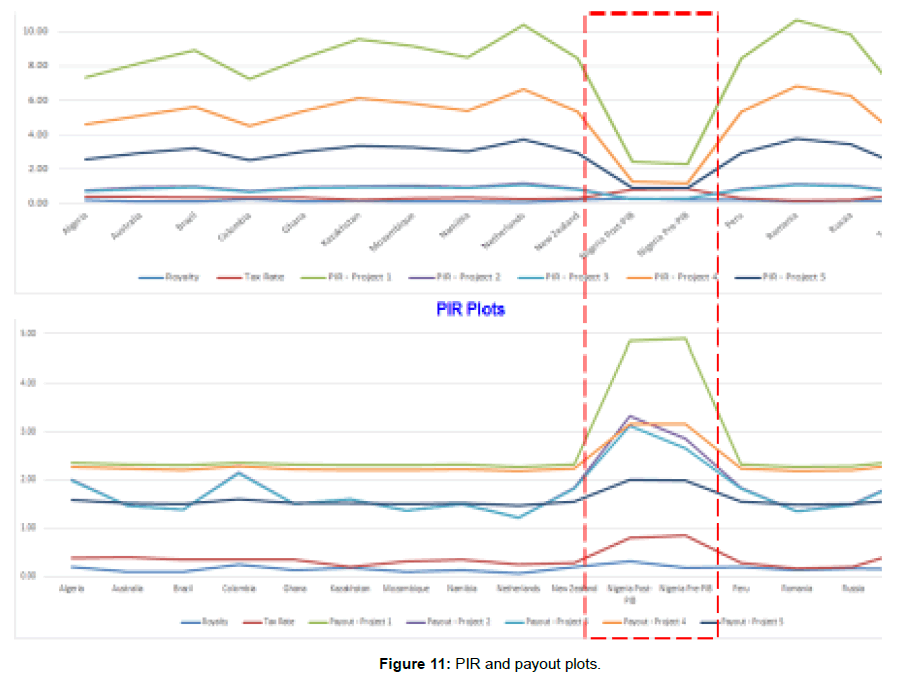
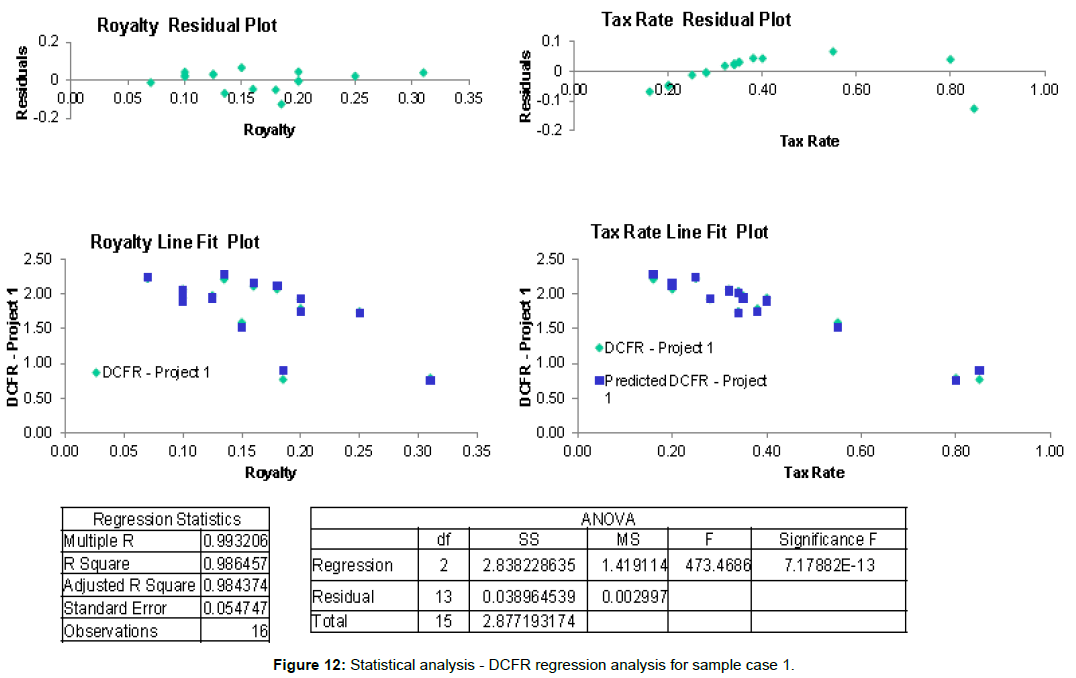
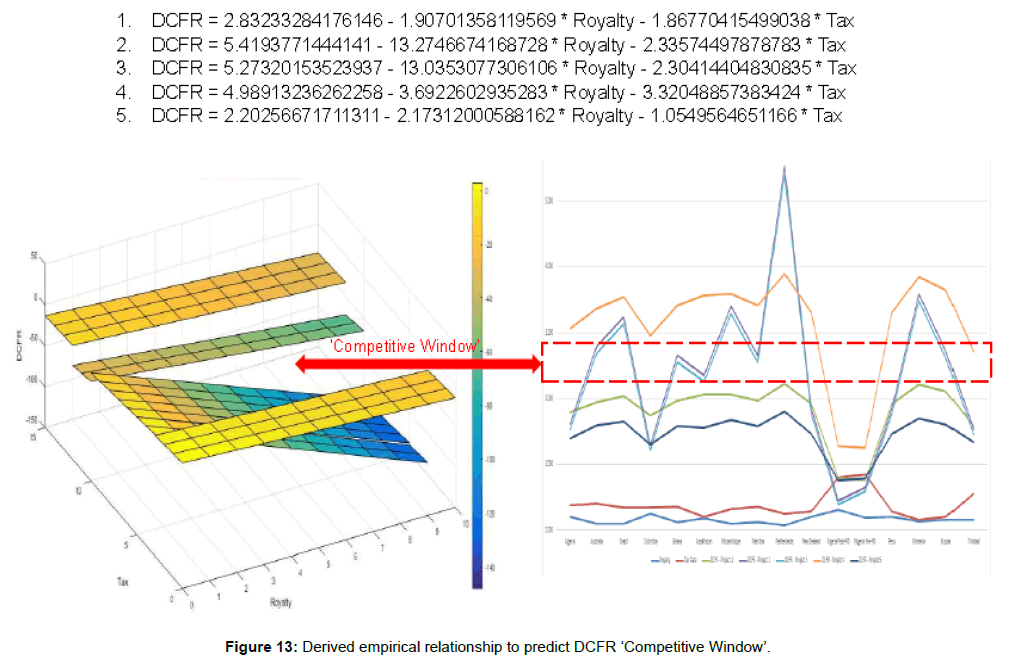
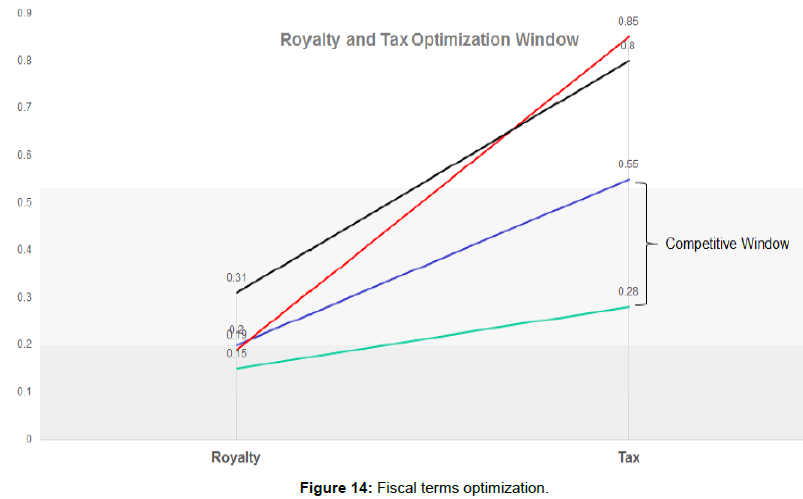
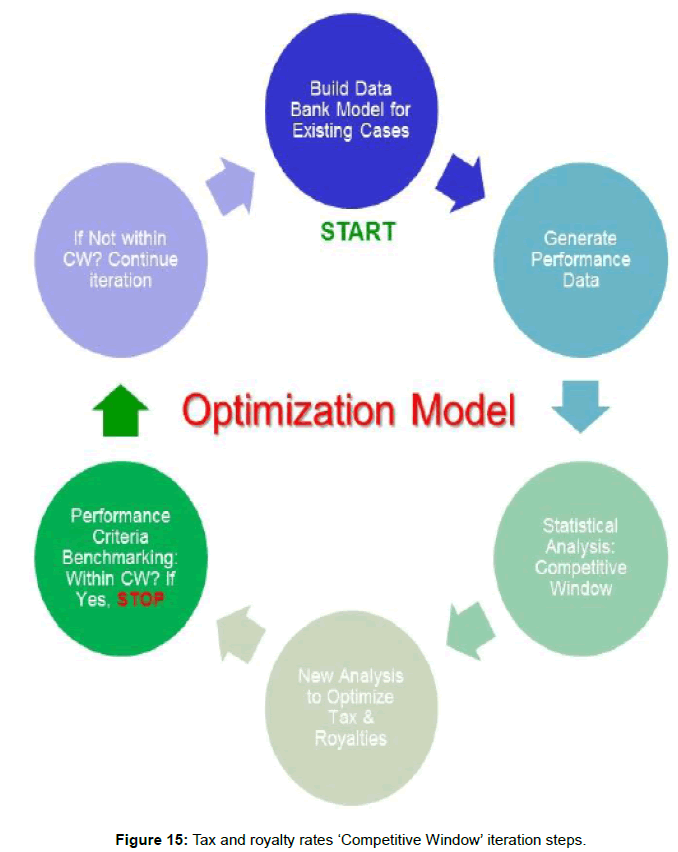
This study considered sixteen (16) countries with similar concessionary fiscal regimes for this analysis – Algeria, Australia, Brazil, Colombia, Ghana, Kazakhstan, Mozambique, Namibia, Netherlands, New Zealand, Peru, Romania, Russia, Trinidad, Nigeria (pre-PIB) and Nigeria (post-PIB). Nigeria (pre-PIB) data was considered as base case models. Data from recently completed projects from selected IOC were utilized for this analysis. Model out data is shown in Table 2 below. The economic indicators that were examined to assess the performance of each project are: DCFR, AVP, PVP@12%, PVP@10%, MCI, PIR and Payout [28]. Based on the trend observed in the economic indicators, a correlation statistical analysis was conducted for each case using the DCFR as an example (Figures 8-11). Examined strong relationship between Fiscal terms (tax and royalties) and the performance indicator – DCFR (Figures 12-15, Tables 3 and 4).
| Algeria | Australia | Brazil | Colombia | Ghana | Kazakhstan | Mozambique | Namibia | Netherlands | New Zealand | Nigeria Post-PIB | Nigeria Pre-PIB | Peru | Romania | Russia | Trinidad | |
|---|---|---|---|---|---|---|---|---|---|---|---|---|---|---|---|---|
| % | 178.50% | 193.70% | 203.20% | 174.20% | 197.10% | 206.50% | 206.20% | 197.10% | 221.90% | 192.30% | 78.60% | 76.50% | 192.30% | 220.70% | 210.60% | 158.50% |
| $M | 2958.6 | 3277.8 | 3579.9 | 2909.4 | 3419.5 | 3851.6 | 3680.7 | 3419.5 | 4185.6 | 3394.5 | 978.8 | 925.1 | 3394.5 | 4287.3 | 3959.9 | 2369.9 |
| $M | 667.9 | 745.9 | 815.7 | 654 | 777.6 | 874.2 | 839 | 777.6 | 957.3 | 768 | 211.6 | 201.1 | 768 | 977.3 | 900.3 | 534.5 |
| $M | -32.5 | -32.2 | -33 | -33 | -32.9 | -34.9 | -33.3 | -32.9 | -34.2 | -33.8 | -26.9 | -26.2 | -33.8 | -35.4 | -34.9 | -30.2 |
| $M | 824.8 | 919.5 | 1005.2 | 808.4 | 958.6 | 1077.9 | 1033.8 | 958.6 | 1178.5 | 947.8 | 264.7 | 251.5 | 947.8 | 1203.8 | 1109.7 | 660.6 |
| $/$ | 7.4 | 8.2 | 8.9 | 7.2 | 8.5 | 9.6 | 9.2 | 8.5 | 10.4 | 8.4 | 2.4 | 2.3 | 8.4 | 10.7 | 9.9 | 5.9 |
| Years | 2.3 | 2.3 | 2.3 | 2.4 | 2.3 | 2.3 | 2.3 | 2.3 | 2.3 | 2.3 | 4.9 | 4.9 | 2.3 | 2.3 | 2.3 | 2.4 |
| % | 161.60% | 279.80% | 324.20% | 129.60% | 265.60% | 234.80% | 340.60% | 265.60% | 553.00% | 185.00% | 45.10% | 64.50% | 185.00% | 359.40% | 272.10% | 153.80% |
| $M | 66.6 | 79.8 | 86.4 | 61.8 | 81.2 | 85.9 | 88.6 | 81.2 | 101.8 | 75.1 | 22.8 | 27.2 | 75.1 | 98.9 | 89.8 | 57.7 |
| $M | 45.1 | 55.6 | 60.5 | 41.2 | 56.5 | 59.5 | 62.1 | 56.5 | 72.3 | 51.4 | 12.3 | 16.2 | 51.4 | 69.5 | 62.6 | 38.9 |
| $M | -6.7 | -4.5 | -4.2 | -7.9 | -4.8 | -5.7 | -4 | -4.8 | -2.8 | -6.5 | -10.1 | -7.7 | -6.5 | -4.2 | -5.1 | -6.3 |
| $M | 41.2 | 51.2 | 55.8 | 37.4 | 52 | 54.7 | 57.3 | 52 | 66.9 | 47.1 | 10.4 | 14.3 | 47.1 | 64.2 | 57.6 | 35.5 |
| $/$ | 0.8 | 0.9 | 1 | 0.7 | 0.9 | 1 | 1 | 0.9 | 1.2 | 0.9 | 0.3 | 0.3 | 0.9 | 1.2 | 1 | 0.7 |
| Years | 2 | 1.5 | 1.4 | 2.2 | 1.5 | 1.6 | 1.4 | 1.5 | 1.2 | 1.8 | 3.3 | 2.8 | 1.8 | 1.3 | 1.5 | 2 |
| % | 153.10% | 268.90% | 312.90% | 122.10% | 255.30% | 225.70% | 329.20% | 255.30% | 538.70% | 176.40% | 38.50% | 58.60% | 176.40% | 348.70% | 262.40% | 145.00% |
| $M | 46.5 | 56.2 | 60.8 | 43 | 57.1 | 60.1 | 62.4 | 57.1 | 71.8 | 52.5 | 15 | 19 | 52.5 | 69.5 | 63 | 40.5 |
| $M | 32.7 | 40.7 | 44.3 | 29.6 | 41.3 | 43.3 | 45.5 | 41.3 | 53.1 | 37.2 | 7.9 | 11.5 | 37.2 | 50.8 | 45.6 | 28.2 |
| $M | -6.8 | -4.6 | -4.2 | -7.9 | -4.9 | -5.8 | -4.1 | -4.9 | -2.8 | -6.5 | -10.1 | -7.7 | -6.5 | -4.2 | -5.2 | -6.3 |
| $M | 30.1 | 37.8 | 41.2 | 27.1 | 38.3 | 40.1 | 42.3 | 38.3 | 49.6 | 34.4 | 6.6 | 10.1 | 34.4 | 47.3 | 42.4 | 26 |
| $/$ | 0.7 | 0.9 | 0.9 | 0.7 | 0.9 | 0.9 | 1 | 0.9 | 1.1 | 0.8 | 0.2 | 0.3 | 0.8 | 1.1 | 1 | 0.6 |
| Years | 2 | 1.5 | 1.4 | 2.1 | 1.5 | 1.6 | 1.4 | 1.5 | 1.2 | 1.8 | 3.1 | 2.7 | 1.8 | 1.3 | 1.5 | 2 |
| % | 305.90% | 336.60% | 353.80% | 296.40% | 341.90% | 357.00% | 359.30% | 341.90% | 388.90% | 330.70% | 128.10% | 124.80% | 330.70% | 384.40% | 365.30% | 271.50% |
| $M | 313.2 | 348.9 | 383.6 | 308.1 | 365.4 | 415.7 | 395.1 | 365.4 | 452.7 | 363.3 | 85.8 | 79.2 | 363.3 | 465.2 | 427.9 | 245.1 |
| $M | 150 | 167.9 | 184.9 | 147.2 | 175.9 | 200.1 | 190.5 | 175.9 | 218.8 | 174.4 | 39 | 36 | 174.4 | 224.5 | 206.2 | 117 |
| $M | -5.1 | -5.1 | -5.2 | -5.2 | -5.2 | -5.5 | -5.2 | -5.2 | -5.4 | -5.3 | -4.3 | -4.2 | -5.3 | -5.5 | -5.5 | -4.8 |
| $M | 127.6 | 143 | 157.5 | 125.1 | 149.7 | 170.4 | 162.3 | 149.7 | 186.5 | 148.4 | 32.7 | 30.2 | 148.4 | 191.3 | 175.6 | 99.4 |
| $/$ | 4.6 | 5.1 | 5.6 | 4.5 | 5.4 | 6.1 | 5.8 | 5.4 | 6.7 | 5.3 | 1.3 | 1.2 | 5.3 | 6.8 | 6.3 | 3.6 |
| Years | 2.3 | 2.2 | 2.2 | 2.3 | 2.2 | 2.2 | 2.2 | 2.2 | 2.2 | 2.2 | 3.1 | 3.2 | 2.2 | 2.2 | 2.2 | 2.3 |
| % | 138.90% | 159.60% | 165.10% | 130.40% | 158.40% | 155.90% | 166.80% | 158.40% | 179.90% | 146.00% | 75.30% | 78.60% | 146.00% | 169.80% | 160.90% | 133.00% |
| $M | 24.5 | 27.8 | 30.2 | 23.7 | 28.7 | 31.8 | 31 | 28.7 | 35.4 | 27.9 | 8.6 | 8.4 | 27.9 | 35.7 | 32.8 | 20.1 |
| $M | 15.7 | 18 | 19.6 | 15.2 | 18.6 | 20.6 | 20.2 | 18.6 | 23.1 | 18 | 5.1 | 5 | 18 | 23.2 | 21.3 | 12.8 |
| $M | -6.5 | -6.4 | -6.7 | -6.8 | -6.7 | -7.6 | -6.8 | -6.7 | -7.3 | -7.1 | -4 | -3.7 | -7.1 | -7.8 | -7.6 | -5.5 |
| $M | 14.2 | 16.2 | 17.7 | 13.6 | 16.8 | 18.6 | 18.2 | 16.8 | 20.9 | 16.3 | 4.4 | 4.4 | 16.3 | 21 | 19.3 | 11.5 |
| $/$ | 2.6 | 2.9 | 3.2 | 2.5 | 3 | 3.4 | 3.3 | 3 | 3.7 | 3 | 0.9 | 0.9 | 3 | 3.8 | 3.5 | 2.1 |
| Years | 1.6 | 1.5 | 1.5 | 1.6 | 1.5 | 1.5 | 1.5 | 1.5 | 1.5 | 1.6 | 2 | 2 | 1.6 | 1.5 | 1.5 | 1.6 |
| % | 3.00% | 9.90% | 9.90% | -0.70% | 8.10% | 3.70% | 9.80% | 8.10% | 12.10% | 2.50% | 2.40% | 7.90% | 2.50% | 7.00% | 5.20% | 7.00% |
| $M | 5.9 | 18.8 | 19.9 | -1.4 | 16.2 | 8.6 | 20.2 | 16.2 | 26.3 | 5.5 | 2.8 | 8.2 | 5.5 | 16.7 | 12 | 11.4 |
| $M | -9.5 | -2.1 | -2.3 | -14 | -4.2 | -10.2 | -2.3 | -4.2 | 0.1 | -11 | -6 | -2.4 | -11 | -6.3 | -8.4 | -4.4 |
| $M | -52.7 | -46.1 | -48.9 | -57.9 | -49.9 | -61.2 | -49.8 | -49.9 | -51 | -58.2 | -31.4 | -26.4 | -58.2 | -59.9 | -59.7 | -41.2 |
| $M | -11 | -4.5 | -4.8 | -15 | -6.4 | -12.1 | -4.9 | -6.4 | -2.9 | -12.5 | -6.8 | -3.5 | -12.5 | -8.7 | -10.4 | -6 |
| $/$ | 0 | 0.1 | 0.2 | 0 | 0.1 | 0.1 | 0.2 | 0.1 | 0.2 | 0 | 0 | 0.1 | 0 | 0.1 | 0.1 | 0.1 |
| Years | 9.9 | 7.9 | 8 | 34 | 8.3 | 9.7 | 8 | 8.3 | 7.7 | 10.2 | 9.5 | 7.8 | 10.2 | 8.7 | 9.2 | 8.4 |
Table 2: Economic Model Results (using ‘unconditioned’ models).
| Correlation analysis results | ||||||||
|---|---|---|---|---|---|---|---|---|
| Royalty | Tax Rate | DCFR-Project 1 | DCFR-Project 2 | DCFR-Project 3 | DCFR-Project 4 | DCFR Project 5 | ||
| DCFR-Project 1 | -1 | -1 | 1 | |||||
| DCFR-Project 2 | -1 | -1 | 0.780283 | 1 | ||||
| DCFR-Project 3 | -1 | -1 | 0.779956 | 0.999993 | 1 | |||
| DCF R-Project 4 | -1 | -1 | 0.999772 | 0.791805 | 0.791464 | 1 | ||
| DCFR-Projects | -1 | -1 | 0.983126 | 0.855366 | 0.854768 | 0.986571 | 1 | |
| Countries | Royalty | Tax Rate | DCFR- Project 1 | DCFR-Project 2 | DCFR-Project 3 | DCFR-Project 4 | DCFR-Project 5 | |
| Algeria | 0.2 | 0.38 | 2 | 2 | 2 | 3 | 1 | |
| Australia | 0.1 | 0.4 | 2 | 2.8 | 3 | 3 | 1.6 | |
| Brazil | 0.1 | 0.34 | 2 | 3 | 113 | 4 | 2 | |
| Colombia | 0.25 | 0.34 | 2 | 1.3 | 1 | 3 | 1.3 | |
| Ghana | 0.13 | 0.35 | 2 | 3 | 3 | 3 | 2 | |
| Kazakhstan | 0.18 | 0.2 | 2 | 2 | 2 | 4 | 2 | |
| Mozambique | 0.1 | 0.32 | 2 | 3 | 3 | 4 | 2 | |
| Namibia | 0.13 | 0.35 | 2 | 3 | 3 | 3 | 2 | |
| Netherlands | 0.07 | 0.25 | 2 | 6 | 5 | 4 | 1.8 | |
| New Zealand | 0.2 | 0.28 | 2 | 2 | 2 | 3 | 1 | |
| Nigeria Post-PIB | 0.31 | 0.8 | 0.79 | 0.45 | 0.39 | 1 | 0.75 | |
| Nigeria Pre-PIB | 0.19 | 0.85 | 0.77 | 0.65 | 0.59 | 1 | 0.79 | |
| Peru | 0.2 | 0.28 | 2 | 2 | 2 | 3 | 1 | |
| Romania | 0.14 | 0.16 | 2 | 4 | 3 | 4 | 1.7 | |
| Russia | 0.16 | 0.2 | 2 | 3 | 3 | 4 | 2 | |
| Trinidad | 0.15 | 0.55 | 2 | 2 | 1 | 3 | 1 | |
Table 3: Statistical analysis-DCFR correlation analysis for 5 cases.
| DCFR random values | ||||||||
|---|---|---|---|---|---|---|---|---|
| Coats | CCFR-Project 1 | Projected DCFR-Project 1 | Nonni DCFR-Project 1 | Average | Miriam MOiffIJM | 15 | 2 | 1 |
| Algeria | 2 | 2 | 2 | 2 | 0.49373699 3.30376 | 7140% | 4920% | 27.00% |
| Australia | 194 | 2 | 2 | 1.8951538W | 0.62631865 3.428306 | 82.00% | 63.00% | 41140% |
| Braid | 2 | 2 | 1359883% | 2.107E+09 | 0.70421089 3.410326 | 20% | 7220% | 51.00% |
| Colornbia | 2 | 2 | 1 | 1.321E+09 | 421297853 | 70.00% | 4720% | 26.00% |
| Ghana | 2 | 1.9102596 | 2.37%78039 | 1.34E+09 | 0.62307485 3.218297 | 85.00% | 6720% | 45.00% |
| Kazakhstan | 2 | 2 | 2 | 2 | 169136753 | 92.00% | 8023% | 61.00% |
| MozambOue | 2 | 2 | 2 | 2 | 0.72991448 3.496454 | 90.00% | 75.00% | 54.00% |
| Namibia | 191 | 2 | 2 | 1.34E+09 | 230272843 | 85.00% | 67.00% | 4460% |
| Netherlands | 2 | 2 | 2 | 22322987% | 0E2319108 3.72363 | 96.00% | 37.00% | 71.00% |
| New Zealand | 2 | 2 | 2 | 1.328E+09 | 528338623 | 84.00% | 6620% | 4140% |
| I Nteria Pos•P13 | am | 346995308 | 0.6439791 | 0.7467388 | -58211522 | 4.00% | 0.80% | 0.20%1 |
| ILgeda Pre-P113 | an | 211935797 | 0.3814443 | 0.8926365 | -0.3500321 2.36807 | 8.00% | 2.00% | 0.40911 |
| Peru | 2 | 2 | 2 | 1.328E+09 | 0.6E672466 3.283103 | 84.00% | 6600% | 43.00% |
| Romania | 2 | 2 | 2 | 2 | 0.90645709 3.580312 | 96.00% | 89.00% | 74.00% |
| Russia | 2 | 2 | 2 | 2 | 132005484 | 9160% | 83.00% | 64.00% |
| Trinidad | 2 | 2 | 9.82E+33 | 151991632 | casinos 2.818113 | 52.00% | 29.00% | 13.00% |
| Standard Deviation | 0.4293815 | |||||||
Table 4: Model results-Monte Carlo simulation (risk analysis).
Conclusions
1. The study concluded from preliminary studies that there is a correlation between fiscal terms (tax and royalty) and various profitability indexes (DCFR, PIR, AVP, PVP, MCI and payout).
2. The global comparative analysis result also shows that Nigeria fiscal terms (pre and post PIB) are outside the competitive window and will invariably discourage foreign direct investments.
3. Tax and Royalty rate optimization required to maintain competitiveness Further study areas includes conditioning the various global fiscal systems to account for local factors (environmental, political stability, fiscal stability etc. to improve global benchmarking. The steps will be taken to improve results:
4. Increase databank of cases from completed projects.
5. Test more optimization algorithms: Hill Climbing, Simulated Annealing and Particle Swarm Optimization Algorithms to search the 3D space.
6. Incorporate Global Competitiveness Index factor to normalize performance data.
References
- Adenikinju A, Oderinde LO (2009) Economics of Offshore Oil Investment Projects and Production Sharing Contracts; A Meta Modelling Analysis.
- Adamu MA, Ajienka JA, Ikiensikimama SS (2013) Economics Analysis on the Development of Nigerian Offshore Marginal Fields Using Probabilistic Approach.
- Saidu S, Mohammed AR (2014) The Nigerian Petroleum Industry Bill: An Evaluation of the Effect of the Proposed Fiscal Terms on Investment in the Upstream Sector.
- Wan H, Zhu K (2010) Is investment–cashflow sensitivity a good measure of financial constraints?
- Manaf NAA, Saad N, Ishak Z, Mas’ud A (2014) Effects of Fiscal Regime Changes on Investment Climate of Malaysia’s Marginal Oil Fields: Proposed Model.
- Alalade CB (2004) The Economic Performance of International Oil Companies in Nigeria: The Effect of Fiscal Taxation and the Separation of Ownership and Control.
- Mian MA, Aramco S, Abiola J, Asiweh M (2012) Impact of Tax Administration on Government Revenue in A Developing Economy – A Case Study of Nigeria. International J Business and Social Science 3.
- Acharya B (2010) Questionnaire Design. A paper prepared for a training Workshop in Research Methodology organised by Centre for Post Graduate Studies Nepal Engineering College in collaboration with University Grant Commission Nepal, Pulchok.
- Adepetun S (2000) African Petroleum Contracts, Joint Ventures and Negotiations. A paper presented at the petroleum management institute‘s management leadership programme, Wits Business School, Johannesburg.
- AERA (1999) Standard for Educational and Psychological Testing. American Educational Research Association Washington.
- Agoro SB (2000) How feasible is nigeria`s policy of increasing petroleum production? CEPMLP Annual Review, Article 5.
- Akikungbe OO (2001) The piper, the tune and university autonomy. The Nigerian Social Scientist, Vol. 4, No. 2.
- Alike E (2011) Why FG tinkered with petroleum industry bill. ThisDay Newspaper, Jul, 12.
- Allen NJ, Wells LT (2001) Tax holidays to attract foreign direct investment. lessons From Two Experiments in Allen.
- Using tax incentives to compute for foreign direct investment – are they worth the cost? FIAS Occasional Paper No. 15, Washington.
- Alley C, Bentley D (2005) A remodelling of adam smith‘s tax design principles. Sage Publications, Thousand Oaks.
- Al-Quarni AA (2004) The audit expectation gap in saudi arabia. Perceptions of Auditors, Preparer and Financial Statement Users. A PhD thesis submitted to the Department of Accounting and Business Finance, University of Dundee.
- Alvesson M, Deetz, S, Clegg S, Nord WR, Hardy C, et al. (1996) Critical theory and postmodernism approaches to organizational studies. Handbook of Organization Studies Sage Publications, London (pp:31-56).
- Ameh MO (2005) The Nigerian Oil and Gas Industry: From Joint Ventures to Production Sharing Contracts. African Renaissance Journal 2: 81-87.
- Anderson G (2006) Fiscal instruments in oil and gas regimes. A seminar paper on practical federalism in Iraq, Venice, June 2-11.
- CBN (2008) Domestic Production, Consumption and Prices. Statistical Bulletin, Special Edition CBN (2012): Joint Venture Operations.
- Clark AL (2001) Resource Rent Extraction, Application, Consumption, Investment and Sustainability of Resource-Based Development in Resource-rich Island Economies. A paper presented at the Regional Workshop on the Constrains, Challenges, and Prospects for the Commodity-Based Development and Diversification in the Pacific Island Economies, Aug. 18-20.
- Clinton A, Duncan B (2005) A remodelling of Adam Smith‘s tax design principles.
- Coase RH (1937) The Nature of the Firm. Economica, New Series 4: 386-405.
- Cohen L, Manion L (1994) Research Methods in Education (5thedn), Routledge, London.
- Collins JH et al. (1998) Determinants of Tax Compliance: A Contingency Approach. Journal of the American Taxation Association 12: Issue 1.
- Collis J, Hussey R (2003) Business Research (4thedn), Palgrave Macmillan, Hampshire.
Citation: Wahab L, Diji CJ (2017) Comparative Analysis of Nigeria Petroleum Fiscal Systems Using Royalty and Tax Optimization Models to Drive Investments. Oil Gas Res 3: 145. DOI: 10.4172/2151-6200.1000145
Copyright: © 2017 Wahab L, et al. This is an open-access article distributed under the terms of the Creative Commons Attribution License, which permits unrestricted use, distribution, and reproduction in any medium, provided the original author and source are credited.
Select your language of interest to view the total content in your interested language
Share This Article
Recommended Journals
Open Access Journals
Article Tools
Article Usage
- Total views: 13470
- [From(publication date): 0-2017 - Dec 15, 2025]
- Breakdown by view type
- HTML page views: 11851
- PDF downloads: 1619

