Short Communication Open Access
Coherence Between Power Production during Counter Movement Jump in a Smith Machine and Free Standing with External Loading
| Marie Hilmersson1,2, Ida Edvardsson1 and Åsa B Tornberg2,3* | |
| 1 Surgical and Preoperative Science, Sports Medicine, Umeå University, Sweden | |
| 2 Department of Health Sciences, Division of Physiotherapy, Lund University, Baravägen 3, 221 85 Lund, Sweden | |
| 3 Genetic & Molecular Epidemiology (GAME) Unit, Lund University Diabetes Center (LUDC) Clinical Research Center, Skåne University Hospital, Lund University, Malmö, Sweden | |
| Corresponding Author : | Åsa B Tornberg Department of Health Sciences Division of Physiotherapy Lund University, Lund, Sweden Tel: +4646-2229766 Fax: +4646-2224202 E-mail: asa.tornberg@med.lu.se |
| Received January 09, 2014; Accepted February 20, 2014; Published February 22, 2014 | |
| Citation: Hilmersson M, Edvardsson I, Tornberg AB (2014) Coherence Between Power Production during Counter Movement Jump in a Smith Machine and FreeStanding with External Loading. J Nov Physiother 4:195. doi: 10.4172/2165-7025.1000195 | |
| Copyright: © 2014 Hilmersson M, et al. This is an open-access article distributed under the terms of the Creative Commons Attribution License, which permits unrestricted use, distribution, and reproduction in any medium, provided the original author and source are credited. | |
Visit for more related articles at Journal of Novel Physiotherapies
Abstract
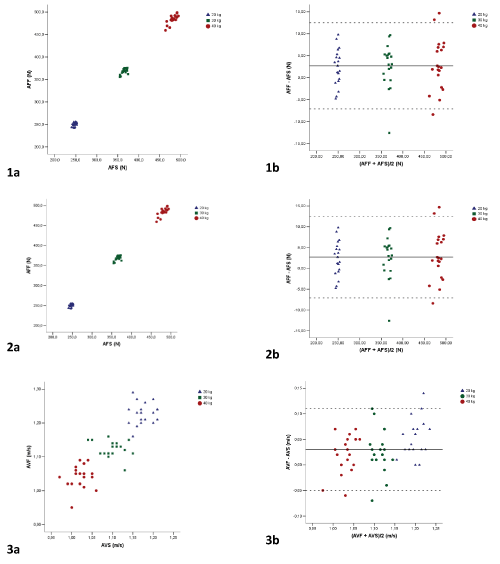
The purpose of this study was to evaluate the coherence of power production during a Counter Movement Jump (CMJ) performed in a Smith Machine (SM) and Frees Standing (FS). Two female athletes performed 10 test sessions with three days in between. Each test session included two-legged CMJ performed in a SM and FS with external loads. Variables analyzed were Average Power (AP), Average Force (AF) and Average Velocity (AV). The correlation between the results from CMJ performed in a SM and FS was high (rp=0.87-1.0, p<0.001). The results showed a good test-retest reliability for all indices, for both CMJ performed in a SM and FS with Coefficient of Variance (CV) for AP (CVSM=3.1- 3.5 %; CVFS=2.9-4.8 %), AF (CVSM=1.6-1.9 %; CVFS=1.6-2.1 %), and AV (CVSM =1.7-2.7 %; CVFS =1.8-2.9 %). Though significantly higher values were seen during FS CMJ analyzed by Bland-Altman plots with AP (Bias: 13.7 W; LOA -19.1 to 46.5 W), AF (Bias: 2.7 N; LOA -7.0 to 12.4 N) and AV (Bias: 0.03 m/s; LOA -0.05 to 0.11 m/s). In conclusion, athletes and coaches are able to use both SM and FS CMJ to evaluate training progress, but they should be aware about the differences between SM and FS CMJ.
| Keywords |
| Jump ability; Muscle strength; Neuromuscular capacity; Reliability |
| Introduction |
| Vertical jumps are commonly used to evaluate strength, power and jump height in sports [1-4]. To be able to generate high power is important for many elite athletes. Elite athletes need to test their progress from training on a regular basis and it is very important that the test methodology is trustworthy, by means of high test-retest reliability and small within-subject variation [5]. |
| Countermovement Jump (CMJ) is one of the most commonly used vertical jump to evaluate power production since it has both a concentric and an eccentric phase, which is the natural movement in most of sports. CMJ has also been shown to be reliable when it comes to measuring power production [6,7]. Jumping during sports is naturally performed free standing. When developing tests to assess performance it is important to make a test as similar to the sport as possible. The use of loaded vertical jumps in studies has been used before and is known to be effective in strength and power production training [8,9]. In our lab we have developed a test procedure including loaded CMJ. For safety reasons these tests has been performed in a Smith Machine (SM). We wanted to explore if there were any significant differences between loaded CMJ in a SM compared to Free Standing (FS). To the best of our knowledge is there no earlier study on the coherence of SM CMJ and FS CMJ. |
| Methods |
| Experimental approach to the problem |
| Two female (24 and 25 years) athletes were recruited into this study performing ten test-retests CMJ with external load in a SM and FS with a three-day interval between tests for evaluation of coherence. A ten-minute sub-maximal warm-up on a bicycle with a workload of 1 W∙kg-1 body weight was performed prior each test secession. This was followed by a familiarization session of three jumps on a sub-maximal level. During testing verbal encouragement was used at every attempt. The participant was trained non-athletes. This study was conducted according to the Helsinki declaration. |
| Procedures |
| Each subject performed three jumps on both legs at every load 20, 30 and 40 kg. The loads were chosen in coherence with those used in our lab during testing of female elite athletes. A three-minute rest followed the three jumps on each load. The participants were given verbal guidance concerning the positions during the CMJ. The best jump on every load was used for evaluation. The Muscle Lab 4010, linear encoder was used for measures of Average Power (AP), Average Force (AF) and Average Velocity (AV). To be able to analyze the motion during CMJ in Dartfish (version 4.5.1.0, Fribourg, Switzerland) the jumps were recorded from the left side with a digital video camera. To make the analyzing easier, tape markings were placed on trochanter major, the lateral condyle and just above the lateral malleolus of fibula on the left leg. |
| Apparatus and Calculations |
| Muscle Lab 4010, linear encoder: assesses speed and acceleration of the dumbbell through a wire attached to the dumbbell. Average power was calculated through the formula P=F∙v (P=power, F=force and v=velocity). Average force was calculated through the formula F=m∙g +m a (g=9.81 m∙s-2 gravitation, m=mass kg and a=acceleration m∙s-2). |
| Statistics |
| Values throughout are given as means and Standards Deviations (SD). Paired Students t-test was used to compare mean during testretest [10]. The p<0.05 criterion was used for establishing statistical significance. |
| Various methods of assessing test-retest reliability were used. 1) Mean and standard deviation. 2) The Coefficient of Variance (CV) was calculated as the standard deviation of the difference scores between test and retest divided by the rot square of ten divided by the mean of all test results. |
| Methods of assessing coherence between SM CMJ and FS CMJ used were. 1) Mean and standard deviation. 2) Pearson’s correlation was used to analyze interaction between SM CMJ and FS CMJ and 3) methods were compared in a Bland-Altman analysis to find any systematic variance (bias) in the indices AP, AF and AV (Bland and Altman 1986). 4) Limits of Agreement (LOA) was calculated from the Bland-Altman plots to show upper and lower LOA (Bland and Altman 1986). All statistical analyses were performed using SPSS for Windows (version 18.0, PASW Inc, Chicago, Illinois, USA). |
| Results |
| Test-retest |
| The results (Table 1) showed good test-retest reliability for AP, AF and AV during CMJ performed in both a SM and FS. |
| Coherence |
| SM CMJ and FS CMJ were highly correlated (Figure 1). Limits of Agreement (LOA) for AP, AV and AF showed a positive bias for FS CMJ (Figure 1). |
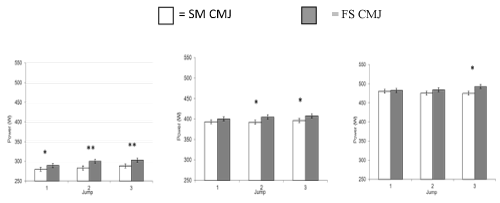
| When analyzing during which of the three attempts the highest results was achieved a difference between SM CMJ and FS CMJ was seen. During FS CMJ the highest result tended to happen during the last attempt while during SM CMJ no such pattern was seen (Figure 2). |
| Discussion |
| The main finding of this study was that we found high reproducibility and coherence of SM CMJ and FS CMJ, even though a systematic positive bias was seen for FS CMJ. |
| Test-retest |
| The overall results show that the test-retest reliability was good since CV was low for the indices analyzed [6,7]. They have suggested that CV values below 10% to be reliable. In our study the CV values were low (< 5%) and it implies that SM CMJ and FS CMJ with external load are tests with high reproducibility, and that probably even could detect small changes in performance. |
| The highest variance was seen in AP both in SM CMJ and FS CMJ. It seems as the variance in AF and AV gives an additive effect on AP (Table 1). The lowest variance was seen in AF in both SM CMJ and FS CMJ. The variance of FS CMJ tended to increase with increased external load, while no such pattern was observed for SM CMJ (Table 1). Also noted was that during FS CMJ the highest result tended to happen during the last attempt while during SM CMJ no such pattern was seen (Figure 2). This may reflect the sensation of instability during FS CMJ compared to SM CMJ. |
| Coherence |
| The coherence between SM CMJ and FS CMJ in our study may be considered as high. A high correlation coefficient, according to [10], are values above 0,8. [1,11] defines values of Pearson’s correlation coefficient rp > 0.9 as nearly perfect, 0.7-0.9 as very high, 0.5-0.7 as high, 0.3-0.5 as moderate, 0.1-0.3 as small and 0.1 or less as trivial. |
| Even though the variance analysis could be interpreted, as FS CMJ was a test in an instable position the highest values were recorded during FS CMJ (Table 1) and a positive bias for FS CMJ was reviled during the Bland-Altman analysis [12] (Figure 1). The positive effects on variance of the stability from the SM, may alter the motion during CMJ. During FS CMJ tilting of the upper body is allowed which gives a favorable position for the extensor muscles of the back to participate in force production during FS CMJ compared to SM CMJ. Not just a higher AF was seen during FS CMJ but also a higher AV (Table 1). This may be explained both by the position of the motion and that it may be due to friction in the SM. |
| Acknowledgements |
| The authors wish to thank Professor per Wollmer, Department of Clinical Sciences, Malmö for support planning the study and Kenneth Riggberger, Malmö Sports Academy for skillful support during measurements. This study was supported by Malmö Sports Academy, Lund University and by grants from Sveriges Riksidrottsförbund. |
References |
|
Tables and Figures at a glance
| Table 1 |
Figures at a glance
 |
 |
| Figure 1 | Figure 2 |
Relevant Topics
- Electrical stimulation
- High Intensity Exercise
- Muscle Movements
- Musculoskeletal Physical Therapy
- Musculoskeletal Physiotherapy
- Neurophysiotherapy
- Neuroplasticity
- Neuropsychiatric drugs
- Physical Activity
- Physical Fitness
- Physical Medicine
- Physical Therapy
- Precision Rehabilitation
- Scapular Mobilization
- Sleep Disorders
- Sports and Physical Activity
- Sports Physical Therapy
Recommended Journals
Article Tools
Article Usage
- Total views: 15160
- [From(publication date):
February-2014 - Jul 05, 2025] - Breakdown by view type
- HTML page views : 10587
- PDF downloads : 4573
