Climatic Trend of Lapse Rate Considering the Impression of AOD over a Tropical Coastal Station
Received: 21-Apr-2014 / Accepted Date: 22-May-2014 / Published Date: 25-May-2014 DOI: 10.4172/2157-7617.S11-006
Abstract
Changes in boundary layer lapse rate with changing aerosol loading in the atmosphere bring about some interesting information concerning climate feedbacks. Aerosols have direct and indirect effects on climate system by various physical mechanisms. Some of them are well understood while some require more reasoning and interpretations. The present study used satellite derived data of Aerosol Optical Depth (AOD) and Solar Radiation along with radiosonde upper air sounding data over a coastal station Dabolim, Goa (15.38°N, 73.83°E) of India to investigate their effect on changing the boundary layer (upto 850 hPa) lapse rate over the years. Twelve years (2001- 2012) radiosonde winter season (December, January and February) data have been analyzed to develop a multiple linear regression model to predict boundary layer lapse rate over the site and subsequently a univariate Markov chain prediction model is introduced to anticipate the future scenario.
Keywords: Aerosol; Lapse rate; Radiosonde; Markovian model; Climatic trend
10781Introduction
Atmospheric aerosols have suspension of fluid, solid, or miscellaneous particles with highly unpredictable chemical composition and size distribution [1]. Aerosols have various values of optical properties. Its unpredictability is due to the plentiful sources and unreliable structure mechanisms. The aerosol optical properties change regionally depending on emission and transport of aerosols, and meteorological conditions. Atmospheric aerosols have two properties like absorbing in nature and other than scattering nature on solar radiation which play very important role in modulating climate atmosphere and the hydrosphere [2-4]. The aerosol when scatters the solar radiation then causes the warming in boundary layer. Aerosols particle properties change time to time through many processes like coagulation, condensation and chemical reaction. Ingestion of water by aerosol raises particles size and these processes depend on chemical composition, size of particles and ambient relative humidity [5].
Aerosol has well-known impacts on clouds. Aerosols can serve as Cloud Condensation Nuclei (CCN) and ice nuclei and take part in changing cloud micro-physics. Increased number of CCN caused in reducing cloud droplet size and accordingly affects the cloud albedo which influences the precipitation pattern, cloud cover and possibly the frequency of extreme events [6].
Some studies on aerosol mostly paying attention in anthropogenic effect on regional climate [7,8] by employing to global models to estimate resulting climate responses to ultimately experimental changes in burden of aerosol in the atmosphere. In globally the large quantity value of aerosol optical depth are found in Asia and the tropical region of Africa because here large spatial and temporal variability in global aerosol composition.
In this study we have established a relationship between boundary layer (upto 850 hPa) lapse rate and other parameters like AOD, solar radiation, surface temperature and surface relative humidity. In an attempt to isolate the impacts of common meteorological influence, such relationships have also been studied in two standard statistical methods viz. multiple linier regression [9] and first order Markov chain model. The humidity, temperature, solar radiation and pressure are meteorological factors which playing a leading role for the regional mixture of air pollutants. The multiple regression statistical models provide good solution for air pollutant predictions [10].
Materials And Methods
The location of the study is Dabolim, Goa (15.38°N, 73.83°E), situated near west coast of India. In this location data are collected and necessary computations are made for the winter season (Dec, Jan, Feb) during the year 2001 to 2012. The data set consists of the monthly mean Aerosol Optical Depth (AOD) during study period derived from Moderate Resolution Imaging Spectroradiometer (MODIS) satellite sensor at 550 nm. Many researcher are described the method of deriving AOD in earlier studies [11-13]. AOD used for the present study are the L3 MODIS data product, version 4 reported at 1×1 spatial grids. The monthly mean Solar Radiation (in W/m2) is collected from the Global Land Data Assimilation System (GLDAS) 0.25 Degree Monthly Products satellite sensor. The selected station, being situated at the west coast of India, receives average 11 hour to 11and ½ hours of sunshine which is normal for tropical stations. Average sunrise and sunset time along with mean day time and their standard deviations are listed in Table 1. As the distance from water body (sea) is only 2 km, Dabolim station possesses plenty of moisture supply in atmosphere and the land breeze-sea breeze circulation maintains maritime weather.
| Months | Sunrise (in IST) | Sunset (in IST) | Average Day time (in hour) |
|---|---|---|---|
| December | 6:53 (± 8 min) | 18:07 (± 4) | 11:14 (± 6) |
| January | 7:04 (± 3 min) | 18:23 (± 10) | 11:19 (± 6.5) |
| February | 6:59 (± 5) | 18:37 (± 5) | 11:38 (± 5) |
Table 1: Sunrise, sunset and average day time along with their standard deviation over the station Dabolim, Goa.
Twelve years winter season (2001-2012, between December- February) dataset of radiosonde measurements [14] from Goa station is analyzed in this study. Atmospheric Sounding dataset are obtained from the University of Wyoming (www.weather.uwyo.edu). The study used the radiosonde data parameters that are the vertical profiles of Pressure (hPa), Temperature (T), and Relative Humidity (%). Lapse rate from surface to 850 hPa height is considered as boundary layer lapse rate. Multiple Liniar Regression (MLR) models were employed to examine the association of Lapse Rate (LR), AOD with temperature (T), surface relative humidity (SRH) and solar radiation (SR) results in formulation of a 1st order MLR equation like;
 (1)
(1)
In equation (1) m is the slope of the line and c is the y-intercept, y and x is a variables. The output from this MLR is used in another illustrious statistical model, first order Markov Chain, to assess the future trends of lapse rate over the location. These models are very useful for simulating many practical purposes, manufacturing system [15] and inventory system [16]. Markov chain is stochastic model which estimates transition probabilities between discrete states in the observed systems.
 (2)
(2)
Where Pr denotes the conditional probability, X is a random variable that contains time series values from 1 to n. First order Markov chain implies that the probability of present (n) depends only on its immediate past (n-1). Similarly, probability of future (n+1) will be dependent only on the present (n). This technique has been implemented in the present study to obtain the future scenario of lapse rate from the present lapse rate conditions.
Results And Discussion
As the warming or cooling in boundary layer can be appraised by the temperature lapse rate (dT/dz), similarly humidity lapse rate (dRH/ dz) offers good supportive information. Figure 1 shows the variation of (a) temperature and (b) humidity lapse rate within the boundary layer (surface to 850hPa) over the site. It is observed that the average temperature of surface boundary layer is getting warmer than the past years. Its worth to mention that almost 5-6 years repetitive pattern are observed that is from 2001 to 2006 have some increasing pattern while 2007-2012 shows decreasing trends. This phenomenon is also reflected in humidity lapse rate but in opposite fashion. The analysis indicates dry and warm atmospheric boundary layer to persist in coming years.
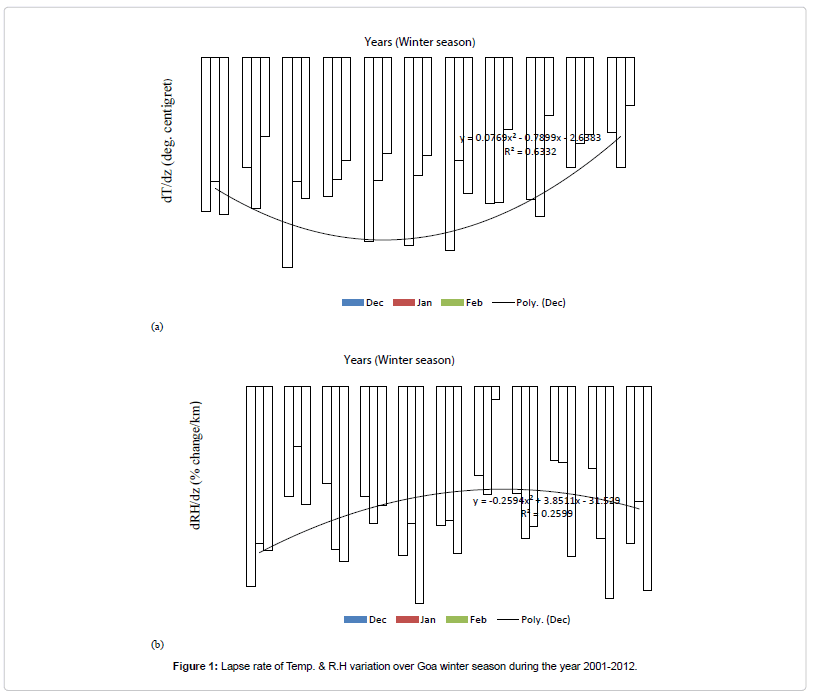
Figure 1: Lapse rate of Temp. & R.H variation over Goa winter season during the year 2001-2012.
Figure 2 shows the relationship of AOD (a) with dT/dz and (b) with dRH/dz. In this analysis the AOD and lapse rate temperature are correlated to each other in 2001 to 2012 year pattern and found that as the AOD increases the lapse rate temperature also increases while the lapse rate relative humidity (dRH/dz) depicts some reverse pattern, i.e. when the AOD increases, dRH/dz decreases and vice versa in 11 years observation (2001-2012). So it can be inferred that the atmospheric boundary layer becoming dry and warmer. This observation also extrapolated the fact that the boundary layer temperatures depends on AOD changes. During the course of the study solar radiation effects on temperature lapse rate within boundary layer are also analyzed. It is shown on Figure 3. These observations revealed that from year 2001-2007, solar radiation is more or less inversely proportional to the AOD but from the year 2008 onwards the trend is just reverse i.e. both parameters are directly proportional. The dT/dz and solar radiation are in slightly positive correlation (0.2301). To investigate the combined effect of surface temperature and surface RH on lapse rate a 3D graph (xyz) is plotted (Figure 4a) and found that decrease in surface RH and increase in surface temperature results in increased lapse rate from -2 to -1. Similarly (Figure 4b) depicts that increased AOD can increase the surface temperature. The impact of different parameters (viz. T, SRH, solar radiation and AOD) on lapse rate, are tested using set of multiple linear regression equations. In this statistical analysis lapse rate are assigned as dependent variable while T, AOD, SRH and solar radiation (SR) are independent variables. The sets of equation with different dependant variable are shown below;
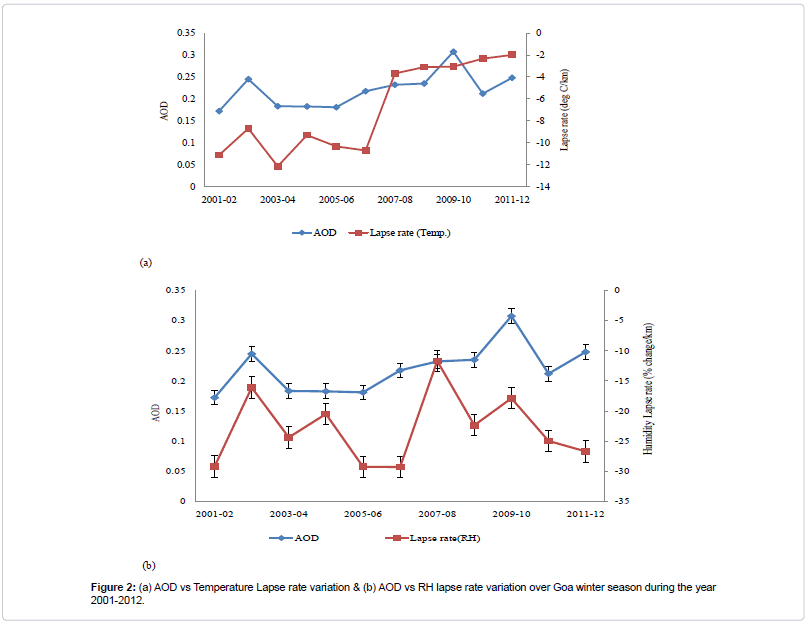
Figure 2: (a) AOD vs Temperature Lapse rate variation & (b) AOD vs RH lapse rate variation over Goa winter season during the year 2001-2012.
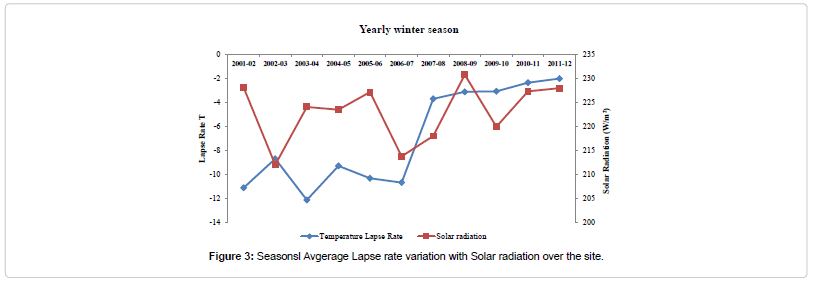
Figure 3: Seasonsl Avgerage Lapse rate variation with Solar radiation over the site.
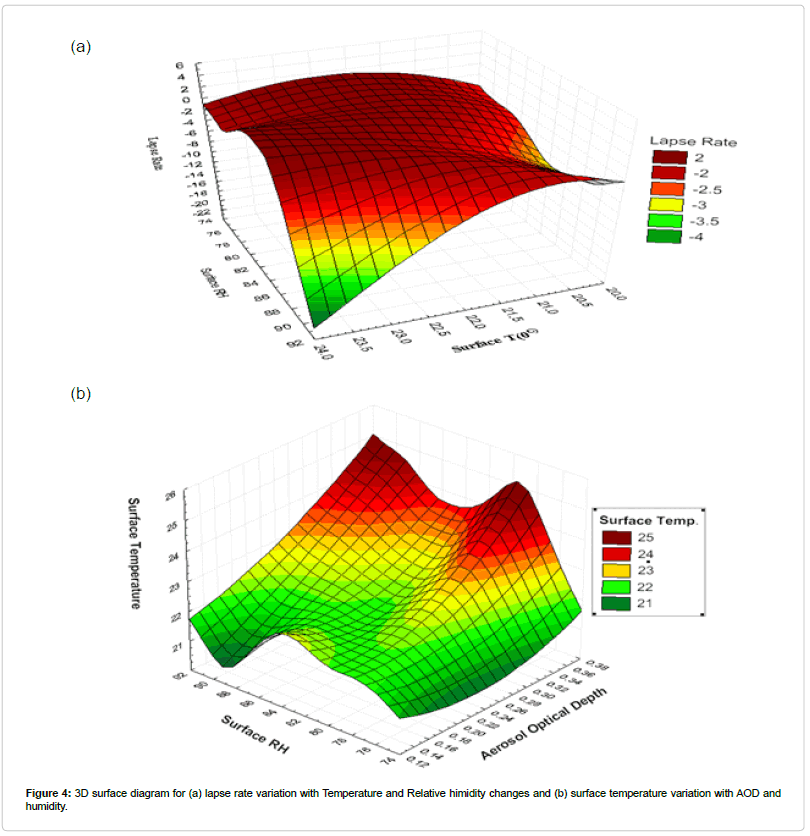
Figure 4: 3D surface diagram for (a) lapse rate variation with Temperature and Relative himidity changes and (b) surface temperature variation with AOD and humidity.
(i) Including all independent parameters
 (3)
(3)
(ii) Excluding AOD
 (4)
(4)
(iii) Excluding Solar Radiation (SR)
 (5)
(5)
The predicted values of dT/dz obtained from the above three equations are presented in Figure 5. Those predicted values incurred from equation 3 (i.e. including all independent parameters) have more closeness to actual observations. Predicted values of lapse rate by excluding AOD from equation provide more deviation from observed values than that observed by excluding solar radiation. Figure 6 shows the box-whisker and scatter plots of observed vs predicted dT/dz for (a) all independent variables, (b) without AOD and (c) without solar radiation along with their correlation coefficient (r) values. It is worth to mention that equation 3 gives highest correlation coefficent value (r = 0.67) for observed and predicted values of lapse rate (Figure 6). While excluding AOD gives very poor correlation (r = 0.26) value between observed and predicted lapse rate. Root Mean Squared Error (RMSE) and Mean Absolute Error (MAE) are computed using the following equations and represented in Figure 7.
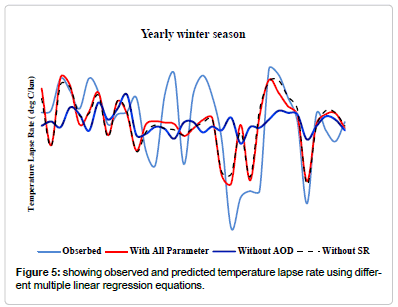
Figure 5: showing observed and predicted temperature lapse rate using different multiple linear regression equations.
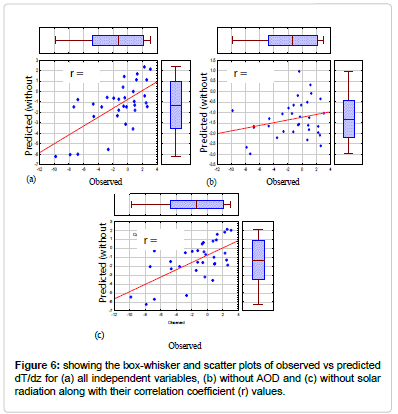
Figure 6: showing the box-whisker and scatter plots of observed vs predicted dT/dz for (a) all independent variables, (b) without AOD and (c) without solar radiation along with their correlation coefficient (r) values.
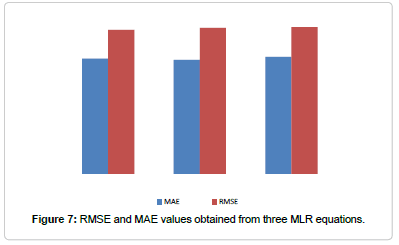
Figure 7: RMSE and MAE values obtained from three MLR equations.
 (6)
(6)
 (7)
(7)
Where n is the number of observations, Yobs and Yp are the observed and predicted values respectively.
Time series of best fitted predicted lapse rate (that obtained from equation 3) are then used for first order Markov chain model analysis. Value of immediate past is analyzed and projected for immediate future following the equation 2. Figure 8 represents the actual observation, MLP predicted value and future trend of temperature lapse rate (for next 10 seasons, up to the year 2021). It is observed that there are fluctuations in future projected values of winter seasons lapse rate however the general trend is increasing in nature.
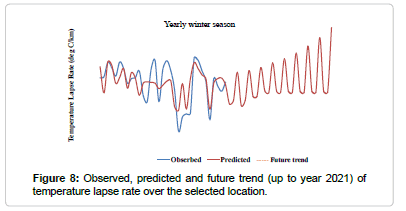
Figure 8: Observed, predicted and future trend (up to year 2021) of temperature lapse rate over the selected location.
Applicability and Limitations
Two well-known statistical methods are used in the present study to assess the effect of aerosol in boundary layer lapse rate and to foresee the climatic trend over the selected location. This method can be applied with other associated meteorological parameters also to check the robustness of the equations used and also be tested for other seasons (other than winter) and other stations too. The future scenario is obtained by univariate (using only one variable) Markov chain analysis so the prolong future lapse rate values may deviate from reality but a general climatic trend can easily be apprise from that.
Conclusion
The consequences of increased aerosol loading in the atmosphere are diverse. Realization of various climatic feedbacks in this regard can be obtained upon analysis. Winter season analysis of boundary layer lapse rate over a coastal area of western India (Dabolim, Goa) evinces quite a good role of aerosols (in form of AOD) in modulating climatic trends. As reflected by the correlation coefficient value (r = 0.67), AOD has the highest sensitivity than other meteorological variables in changing or setting a trend in boundary layer lapse rate. A univariate (using only one variable) Markov chain analysis ascertains the warming of boundary layer in coming years. Though there may arise some doubts about the increased values of projected lapse rate but the increasing trend is irrefutable.
Acknowledgement
Authors acknowledge Giovanni MODIS and Global Land Data Assimilation System (GLDAS) for AOD and solar radiation data. University of Wyoming is also acknowledged for providing sounding data for the research. Authors are thankful to Dr. S. R. Wate, Director, National Environmental Engineering Institute (NEERI) for his kind encouragement.
References
- Putaud JP, Dingenen RV, Alastuey A, Bauer H, Birmili W, et al. (2010) A European aerosol phenomenology-3: Physical and chemicalcharacteristics of particulate matter from 60 rural, urban, and kerb side sites across Europe. Atm Environ44:1308-1320.
- Ramanathan V, Crutzen PJ, Kiehl JT, Rosenfeld D (2001) Aerosols, climate and the hydrological cycle. Science 294:2119-2124.
- Charlson RJ, Schwartz SE, Hales JM, Cess RD, Coakley JA, et al. (1992) Climate forcing by anthropogenic aerosols. Science 255:423-430.
- IPCC 2007 Climate Change (2007) The physical science basis, In: Contribution of Working Group I to the Fourth Assessment Report of the Intergovernmental Panel on Climate Change, Cambridge University Press, New York, USA.
- Myhre G, Myhre CEL, Samset BH, Storelvmo T (2013) Aerosols and their Relation to Global Climate and Climate Sensitivity. Nature Education Knowledge 4:7.
- Kaufman YJ,Koren I (2006) Smoke and pollution aerosol effect on cloud cover. Science 313:655-658.
- Lau KM, Kim KM (2006) Observational relationship between aerosol and Asian monsoon rainfall, and circulation. Geophys Res Lett 33: L21810.
- Collier JC, Zhang GJ (2009) Aerosol direct forcing of the summer Indian monsoon as simulated by the NCAR CAM3. ClimDyn 32 313-332.
- Shumway RH, Stoffer DS (2010) Time Series Analysis and Its Applications with R Examples(2nd edn.). Springer, Germany.
- Chelani AB, Rao CVC, Phadke KM, Hasan MZ (2002) Prediction of sulphur dioxide concentration using artificial neural networks. Environ Model Soft 17:161-168.
- Rajeev K, Ramanathan V, Meywerk J (2000) Regional aerosol distribution and its long-range transport over the Indian Ocean. J Geophys Res 105:2029-2043.
- Nair SK, Rajeev K, Parameswaran K (2003) Winter time regional aerosol distribution and the influence of continental transport over the Indian Ocean. J Atmos Sol TerrPhys 65: 149-165.
- Nair SK,Parameswaran K, Rajeev K (2005) Seven-year satellite observations of the mean structures and variabilities in the regional aerosol distribution over the oceanic areas around the Indian subcontinent. AnnGeophys 23: 2011-2030.
- Durre I, Vose RS, Wuertz DB (2006) Overview of the Integrated Global Radiosonde Archive. J Climate 19:53-68.
- Buzacott J, Shanthi KJ (1993) Stochastic Models of Manufacturing Systems, New Jersey: International edn. Prentice-Hall, USA.
- Nahmias S (2009) Production and Operation Analysis. Chicago: McGraw Hill International, USA.
Citation: Middey A, Kumar N, Rao PS (2014) Climatic Trend of Lapse Rate Considering the Impression of AOD over a Tropical Coastal Station. J Earth Sci Climat Change S11: 006. DOI: 10.4172/2157-7617.S11-006
Copyright: © 2014 Middey A, et al. This is an open-access article distributed under the terms of the Creative Commons Attribution License, which permits unrestricted use, distribution, and reproduction in any medium, provided the original author and source are credited.
Share This Article
Recommended Journals
Open Access Journals
Article Tools
Article Usage
- Total views: 15478
- [From(publication date): 0-2014 - Apr 03, 2025]
- Breakdown by view type
- HTML page views: 10870
- PDF downloads: 4608