Make the best use of Scientific Research and information from our 700+ peer reviewed, Open Access Journals that operates with the help of 50,000+ Editorial Board Members and esteemed reviewers and 1000+ Scientific associations in Medical, Clinical, Pharmaceutical, Engineering, Technology and Management Fields.
Meet Inspiring Speakers and Experts at our 3000+ Global Conferenceseries Events with over 600+ Conferences, 1200+ Symposiums and 1200+ Workshops on Medical, Pharma, Engineering, Science, Technology and Business
Image Open Access
Climate Predicts Obesity Rates
| LisaAnn S Gittner1*, Barbara Kilbourne2, Katy Kilbourne3 and Youngwon Chun4 | |
| 1Department of Political Science, Texas Tech University, USA | |
| 2Department of Sociology, Tennessee State University, USA | |
| 3Department of Family Medicine, Meharry Medical College, USA | |
| 4School of Economic, Political and Policy Sciences, University of Texas at Dallas, USA | |
| Corresponding Author : | LisaAnn S Gittner Department of Political Science Texas Tech University, Lubbock TX 79409, USA Tel: (440) 915-8831 Fax: (806)742-0850 E-mail: lisa.gittner@ttu.edu |
| Received June 28, 2015; Accepted June 29, 2015; Published June 30, 2015 | |
| Citation: Gittner LS , Kilbourne B, Kilbourne K and Chun Y(2015) Climate Predicts Obesity Rates . J Obes Weight Loss Ther 5:i001. doi:10.4172/2165-7904.1000i001 | |
| Copyright: ©2015 Gittner LS, et al. This is an open-access article distributed under the terms of the Creative Commons Attribution License, which permits unrestricted use, distribution, and reproduction in any medium, provided the original author and source are credited. | |
Visit for more related articles at Journal of Obesity & Weight Loss Therapy
| Medical Image |
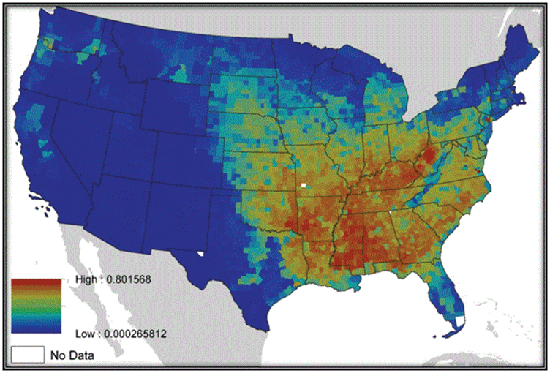
| Maximum Entropy modeling predicted the distribution of obesity from only climate factors (heat index, minimum & maximum daily temperature, precipitation, land surface temperature and insolation) in 2009. The orange and yellow represent the presence of high obesity rates in individual counties. Climate factors in these counties were used to predict the obesity distribution. As the color on the map changes from blue to green and yellow, higher rates of obesity are predicted; the highest rates of obesity predicted are the intense yellows. The predicted obesity rates match the actual rates determined by the Centers for Disease Control. |
 |
--
Post your comment
Relevant Topics
- Android Obesity
- Anti Obesity Medication
- Bariatric Surgery
- Best Ways to Lose Weight
- Body Mass Index (BMI)
- Child Obesity Statistics
- Comorbidities of Obesity
- Diabetes and Obesity
- Diabetic Diet
- Diet
- Etiology of Obesity
- Exogenous Obesity
- Fat Burning Foods
- Gastric By-pass Surgery
- Genetics of Obesity
- Global Obesity Statistics
- Gynoid Obesity
- Junk Food and Childhood Obesity
- Obesity
- Obesity and Cancer
- Obesity and Nutrition
- Obesity and Sleep Apnea
- Obesity Complications
- Obesity in Pregnancy
- Obesity in United States
- Visceral Obesity
- Weight Loss
- Weight Loss Clinics
- Weight Loss Supplements
- Weight Management Programs
Recommended Journals
Article Tools
Article Usage
- Total views: 13768
- [From(publication date):
June-2015 - Apr 04, 2025] - Breakdown by view type
- HTML page views : 9252
- PDF downloads : 4516
