Climate Change Perspective: Key factors learn from the COVID-19 Pandemic
Received: 01-Apr-2022 / Manuscript No. jescc-22-59938 / Editor assigned: 04-Apr-2022 / PreQC No. jescc-22-59938 (PQ) / Reviewed: 18-Apr-2022 / QC No. jescc-22-59938 / Revised: 22-Apr-2022 / Manuscript No. jescc-22-59938 (R) / Accepted Date: 22-Apr-2022 / Published Date: 29-Apr-2022 DOI: 10.4172/2157-7617.1000617
Abstract
Long-term variations in temperature, rainfall, precipitation, or wind patterns are referred to as "Climate Change." Natural disasters are expected to become more frequent and intense as a result of climate change, with negative social, economic, and environmental implications. The majority of climate change in the contemporary era is due to anthropogenic activities. On the other hand, any human-caused climate change will be layered on top of a background of natural climatic variations that occur over a wide range of space and time ranges. The majority of people are unaware that plastics are made from fossil fuels. Plastic consumption accounts for around 6% of world oil consumption and is anticipated to rise to 20% by 2050. As a result of the energy-intensive operations necessary to extract and distill oil, plastic manufacturing produces massive amounts of greenhouse gas (GHG) emissions. This study reviews how the COVID-19 pandemic has temporarily reduced GHG emissions while increasing demand for single-use plastics, adding to the burden on an already out-of-control global plastic waste catastrophe. In the absence of effective treatment, governments around the world have mandated lockdown measures, as well as residents voluntarily limiting nonessential trips and activities. By early April 2020, daily global CO2 emissions had fallen by –17 percent (–11 to –25 percent for 1) when compared to the mean 2019 levels, with changes in surface transportation accounting for slightly less than half of the decline. Individual countries' emissions declined by 26% on average when they were at their peak. The impact on 2020 yearly emissions is dependent on the length of confinement, with a low estimate of –4% (–2 to –7%) if pre-pandemic circumstances recover by mid-June and a high estimate of –7% (–3 to –13%) if some limitations stay in place globally until the end of 2020. The total global CO2 reduction from January to April 2020 is expected to be more than 1749 Mt CO2 (a 14.3% decrease), with transportation accounting for the majority (58%) of the reduction, next off coal power generation (29%), and industry (10%). The COVID-19 pandemic has raised demand for single-use plastics, putting to the pressure on a worldwide plastic waste crisis that is already unmanageable. This mismanaged plastic waste (MMPW) is subsequently released into the environment, with some of it ending up in the ocean. The MMPW generated by the pandemic will be 11 million tons, culminating in a global riverine discharge of 34,000 tons into the ocean. As of August 23rd 2021, 193 countries had produced 8.4 (+/-1.4) million tons of pandemic-related plastic waste, with 25.9 (+/-3.8) thousand tons dumped into the ocean, amounting to 1.5 percent (+/-0.2%) of global total riverine plastic discharge. Because of India's record-breaking confirmed cases, MMPW generation and discharge are projected to be more skewed toward Asia. As a result, transportation was identified as the primary source of more than half of the emissions reductions during the epidemic. This strongly suggests that changing typical working patterns, such as reducing commuting to work, working from home, and conducting online meetings or site visits, can have a real impact on GHG emissions. A considerable amount of the outflow is medical waste, which increases the risk to the environment and human health, or even the COVID-19 virus being spread. This demonstrates how waste management necessitates structural modifications. This review will aid individuals in comprehending the updating of the GHG management policy and use of plastic and its environmental repercussions in the event of a pandemic such
Keywords
CO2; GHG, Plastic pollution; MMPW; Covid-19
Introduction
Long-term variations in temperature, rainfall, precipitation, or wind patterns are referred to as climate change [1]. Natural disasters are expected to become more frequent and intense as a result of climate change, with negative social, economic, and environmental implications. The majority of climate change in the contemporary era is due to anthropogenic activities. On the other hand, any humancaused climate change will be layered on a background of natural climatic variations that occur over a wide range of space and time ranges [2]. Most people do not realize that plastics originate from fossil fuels. Plastic consumption accounts for around 6% of world oil consumption and is anticipated to increase to 20% by 2050. As a result of the energy-intensive operations necessary to extract and distill oil, plastic manufacturing produces massive amounts of greenhouse gas (GHG) emissions. This study highlights the temporary reduction in GHG emissions and increased demand for single-use plastics, adding to the pressure on an already out-of-control global plastic waste crisis caused by the COVID-19 pandemic. The coronavirus 2019 (COVID 19, or SARS-CoV-2) pandemic, which is a type of pneumonia, began in Wuhan, Hubei Province, China, in December 2019 [3,4]. Over 81.5 million instances had been documented globally in 223 countries as of December 2020, including sovereign, dependent territories, and self-declared nations [5]. On March 11, 2020, the WHO declared the COVID-19 outbreak a global pandemic. In many locations around the world, the pandemic needed severe countering methods like as social isolation, donning face masks, and imposing strict lockdowns. The lockdowns brought economic, physical, and social activity to a halt, but also had a favorable impact on air quality, the environment, and greenhouse gases (GHGs), especially CO2 emissions [6].
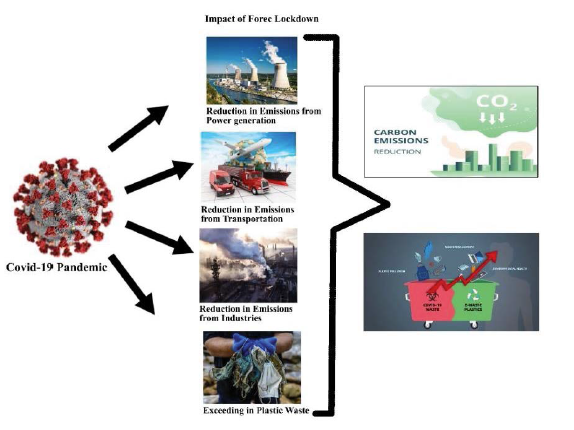
Since the pre-industrial era, anthropogenic greenhouse gas emissions have gradually increased, owing mostly to economic and population growth, and are now at their highest levels ever (IPCC, 2014). Increased concentrations of greenhouse gases (CO2, CH4, N2O, and others) have ensued, trapping heat and causing the Earth to warm while simultaneously diminishing the efficiency with which the Earth cools to space [7]. The COVID-19 pandemic has been one of the worst of its kind in the last century in terms of global deaths, and in the lack of any effective treatment, governments around the world have mandated lock-down measures, as well as residents voluntarily minimizing nonessential trips and activities. When compared to the mean 2019 levels, daily worldwide CO2 emissions had fallen by –17% (–11 to –25% for 1) by early April 2020, with changes in surface transportation accounting for little under half of the decline. Individual countries' emissions declined by 26% on average when they were at their peak. The impact on 2020 yearly emissions is dependent on the length of confinement, with a low estimate of –4% (–2 to –7%) if pre-pandemic circumstances recover by mid-June and a high estimate of –7% (–3 to –13%) if some limitations stay in place globally until the end of 2020 [8]. Following the crisis, government measures and economic incentives are expected to have a long-term impact on global CO2 emissions. The total global CO2 reduction from January to April 2020 was predicted to be more than 1749 Mt CO2 (a 14.3% decline), with the transportation sector contributing the most (58%) followed by coal power generation (29%), and industry (10%) [9]. As a result, transportation was identified as the primary source of more than half of the emissions reduction during the epidemic. This strongly suggests that changing typical working patterns, such as reducing commuting to work, working from home, and doing online meetings or site visits, can have a real impact on GHG emissions. The resulting yearly decline will be much smaller (–4.2 to –7.5%, according to our sensitivity studies), but it will be comparable to the annual reductions required over the next decades to keep global warming to 1.5 degrees Celsius [10,11]. These figures highlight both the rapid increase in global emissions over the last 14 years and the magnitude of the task we face in limiting climate change in accordance with the Paris Climate Agreement. After one use, the majority of the million tons of plastic manufactured each year is discarded. Plastic bottles, bags, food containers, gloves, and cups that end up in landfills and the environment could survive hundreds of years or more. Furthermore, the COVID-19 pandemic, which is caused by a novel coronavirus (SARS-CoV-2), would worsen global plastic pollution since personal protective equipment (PPE, such as gloves and masks) is now required to prevent the virus from spreading. The COVID-19 pandemic has raised demand for single-use plastics, putting to the pressure on a worldwide plastic waste crisis that is already out of control [12]. In particular, pandemic epicenters struggle to handle the waste and not all old personal protective equipment (PPE) and packaging materials are handled or recycled. This mismanaged plastic waste (MMPW) is subsequently released into the environment, with some of it ending up in the ocean. The unleashed plastics can travel large distances in the water, collide with marine life, and cause injury or death. The number of confirmed cases is expected to reach 280 million by the end of 2021, according to conservative estimates. The total MMPW generated by the pandemic will be 11 million tons, culminating in a global riverine discharge of 34,000 tons into the ocean. As of August 23, 2021, 193 nations had generated 8.4 (+/- 1.4) million tons of pandemic-related plastic garbage, with 25.9 (+/- 3.8) thousand tons released into the global ocean, accounting for 1.5% (+/-0.2%) of global total riverine plastic discharge. MMPW generation and discharge are expected to be more skewed toward Asia as a result of India's record-breaking confirmed cases (WHO Coronavirus (COVID-19) Dashboard). Plastic discharged to the ocean as a result of the pandemic accounts for 1.5% (+/- 0.2%) of total riverine plastic discharges. A considerable amount of the outflow is medical waste, which increases the risk to the environment and human health or even the COVID-19 virus is spreading. This demonstrates how waste management necessitates structural modifications (Figure 1).
Effect of Temporal reduction of global fossil CO2 emissions in 2020
The six economic sectors covered in following analysis are (1) industry (22.4%), (2) residential (5.6%), (3) power (44.3% of global fossil CO2 emissions), (4) public buildings and commerce (here shortened to ‘public’, 4.2%), (5) surface transport (20.6%) and (6) aviation (2.8%). Changes in inactivity, such as power demand or road and air traffic, are represented by the statistics rather than direct changes in CO2 emissions. Many assumptions were made to cover the six sectors based on the available data and the nature of the confinement (Table 1). All of the activity variations are in comparison to normal levels prior to the COVID-19 pandemic. At the national, state, and provincial levels, the aviation sector experienced the biggest decreases in daily activities, with a reduction of –75% (–60 to –90%) during confinement level 3 (Table 1). Surface transport activity decreased by –50% (–40 to –65%), while industrial and government activity decreased by –35% (–25 to –45%) and –33% (–15 to –50%), respectively. Furthermore, power activity declined by a small –15% (–5 to –25%) at confinement level 3, although residential activity grew by +5% (0 to +10%). Activity data demonstrates that during confinement level 2, there are large reductions in activity, but only moderate reductions in activity during confinement level 1 (Table 1).
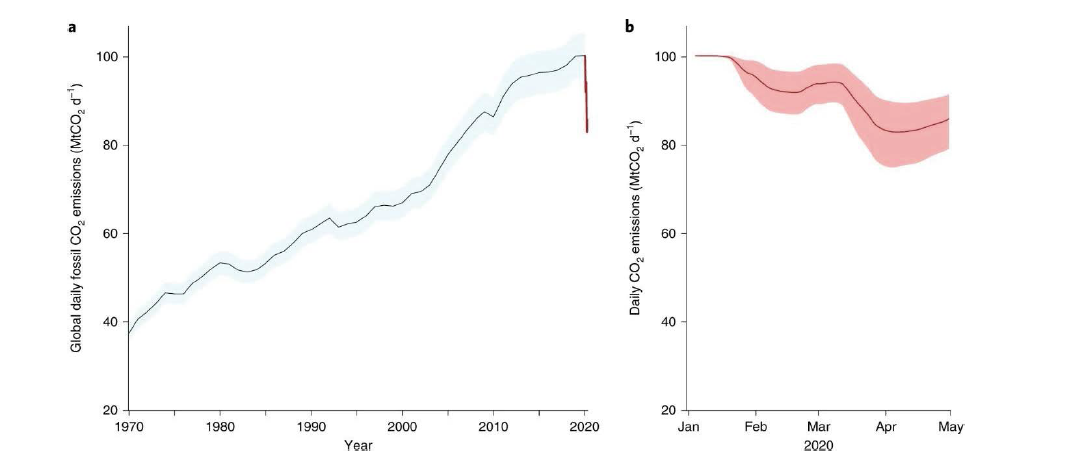
By 7 April 2020, the confinement had reduced daily worldwide CO2 emissions by –17 (–11 to –25) MtCO2 d-1, or –17% (–11 to –25%), compared to the mean level of emissions in 2019 (Table 1). From 1st January to 30th April 2020, the change in emissions on 7 April was the biggest estimated daily change. In early April, daily emissions are comparable to those of 2006 (Figure 2). Because we currently emit roughly 100 MtCO2 d-1, the values in MtCO2 d-1 are close to the amount in%. The maximum daily reduction averaged 26% (7% for 1) for specific countries. Because the highest daily decline did not occur on the same day in every country, the country decreases are larger than the worldwide maximum daily decrease. The estimated changes are compared to underlying trends previous to the COVID-19 pandemic and only take into consideration the effect of incarceration. The estimated changes are compared to underlying trends previous to the COVID-19 pandemic and only take into consideration the effect of incarceration. During the epidemic, the daily decline in global CO2 emissions is equivalent to the seasonal amplitude in emissions derived from data published elsewhere -21 (–17 MtCO2 d-1; M.J.W., manuscript in progress), owing to the Northern Hemisphere's higher energy use in winter compared to summer –43% (Figure 3) (Table 1). In the electricity sector, emissions decreased by –7.4%, or –3.3 (–1.0 to –6.8) MtCO2 d-1, while in the industry sector, emissions decreased by –19%, or –4.3 (–2.3 to –6.0) MtCO2 d-1. In absolute terms, emissions from surface transportation, power, and industry were the most impacted, accounting for 86% of the total reduction in global emissions. CO2 emissions fell by –60% in the aviation industry, or –1.7 (–1.3 to –2.2) MtCO2 d-1, and by –21% in the public sector, or –0.9 (–0.3 to –1.4) MtCO2 d-1. Although the aviation industry provided only 10% of the global CO2 reduction, the substantial relative anomalies in the sector correspond to the disproportionate effect of confinement on air travel Table 1.
| Change in activity as a function of confinement level (equation (1)) | Results | |||
|---|---|---|---|---|
| Level 1 | Level 2 | Level 3 | Daily change 7 April 2020 | |
| Power | 0 (0 to 0) | –5 (0 to –15) | –15 (–5 to –25) | –7.4 (–2.2 to –14) |
| Industry | –10 (0 to –20) | –15 (0 to –35) | –35 (–25 to –45) | –19 (–10 to –29) |
| Surface transport | –10 (0 to –20) | –40 (–35 to –45) | –50 (–40 to –65) | –36 (–28 to –46) |
| Public | –5 (0 to –10) | –22.5 (–5 to –40) | –32.5 (–15 to –50) | –21 (–8.1 to –33) |
| Residential | 0 (0 to 0) | 0 (–5 to +5) | +5 (0 to +10) | +2.8 (–1.0 to +6.7) |
| Aviation | –20 (0 to –50) | –75 (–55 to –95) | –75 (–60 to –90) | –60 (–44 to –76) |
| Total | –17 (–11 to –25) | |||
| The mean and range are exhibited. Parameters used in equation (1) for each sector (ΔAs). Changes in emissions by sector for the entire world on the day with the greatest change (7 April 2020). The change is calculated as a %age of the average level of emissions in 2019. (Methods) | ||||
Table 1: Change in activity as a function of the confinement level (%).
Figure 2: Global daily fossil CO2 emissions (MtCO2 d-1). Annual mean daily emissions during 1970-2019 (black line), updated from the Global Carbon Project1,3 (Methods), with the uncertainty of ±5% (±1σ; grey shading). The red line depicts the projected daily emissions from now until the end of April 2020. b, Daily CO2 emissions in 2020 (red line, same as in a) based on the CI and accompanying change in activity for each CI level (Fig. 2) as well as the uncertainty (red shading; Table 2). To account for the shift between confinement levels, daily emissions in 2020 are smoothed with a 7-d box filter.
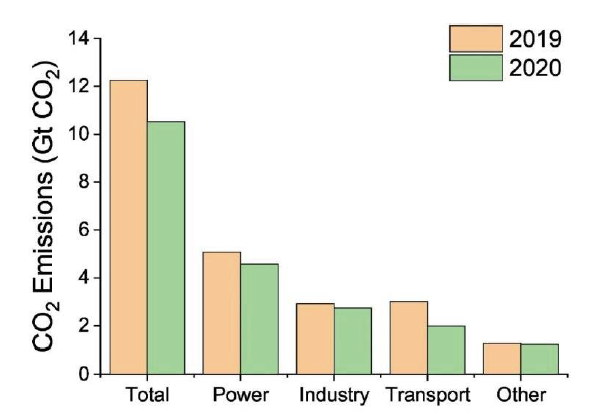
Figure 3: Change in global daily fossil CO2 emissions by sector (MtCO2 d-1). The ranges of uncertainty encompass the entire range of our estimates. Changes in yearly mean daily emissions from certain sectors in 2019 are shown (Methods). To account for the transition between confinement levels, daily emissions are smoothed with a 7-d box filter. The y-axes in the upper and lower panels have distinct ranges.
Emissions will almost probably rebound once the economy recovers, as prior crises have demonstrated. The changes in the environment (e.g. fewer carbon emissions) are only temporary because they are the product of imposed lockdowns rather than fundamental changes in the economic, energy, or transportation systems. There are, nevertheless, some lessons to be learned from this horrible time. Significant and long-term emissions reductions are required to reach the IPCC's Paris Agreement target. The COVID-19 outbreak may present an opportunity to resurrect the economy through low-carbon and environmentally beneficial approaches. The economy's rebuilding path should be smart, with a bigger emphasis on renewables, to achieve greater energy security. Governments all throughout the world must avoid overreacting and cutting corners.
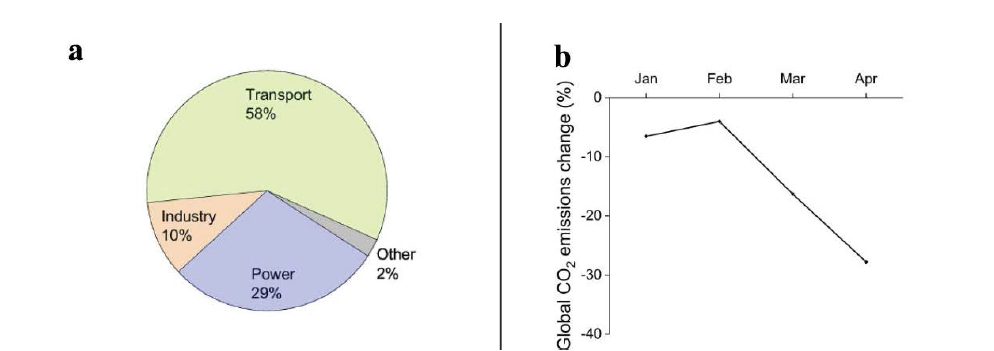
Figures 4 and 5 show that the transportation sector contributed the most to the reduction in CO2 emissions (1020 Mt CO2) when compared to the other sectors. Many passenger flights were grounded as the confinement was enforced, and people were advised or even ordered to stay at home, depending on domestic countermeasures. As a result, a significant decrease in emissions can be expected in this sector (58% of overall reduction by sector for January to April 2020). Carbon dioxide emissions from coal power generation reduced by 508 Mt CO2 from January to April 2020, compared to the same period in 2019. Lower electricity consumption, as stated in earlier sections, resulted in a 10% reduction in coal power generation, accounting for 29% of the total emissions reduction. In addition, industrial businesses were either closed or had their output decreased. This resulted in a CO2 reduction of 179 Mt from industry, accounting for 10% of total emissions decrease. Overall, a total reduction of 1749 Mt CO2, or 14.3%, was calculated, with the COVID-19-induced lockout from January to April 2020 accounting for the majority of the decrease. The number for worldwide emissions reduction was extrapolated from the four major emitters (which account for about a quarter of global emissions). As a result, a small overestimation is feasible. The aforementioned extrapolation imparts a realistic model because practically all large CO2 emissions contributors (90–95%) were economically able to apply lockdown measures. A scenario in which 10% of CO2 emitters did or did not properly enforce lockout measures was also investigated. This would result in a total CO2 decrease of 1575 Mt (12.8%). Surface traffic began to decline in February (third week) and peaked at 63.2% by the end of April, a loss of 25.2% on average. In addition as shown in Figure 5b, CO2 emissions from the sector decreased by 5.5% in February.
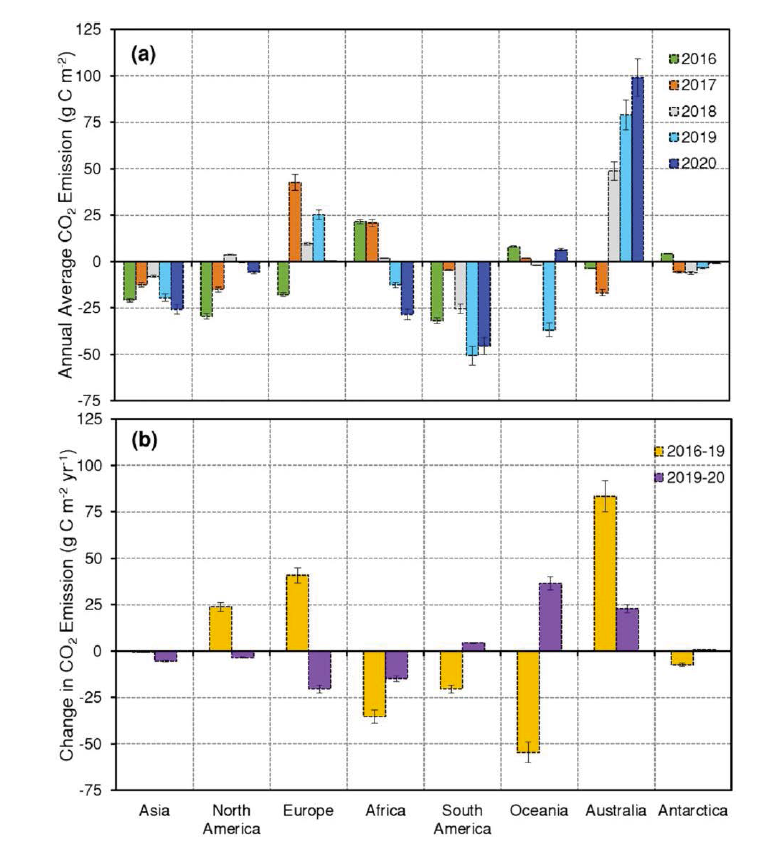
Changes/differences in the spatial distribution of annual CO2 emissions were compared between 2019 and 2020 and 2016 and 2019, as indicated in Figures 6 (a) (b). To understand the spatial distribution ranges of CO2 emissions globally, the discrepancies were categorized into nine classes. Carbon emissions in the northern hemisphere (North America, Europe, and Asia) were greater in 2019 than in 2016 (1–100 g C m-2 yr-1). Most of the southern hemisphere (South American and African continents, save Australia) had higher carbon uptakes (from 0 to 299 g C m-2 yr-1). However, carbon emissions on the Australian continent were higher in 2019 than in 2016, ranging from 1 to 300 g C m-2 yr-1. In contrast, most of the northern hemisphere (continents of North America, Europe, and Asia) had higher carbon uptakes in 2020 than in 2019 (0 to 9 g C m-2 yr-1), although carbon emissions in the north-western region of South America and Africa were higher (1–300 g C m-2 yr-1). In addition, in 2020, the majority of Australia's continent had significantly lower carbon emissions (1 to 100 g C m-2 yr-1) than in 2019.
Overall, in 2020, there was a regional drop in carbon emissions and an increase in carbon uptakes compared to previous years, which could be attributable to reduced traffic and industrial activities or the worldwide influence of lockdown measures. Annual carbon emissions and uptakes fluctuated across different continents before and throughout the COVID-19 pandemic, as illustrated in Figure 7a. While Asia and South America absorbed carbon from 2016 to 2020, North America absorbed carbon from 2016 to 2017 and 2019 to 2020, but emitted carbon in 2018. Europe, on the other hand, had carbon emissions every year except 2016, when it had carbon uptakes. Interestingly, except in 2016 and 2017, Australia, which has a lower COVID-19 impact, had carbon emissions every year. Figure 7b shows the difference in annual carbon emissions in each continent from 2016 to 2019 and from 2019 to 2020. In comparison to 2019, yearly carbon emissions in Asia, North America, and Europe decreased in 2020, while all other continents increased. Carbon emissions in Asia, North America, and Europe decreased significantly in 2020 compared to 2019. In contrast, whereas carbon emissions in Oceania and Australia increased significantly, carbon emissions in Africa, South America, and Antarctica increased marginally. In terms of the difference in yearly carbon emissions between 2016 and 2019, North America, Europe, and Australia saw a major increase in annual carbon emissions, whereas Africa, South America, Oceania, and Antarctica saw a significant decrease. However, in Asia, carbon emissions decreased somewhat in 2019 as compared to 2016. Between 2016 and 2019, the continents of North America, Europe, and Australia, which constitute the majority of developed countries, had an increase in annual carbon emissions. Annual carbon emissions, on the other hand, have been falling in South Africa, Asia, and South America, which include developing and leastdeveloped countries, as well as Antarctica and Oceania.
Figure 7: (a) Annual average CO2 emissions, and (b) Change in annual CO2 emissions between 2016 and 2019, and 2019 and 2020 at the continental level. The differences in annual carbon emissions were calculated by subtracting the annual emissions of 2019 from 2020. The straight line in each bar indicates a standard error (SE).
Double Plastic Waste Disposal
The majority of the million tons of plastic produced each year is wasted after one usage. Plastic bottles, bags, food containers, gloves, and cups that wind up in landfills and the environment have the potential to last hundreds of years or longer. Furthermore, because personal protective equipment (PPE, such as gloves and masks) is now required to prevent the virus from spreading, the COVID-19 pandemic, which is caused by a novel coronavirus (SARS-CoV-2), will aggravate global plastic pollution. The COVID-19 pandemic has raised demand for single-use plastics, putting to the pressure on a worldwide plastic waste crisis that is already out of control. Pandemic epicenters, in particular, struggle with waste management (UNEP, 2020), and not all obsolete personal protective equipment (PPE) and packaging materials are handled or recycled (Plastic waste is booming from the coronavirus pandemic - CNN, no date), (Growing plastic pollution in wake of COVID-19: How trade policy can help | UNCTAD, no date). Mismanaged plastic waste (MMPW) is then released into the environment, with some of it eventually ending up in the ocean. Plastics that have been released into the sea can travel great distances, clash with marine life, and cause injury or death. According to conservative predictions, the number of confirmed cases would reach 280 million by the end of 2021 (IHME: COVID-19 Projections, no date). The pandemic will generate 11 million tons of MMPW, culminating in a global riverine discharge of 34,000 tons into the ocean. As of August 23, 2021, 193 countries had produced 8.4 (+/-1.4) million tons of pandemic-related plastic waste, with 25.9 (+/- 3.8) thousand tons released into the global ocean, amounting for 1.5% (+/-0.2%) of global total riverine plastic discharge. MMPW generation and discharge are expected to be more skewed toward Asia as a result of India's record-breaking confirmed cases (WHO Coronavirus (COVID-19) Dashboard). The pandemic's plastic outflow to the ocean contributes for 1.5% (+/- 0.2%) of overall riverine plastic discharges. Medical waste accounts for a significant portion of the outflow, posing a concern to the environment and human health (Hirsch, 1988), and the COVID-19 virus is spreading. This is an illustration of the need for structural improvements in waste management.
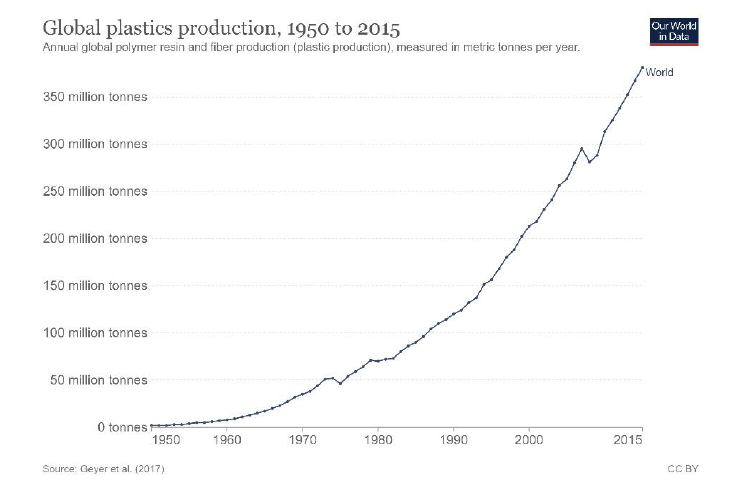
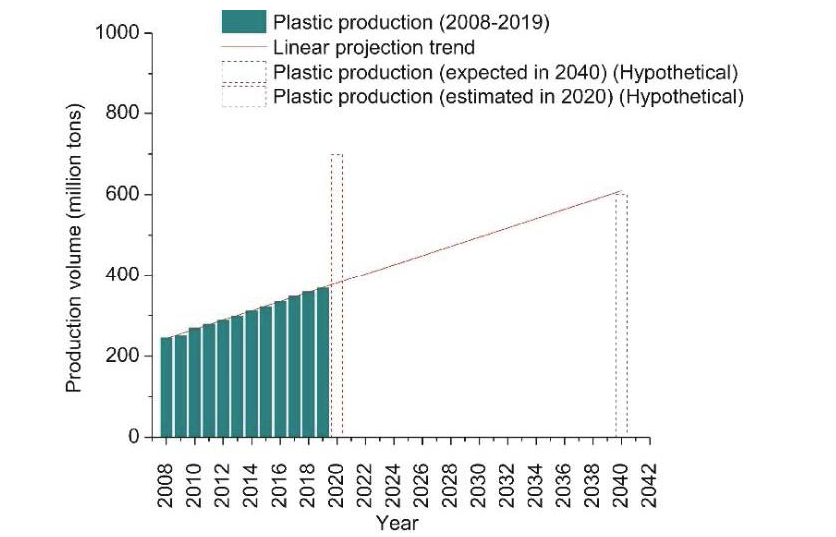
Understanding the many aspects of the plastic production, distribution, and waste management chains is necessary to comprehend the volume of plastics input to the natural environment and the world's oceans. This is critical not just for determining the scope of the problem, but also for adopting the most effective reduction strategies. From 1950 to 2015, the graph depicts the increase in worldwide plastic output, estimated in tons per year (Figure 8). In 1950, the world's annual production was only 2 million tons. Annual production has nearly doubled since then, hitting 381 million tons in 2015. To put this in perspective, this is about equal to two-thirds of the world's population. However, COVID-19 pandemic, caused by a novel severe acute respiratory syndrome coronavirus (SARS-CoV-2), has resurrected the single use plastics. Hypothetical past, present, and future worldwide plastic production. Plastic production is predicted to increase to 600 million tons in 2040 based on the data available of plastic production rate between 2008 and 2019 and assuming a linear trend. However, based on research data, it has been estimated that COVID-19 caused a drastic increase in plastic production to around 698 million tons in only 2020 (Figure 9).
Figure 9: Hypothetical past, present, and future worldwide plastic production. Plastic production is predicted to increase to 600 million tons in 2040 based on the data available of plastic production rate between 2008 and 2019 (Tiseo, 2021) and assuming a linear trend. However, based on (Shams, Alam, and Mahbub's, 2021)’s research data, it has been estimated that COVID-19 caused a drastic increase in plastic production to around 698 million tons in only 2020.
Figure 10 depicts time-series increases in FW, PW, and municipal solid waste (MSW) generation in Bangkok between 2003 and 2020, based on data collected in the study and officially published statistics by the BMA's Department of Environment. MSW is solid trash collected and handled by BMA from municipal activities (such as households, supermarkets, retail shops, enterprises, service providers, marketplaces, and institutions). After the COVID-19 pandemic, the amount of MSW generated reduced by roughly 1000 tons per day in early 2020, owing to the closure of hotels and restaurants, after a steady growth in the decade leading up to the pandemic. Food waste accounts for 50–60% of total MSW, whereas plastic waste accounts for 20–30%, although COVID-19 has resulted in a decrease in food waste and an increase in plastic trash at the city level. Similarly, other worldwide plastic waste sources are increasing year by year, although at a faster rate, as the Covid-19 impact shows in 2020.
Figure 10: Food waste, plastic waste, and municipal solid waste generated in the Bangkok metropolitan area. Note: The average of PW and MSW generation in 2020, as provided to BBC Thai by the BMA's Department of Environment, is between January and April 2020. In 2019 and 2020, no statistics on food waste creation is available.
Food waste (FW) includes unavoidable items like peels, stems, and bones, as well as leftovers and other avoidable items, but it excludes commercial excess food as well as reused and recycled food such as animal feed, which developed dramatically in the late 2010s as a result of increased tourism and lifestyle changes. The total weight of MSW has decreased dramatically since the COVID-19 epidemic and subsequent lockdowns, owing to a large reduction in food waste from hotels and restaurants. Before the COVID-19 epidemic, however, the amount of plastic garbage generated grew and dropped in a gradual curve, averaging 2115 tons per day in 2019, and then increasing dramatically by 62% in 2020, reaching an average of 3432 tons per day between January and June (Figure 10).
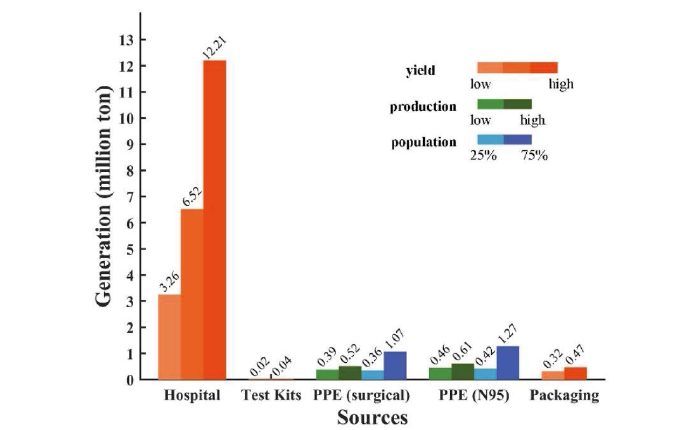
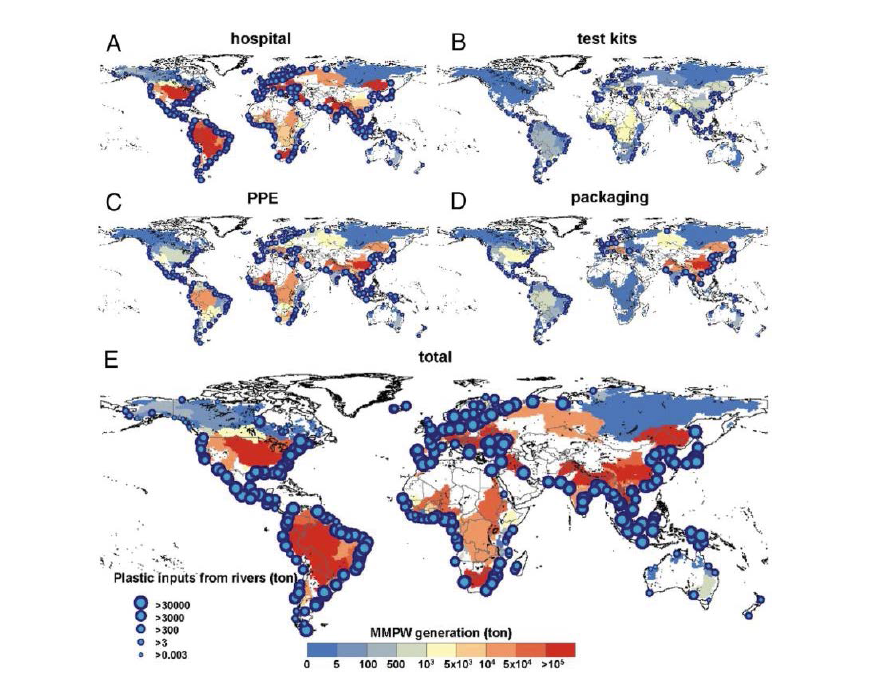
The plastic waste (PW) may also aid in the invasion of species and the transmission of pollutants such as the COVID-19 virus. Despite the potential consequences, nothing is known about the entire volume of pandemic-related plastic garbage and its environmental and health consequences. The total excess mismanaged plastic waste (MMPW) generated during the epidemic is estimated to be 4.4 to 15.1 million tons as to August 23, 2021 (Figure 11).
The majority of this excess waste (87.4%) comes from hospitals, as determined by the number of COVID-19 inpatients (Coronavirus (COVID-19) Dashboard, 2021) and per-patient medical waste generation for each country. Individuals' use of personal protective equipment accounts for only 7.6% of overall excess waste. Surprisingly, we discover that the rise in online purchasing leads to an increase in packaging material consumption. Packaging and test kits, on the other hand, are negligible sources of plastic waste, accounting for only 4.7% and 0.3%, respectively.
Cases of COVID-19 have been found all over the world (Asia, Europe, North America, South America, Oceania, and Africa). North and South America, as well as Asia, account for over 70% of COVID-19 cases. MMPW production does not match the case distribution, with the majority of MMPW produced in Asia (46%) followed by Europe (24%) and finally north and South America (22%) (Figure12E). This reflects the lower level of medical waste treatment in many developing nations, such as India, Brazil, and China (low- and high-end estimates range from 11.5 to 76%) compared to industrialized countries with significant numbers of cases, such as North America and Europe (e.g., the United States and Spain) (0 to 5% of total) (Figure 12A,B). Because of the huge mask-wearing populace, the MMPW generated from individual PPE is considerably more skewed toward Asia (Figure 12C). Similarly, online-shopping packaging generates the highest MMPW in Asia (Figure 12D). China (58%), the United States (14.9%), and Japan (10.3%) are the top three countries in the express delivery business by global share, followed by the United Kingdom (4%) and Germany (4%).
Figure 12: Riverine discharge of pandemic-related unmanaged plastics into the worldwide ocean has accumulated. The discharges caused by (A) hospital medical waste, (B) COVID-19 viral test kits, (C) personal protective equipment, (D) online-shopping packaging material, and (E) the total of them are represented by panels. The background color reflects the MMPW created in each watershed, whereas the sizes of the blue circles represent river mouth discharges.
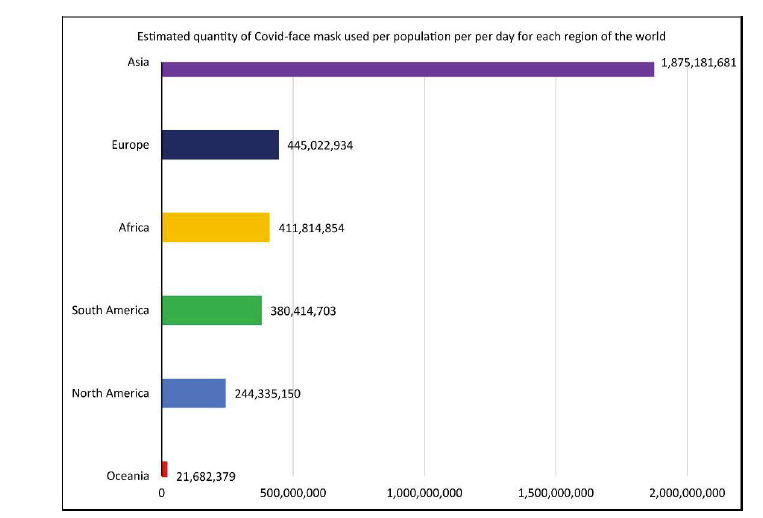
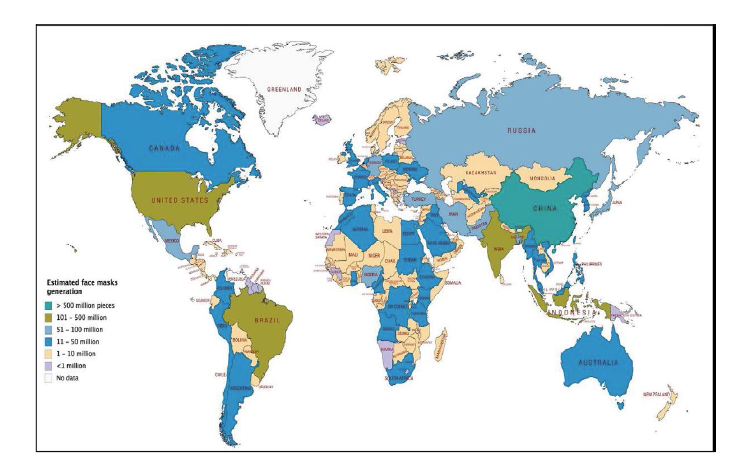
Plastic garbage has been generated at a pace of 1.6 million tons per day since the pandemic began. According to, roughly 3.4 billion single-use facemasks or face shields are discarded daily due to the COVID-19 pandemic. China, which has the world's largest population, is expected to produce almost 702 million wasted facemasks per day and 108 million tons of plastic garbage by the end of 2020. According to our calculations, Asia will generate the most wasted facemasks per inhabitant every day (1.8 billion). Europe has 445 million people, Africa has 411 million people, Latin America and the Caribbean has 380 million people, North America has 244 million people, and Oceania has 22 million people (Figures 13 and 14). The mandated use of single-use facemasks (face shields) could significantly increase PPE waste creation due to existing policies and COVID-19 guidelines in several countries. For example, the daily facemasks generated in China (1.4 billion people), India (1.3 billion people), the United States (331 million people), Brazil (212 million people), Nigeria (206 million people), and the United Kingdom (67 million people) are estimated to be at least 702, 386, 219, 140, 75, and 45 million contaminated masks per day, respectively. If the masks are abandoned into the environment and not properly managed, they may disintegrate into smaller particles, aggravating the already existing problem.
The significant growth in PPE waste has overburdened waste management programs around the world, as spent plastic PPE must be properly disposed of to avoid cross-contamination. Indeed, recycling centers are restricting possibly tainted plastics, implying that incineration and landfilling are being favored. Such disposal methods are clearly incompatible with the goals of the plastic circular economy and sustainable development, and incineration can also cause major air quality problems by emitting volatile pollutants (such as dioxins and furans) and greenhouse gases over time.
As a result, governments must coordinate the collection, segregation, and disposal of plastic garbage generated during the COVID-19 pandemic. Potentially contaminated waste should be collected in specially labeled reusable containers for simple separation and treatment, and waste treatment facilities should have real-time information on incoming PPE waste volume, types, and hotspots of creation. In the near future, an integrated mechanical and chemical recycling process will be required for the disposal of plastic PPE. Hydrocracking, for example, has the potential to be a sustainable process because to its low carbon emissions and energy consumption, as well as the ease with which related pollutants may be controlled. More effective use of current waste management technologies should be linked with government incentives to attain the goal of zero plastic pollution. Instead of being mishandled, end-of-life plastic PPE should be intended to be totally degraded or correctly repurposed for value-added uses.
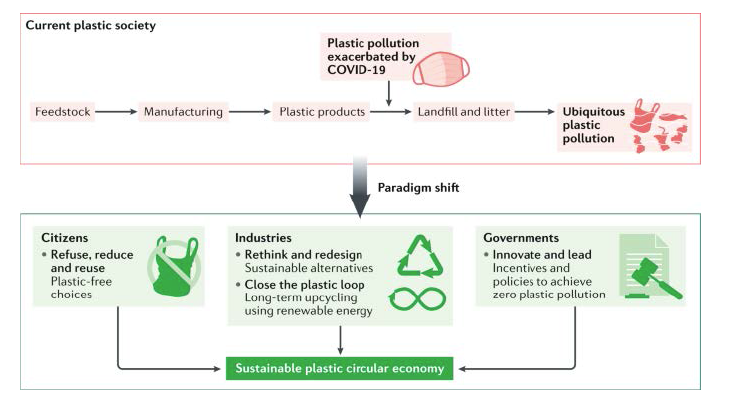
During the COVID-19 pandemic, a balance must be achieved between safeguarding public health and minimizing environmental harm. Even if capacity is increased, present plastic waste management schemes will not be able to keep up with the expected increases in plastic trash creation in the long run. COVID-19 has exacerbated the problem, but it is not the underlying cause – single-use plastics were already widespread and poorly disposed of before the pandemic. There is an acute need to change to a circular economy for plastics, both during the pandemic and, more significantly, thereafter. Consumers, researchers, governments, and industries must all work together to achieve this aim (Figure 15). Plastics that are inappropriately disposed of in the oceans and on land endanger marine life and, as a result, human lives. Plastic waste is already causing environmental damage in both the marine and terrestrial habitats, but it will eventually degrade into micro and Nanoscale plastics. We also looked at how increasing plastic pollution will worsen the micro- and Nanoscale plastic problem, which has recently become a serious concern. This review will help people understand how plastic is used and how it affects the environment in the event of a pandemic like COVID-19.
Conclusion
This reviewed has evaluated and analyzed past studies on how the COVID-19 pandemic has influenced or is anticipated to influence global climate action. Several big cities and countries with extensive carbon emissions-related operations and long-term lockdown measures dramatically reduced carbon emissions in 2020, according to this analysis. In comparison to 2019, some big cities and countries that were either little impacted by COVID-19 or did not take severe lockdown measures had a minor or no impact on carbon emissions in 2020. Furthermore, because most of the changes observed in 2020 do not reflect structural changes in the economic, transportation, or energy sectors, they are likely to be transient. The social trauma of confinement and the changes that accompany it could modify the future trajectory in unanticipated ways, but social responses alone, as shown here, would not be sufficient to achieve the deep and long-term reductions required to achieve net-zero emissions. Low-energy and/ or low-material demand scenarios investigated for climate stabilization specifically attempt to match reduced demand with increased wellbeing, an objective that is not satisfied via mandatory confinement. Still, by applying economic stimulus that is linked with low-carbon paths, there are potential to set structural changes in motion. The extent to which world leaders consider net-zero emissions targets and climate change imperatives while developing their COVID-19 economic policies is predicted to have a long-term impact on CO2 emissions.
People should be mindful of the long-term repercussions of their plastic usage and disposal, since the COVID-19 epidemic has compounded the problem of plastic pollution. According to our summary data and hypothetical estimates, the COVID-19 epidemic has resulted in a massive amount of plastic being produced over the world. During the pandemic, poor plastic waste management and unlawful dumping will have both short and long-term repercussions on biological, ecological, and human health. Plastic trash is currently damaging the marine and terrestrial environments, but it will also disintegrate in the future into minuscule micro and Nanoscale plastics. These micro and Nanoscale plastics have the potential to harm humans and the environment even more irreversibly. Public understanding of the environmental impact of PPE and other plastic items must be raised around the world. Better plastic trash collection, categorization, treatment, and recycling, as well as the development of more environmentally friendly materials, require the promotion of innovative technology. Because current technologies are overwhelmed, new plastic waste management strategies are required to deal with this plastic overflow. As a result, it is critical to establish plastic usage laws and to educate people on how to minimize, reuse, recycle, and manage plastic trash. Contingency preparations for future plastic pollution and plastic waste management in critical scenarios should be the focus of future effort.
During the first wave of the pandemic, the respondents' opinions were reflected in the article. It should be interesting to repeat the study after a year. The authors anticipate that the data and patterns presented in the research will aid attempts to better understand the COVID-19 pandemic's relationship to climate change. The development of COVID-19 vaccinations will help to limit the disease's spread. However, climate change will continue to be an issue long after COVID-19 has been eliminated. If the present lessons from both global crises are learned and the appropriate policies and measures are implemented, the world may be better prepared to deal with global climate change, which has local consequences.
References
- Morgan MR (2006) Climate change 2001. Q J R Meteorol Soc.
- IPCC (2014) Climate Change 2014: Impacts, Adaptation, and Vulnerability. Part A: Global and Sectoral Aspects. Contribution of Working Group II to the Fifth Assessment Report of the Intergovernmental Panel on Climate Change.
- Gautam S (2020) The Influence of COVID-19 on Air Quality in India: A Boon or Inutile. Bull Environ Contam Toxicol 104(6):724-726.
- Xin H, Aijun D, Jian G (2020) Enhanced secondary pollution offset reduction of primary emissions during COVID-19 lockdown in China. Natl Sci Rev 18;8(2):nwaa1-37.
- WHO Coronavirus (COVID-19) Dashboard With Vaccination Data.(Accessed: 2 March 2022).
- Naderipour A, Abdul-Malek Z, Azlinda Ahmad N (2020) Effect of COVID-19 virus on reducing GHG emission and increasing energy generated by renewable energy sources: A brief study in Malaysian context. Environ Technol Innov 20:101-151.
- Andrés R, Claudio B, Giulia B (2020) Climate Change and Land Ice. IPCC.
- Le Quéré C, JacKson R (2020) Temporary reduction in daily global CO2 emissions during the COVID-19 forced confinement. Nat Clim Change 10(7): 647-653.
- Vineet SS, Annika R, Michal J (2021) COVID-19 pandemic and global carbon dioxide emissions: A first assessment. Sci Total Environ 10(794):148-770.
- Antoine SE (2018) An IPCC special report on the impacts of global warming of 1.5 °C above pre-industrial levels and related global greenhouse gas emission pathways, in the context of strengthening the global response to the threat of climate change, sustainable development, and efforts to eradicate poverty. 2(10):17-20.
- UNEP (2019) Emissions Gap Report 2019. Executive summary. United Nations Environment Programme. Nairobi 31.
- Yiming P, Peipei W, Amina TS (2021) Plastic waste release caused by COVID-19 and its fate in the global ocean. Proc Natl Acad Sci U S A 118(47):e215-308.
Indexed at, Google Scholar, Crossref
Indexed at, Google Scholar, Crossref
Indexed at, Google Scholar, Crossref
Indexed at, Google Scholar, Crossref
Indexed at, Google Scholar, Crossref
Indexed at, Google Scholar, Crossref
Indexed at, Google Scholar, Crossref
Citation: Oo KT, Thin MMZ (2022) Climate Change Perspective: Key factors learn from the COVID-19 Pandemic. J Earth Sci Clim Change, 13: 617. DOI: 10.4172/2157-7617.1000617
Copyright: © 2022 Oo KT, et al. This is an open-access article distributed under the terms of the Creative Commons Attribution License, which permits unrestricted use, distribution, and reproduction in any medium, provided the original author and source are credited.
Share This Article
Recommended Journals
Open Access Journals
Article Tools
Article Usage
- Total views: 2494
- [From(publication date): 0-2022 - Apr 04, 2025]
- Breakdown by view type
- HTML page views: 1999
- PDF downloads: 495

