Climate Change Impact on Probability Analysis of Hurricanes
Received: 03-Jan-2016 / Accepted Date: 20-Jan-2016 / Published Date: 26-Jan-2016 DOI: 10.4172/2157-7617.1000317
Abstract
Coastal flood risk due to cyclonic storms is a significant topic of concern for coastal communities. Planning and engineering efforts within these communities often require estimates of water surface elevations associated with specific return periods. In order to generate the surge elevations for prospective return periods, Joint Probability Method (JPM) techniques are often used [1,2]. Within a JPM approach, statistical representations of cyclonic storm characteristics (i.e., storm frequency, intensity, and radius to maximum wind) are parameterized, along with an associated probability distribution for each parameter. The probability distributions for each of the major hurricane characteristics are based on local historical climatology. A key assumption in the development of the probability distribution for the storm parameters is that each is statistically stationary. Global climate models suggest that characteristics of cyclonic storms may be impacted by climate change. Such changes would challenge the assumption of statistical stationary within the traditional JPM approach. Here, a straightforward windowing approach is proposed to account for possible variation of characteristics. This approach results in more recent storm events having a larger impact on the probability distribution of storm parameters, should such an adjustment be judged necessary by the JPM practitioner. The application of the proposed approach is demonstrated by applying on sample data sets of hurricanes at the mid-Atlantic region and South Florida.
Keywords: Climate change; Hurricane; Probability analysis; Cyclonic storms; Temporal kernel function
9202Introduction
The prediction of the future hurricanes and how hurricane characteristics may evolve under climate change scenarios are complicated. Extensive studied conducted on hurricanes with and without the impact from climate change indicate that hurricane characteristics have evolved over time. Climate change is anticipated to not only accelerate sea level rise but also to result in an intensification of hurricanes [1-4] compared the pre-anthropogenic era and anthropogenic era storm surge model results for a large sample of synthetic cyclonic storms at the North Atlantic basin from A.D. 850 to A.D. 2005. The study results for New York City indicate that mean flood height has increased from A.D. 850 to the anthropogenic era. Also, the intensity and radius to maximum wind of cyclonic storms increased at smaller return periods. Emanuel [5] defined an index indicating hurricane destructiveness over the lifetime of the cyclone and showed that this index significantly increased since mid-1970s. Based on his prediction, longer storm lifetimes and greater storm intensities are expected to happen in twenty first century. Numerous other studies also indicate that climate warming can result in more intense cyclonic storms in the future (e.g., Knutson and Tuleya, [6]; Shen, et al. [7]; hill and Lackmann [8]). Handerson-Sellers, et al. [9] indicate that current knowledge and available techniques are too rudimentary for quantitative indication of potential changes in cyclonic storms frequency. However, regional and local frequencies can change substantially because of the dependence of cyclone genesis and track on other phenomena that are not yet predictable. Trenberth [10] explained that all weather events are affected by climate change because the environment in which they occur is warmer and moister than it used to be. He also discussed that the warmer and moister environment can intensify the hurricanes. These studies indicate the significance of climate change consideration in the probabilistic modeling of hurricane characteristics. The modified characteristics of hurricanes may soon require revising traditional approaches in probability analyses of cyclonic storms.
A probabilistic understanding of present day and future flood risk due to coastal storms is an integral and a primary part of coastal hazard assessment, and required by a range of government and private stakeholders (e.g., Federal Emergency Management Agency and US Army Corps of Engineers) who manage programs and infrastructure along the Nation’s coastlines. Coastal adaptation strategies, design of coastal structures, and coastal protective approaches are based on annual exceedance chances of flood elevations [11,12]. The historical record of storm characteristics is used to perform the statistical analysis in order to obtain exceedance chance of flood elevations. The natural variability of hurricanes in the historical record is managed by parameterizing certain characteristics of hurricanes and then developing probability distributions for each of the major hurricane parameters (i.e. central pressure, heading angle, forward velocity, radius to maximum wind, and Holland B parameter) based on local historical climatology. The probability distributions of the major parameters are governed by bulk statistical values (e.g., mean, standard deviation) and, thus, rely on the assumption that these properties are stationary over time. Although the specific changes are as yet unclear, there does appear to be scientific consensus climate change will result in shifts in storm climatology as reviewed above. Such impacts may undermine the assumption of statistical stationarity within the analysis of each of the storm parameters.
In the current study, a kernel function is introduced which enables the JPM practitioner to apply a heavier weighting to ‘recent’ storms within the record. This function can be applied on storm characteristics such as frequency, intensity and radius to maximum wind to more accurately determine the corresponding probability distributions and to include the impact of possible future modern hurricanes in the storm climatology analysis. The proposed approach is then applied to a sample study areas in this region. Section 2 introduces the proposed statistical framework. Section 3 explains how this approach could be applied within a JPM analysis of hurricanes. Section 4 explains the study area and the historic data used to perform probability analysis. Results are discussed in Section 5. Discussion is presented in Section 6 and Section 7 concludes.
Approach in Probability Analysis
The proposed approach in analysis of hurricane characteristics is based on revising the weighting coefficient of the historic events in the statistical analysis of each individual storm parameter. The weighting coefficient of each event is 1/T in Traditional Approach where T is the time length of the database. In other words, all events are being treated equally over the time length of database. In the proposed approaches, greater emphasis is given to events which have occurred more recently using weighting kernel functions. The time window functions generate weighting coefficients for hurricane characteristics using three different approaches. The new approaches proposed in this study are referred to as “Modern Approaches” that are consisting of “Rectangular Approach”, “Triangular Approach”, and “Gaussian Approach”. Also, the temporal kernel function is represented by k(Ti) where Ti represents time of event i in the database.
Rectangular approach
In the first approach, based on the representative length of the storm catalog (hT), a rectangle is defined as illustrated in (Figure 1a). The temporal extension of the dataset is confined within hT years from the end year of the historic record. The height of the rectangle represents the value of temporal kernel function (k(Ti)) within temporal distance of hT from the end year of the dataset. The temporal kernel function is zero in the remaining years (e.g., in 1960 in Figure 1a). Thus all storms that happened within hT years from the end year of the dataset are considered while those falling outside of hT years are excluded. Compared to Traditional Approach, In Rectangular Approach the temporal kernel function increases within hTyears (e.g., 40 years) from the end year of the dataset to keep the area under the rectangle equal to unity. In fact, the k(Ti) values within hT years from the end year of the dataset are calculated by equating the area under the rectangle to unity. This yields the following equation to calculate the kernel function within hTyears from the end year of the dataset:
 (1)
(1)
Within ht years, k(Ti) is constant and all storms are treated equally in Rectangular Approach. For hT equal to the length of time of the historic dataset, the weighting coefficients of Rectangular Approach become equal to the Traditional Approach.
Triangular approach
In the second approach, the temporal kernel function, k(Ti), is evaluated by a linear function with the maximum value at the end year of the dataset and zero value at hT years behind the end year of the dataset. Figure 1b shows that for a given hT the temporal kernel values of the Triangular Approach intersects that of the Traditional Approach. The larger kernel values of Triangular Approach is observed after the year that two curves intersect. The value of k(Ti) at each year within hT years from the end year of the dataset is determined by equating the area of the triangle to unity. The kernel function in this approach is expressed by Equation 2, where, Tend is the end year of the database.
 (2)
(2)
Gaussian approach
In Gaussian Approach a one-sided Gaussian distribution is fitted to the occurrence time of the hurricanes in the recorded dataset.
 (3)
(3)
The kernel function in Equation 3 is multiplied by 2 to account for one sided Gaussian distribution and to keep the area under the fit equal to unity. Figure 1c shows the comparison of the Gaussian Approach and the Traditional Approach for a given hT value. Even though the trend of the Gaussian curve is decreasing from 2013 back to 1940, in spite of the Rectangular and Triangular Approaches, the older data are not being disregarded. For example, the temporal kernel function in 1940 is zero in the first two approaches and slightly less than 0.04 in the Gaussian approach in the analyses and figures shown in the explanation of the proposed approaches.
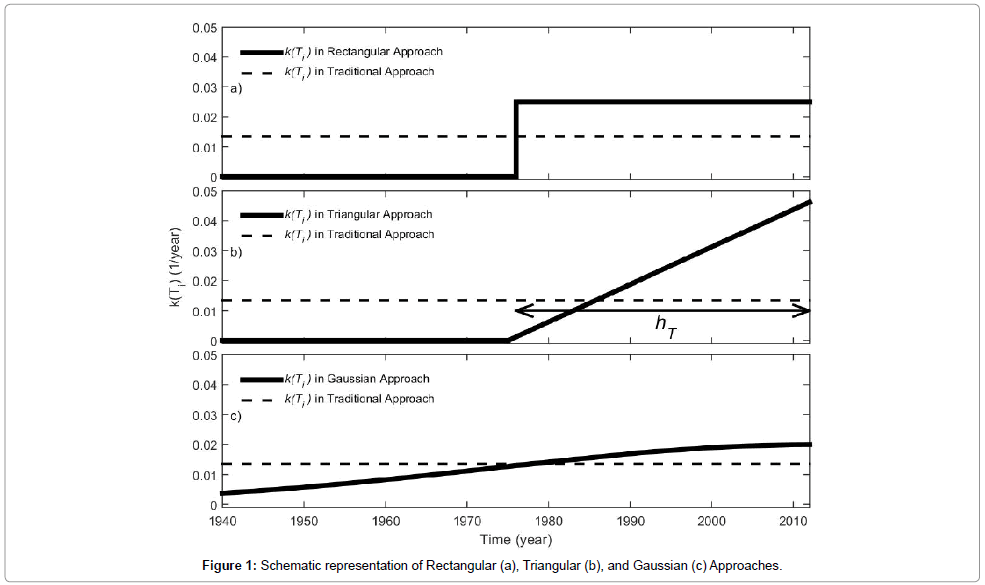
Figure 1: Schematic representation of Rectangular (a), Triangular (b), and Gaussian (c) Approaches.
Application Of Modern Approaches
The temporal kernel functions of the Modern Approaches are applied on frequency and intensity of hurricanes have impacted Virginia Beach (VA Beach) costal area. Also, the radius to maximum wind of hurricanes impacting South Florida coastal area is analyzed by the proposed approach.
Hurricane frequency
The occurrence of hurricanes relative to a coastal reference point (CRP) is described by the omnidirectional frequency, λ. This is typically considered using a Poisson line-process model [13]. Each storm is characterized by the minimum distance, d, from the CRPs. The CRPs are taken to be the central points of the study coastlines. The minimum distance, d, is defined as the minimum distance from the reference point to a line representing the storm heading at the point of closest approach.
In order to calculate the frequency (λ) at any given point, Chouinard and Liu (1997) employed a kernel function (spatial kernel function), k(di), which is dependent on an individual storm’s distance, d, from a CRP. The sum of this function over all storms divided by the length of time of the historical record yields the omni-directional storm frequency. Storms closer to the reference site have a higher kernel function and more importance in the computation of the frequency. Mathematical expression for the calculation is as follows:
 (4)
(4)
where, T is the duration of the storm database, di is the distance of hurricane i from CRP, and λ(di) is omni-directional storm frequency. The kernel function is taken as normal distributions:
 (5)
(5)
Where hd is the parameter that controls the degree of smoothness of d. This parameter is important, as a small smoothing parameter can introduce too much statistical uncertainty, and a large smoothing parameter can reduce the uncertainty, but may not capture any spatial variability by homogenizing datasets. The Traditional Approach of calculating weighting coefficient (1/T) weighs the spatial kernel function equally throughout the time length of the database.
The mathematical framework on how the Modern Approaches can be used to highlight the new generation of hurricanes is explained here for frequency domain. A modulation to the Traditional Approach of storm frequency calculation is proposed here to account for the new generation of hurricanes and the impact from climate change. Modern hurricanes are highlighted in the storm frequency calculation by fitting a one-sided distribution to the series of hurricane occurrences to appreciate the time of events. In frequency analysis, the division by the time length of the database is substituted by the temporal kernel functions discussed in Section 2. In the new configuration, the omnidirectional frequency is expressed as in Equation 6:
 (6)
(6)
Where, k(Ti) represents the temporal kernel function for each hurricane and is determined by applying one of the approaches discussed in Section 2.
Hurricane intensity
The central pressure deficit is correlated to the hurricane intensity and plays a significant role in driving coastal flooding. Proposed approaches in Section 2 can be applied on central pressure dataset to replicate the number of events as a function of occurrence time. The replication may project an increase in the number of recent events and a decrease in the number of the more distant past events. Then, the statistical parameters would show the impact of each kernel function on displacement of the central pressure distribution.
Radius to maximum wind
Radius to maximum wind (RMW) represents the distance from the center of hurricane eye to the maximum wind speed within the hurricane coherent structure. Hurricanes with larger RMW are generally stronger and impact a larger coastal area. If the RMW of future hurricanes are likely to change, an accurate probabilistic modeling of hurricanes should be considered in the JPM storm set. Similar to hurricane intensity, the Modern Approaches discussed in Section 2 are applied on historic data to project the statistics of future events.
Study Area And Historical Data
An investigation is performed to determine the effectiveness of the Modern Approaches (Rectangular, Triangular and Gaussian Approaches) to capture the impact of the climate change on the hurricane frequency and intensity in the mid-Atlantic region. The goal here is to only show the application of the proposed approaches on a sample dataset and confirm that they function as intended. For this purpose, Virginia Beach (VA Beach) was selected for storm frequency and storm intensity analyses. Situated in the mid-Atlantic coastal regions, VA Beach is subject to modern ocean forces (modern hurricanes and sea level rise) that increase the chance of flooding [14] and modulate the hydrodynamic, sediment transport and geomorphic development patterns in coastal areas [15-18]. Additionally, the statistical analysis on RMW is performed on hurricanes impacted South Florida coastal areas. The Category 1 or higher hurricanes on the Saffir-Simpson Scale occurred within 200 nautical miles from the midpoint of the coastline are considered in the analyses.
For VA Beach, The probabilistic modeling of hurricane characteristics is performed through an analysis of historical climatology records provided by HURDAT, the North Atlantic Hurricane Database [19]. HURDAT database provides the storm track information needed for extracting central pressure. Storm intensity is calculated based on storm track information. For South Florida, the data provided by FEMA (2015) is used to do analysis on RMW.
Table 1 lists the characteristics of fourteen hurricanes from HURDAT database used for VA Beach analyses and (Table 2) provides the characteristics of thirty three hurricanes impacted the west coast of South Florida. The data points of central pressure and radius to maximum wind of the hurricanes presented in Tables 1 and 2 are shown in (Figures 2 and 3), respectively. Based on the linear trend, the central pressure decreases with the slope of -0.26 milibar (mb)/ year. Also, the RMW increases with the slope of 0.52 km/year. Thus, in average sense and over time VA Beach has been experiencing more intense hurricanes and a significant event in west coast of South Florida has impacted larger coastal areas.
| Year | Month | Day | Hour | Name | Latitude (°) | Longitude (°) | Storm Heading (°) | Central Pressure (mb) |
|---|---|---|---|---|---|---|---|---|
| 1958 | 8 | 29 | 0 | Daisy | 36.2 | -74 | 25.65 | 963 |
| 1958 | 9 | 28 | 6 | Helene | 35.8 | -73.2 | 64.02 | 950 |
| 1961 | 9 | 20 | 18 | Esther | 36.3 | -73 | 10.53 | 955 |
| 1962 | 8 | 28 | 18 | Alma | 36.9 | -73.5 | 40.04 | 991 |
| 1963 | 10 | 28 | 18 | Ginny | 35.1 | -71.5 | 28.56 | 963 |
| 1968 | 10 | 20 | 12 | Gladys | 35.5 | -74.6 | 53.24 | 983 |
| 1969 | 9 | 9 | 12 | Gerda | 37.8 | -72.2 | 34.61 | 984 |
| 1976 | 8 | 9 | 18 | Belle | 36.6 | -74.2 | 10.34 | 970 |
| 1991 | 8 | 19 | 6 | Bob | 36.5 | -74.5 | 18.68 | 950 |
| 1993 | 9 | 1 | 6 | Emily | 36.6 | -74.4 | 21.85 | 962 |
| 1999 | 10 | 18 | 12 | Irene | 36.8 | -71.6 | 54.55 | 960 |
| 2004 | 8 | 4 | 0 | Alex | 36 | -73.7 | 59.7 | 974 |
| 2010 | 9 | 3 | 12 | Earl | 36.1 | -73.4 | 21.97 | 959 |
| 2012 | 10 | 29 | 18 | Sandy | 38.3 | -73.2 | 309.44 | 940 |
Table 1: Storm characteristics for the VA Beach bypassing storms with central pressures less than 990 mb in the time period of 1958-2013.
| Year | Month | Day | Hour | Name | Latitude (°) | Longitude (°) | Radius to Maximum Wind (km) |
|---|---|---|---|---|---|---|---|
| 1950 | 9 | 3 | 18 | Easy | 24.9 | -82.4 | 31.67 |
| 1950 | 10 | 21 | 0 | Love | 27.1 | -85.2 | 31.48 |
| 1953 | 6 | 5 | 0 | Alice | 25.9 | -84.8 | 31.48 |
| 1953 | 8 | 29 | 12 | Not Named | 26 | -82.6 | 16.67 |
| 1953 | 10 | 9 | 12 | Hazel | 26.2 | -83 | 33.34 |
| 1959 | 10 | 18 | 0 | Judith | 24.7 | -84 | 20.37 |
| 1960 | 9 | 10 | 12 | Donna | 25.3 | -81.3 | 37.54 |
| 1964 | 10 | 14 | 21 | Isbell | 25.71 | -81.34 | 11.11 |
| 1966 | 6 | 9 | 0 | Alma | 25.74 | -82.68 | 36.97 |
| 1968 | 6 | 4 | 6 | Abby | 25.8 | -82.9 | 57.41 |
| 1968 | 10 | 19 | 0 | Gladys | 28.3 | -83.1 | 27.78 |
| 1969 | 8 | 16 | 12 | Camille | 23.7 | -85.9 | 27.78 |
| 1972 | 6 | 19 | 12 | Agnes | 28.5 | -85.7 | 72.23 |
| 1979 | 9 | 11 | 12 | Frederic | 24.4 | -84.8 | 57.86 |
| 1982 | 6 | 3 | 18 | Alberto | 24 | -83.6 | 33.34 |
| 1985 | 8 | 29 | 18 | Elena | 25.9 | -85.8 | 40.74 |
| 1985 | 11 | 20 | 0 | Kate | 23.9 | -83.5 | 29.17 |
| 1990 | 10 | 11 | 6 | Marco | 26.7 | -82.6 | 35.19 |
| 1996 | 10 | 7 | 18 | Josephine | 28.2 | -86 | 70.38 |
| 1998 | 9 | 25 | 15 | Georges | 24.27 | -81.87 | 38.98 |
| 1998 | 11 | 5 | 11 | Mitch | 26.27 | -81.9 | 96.3 |
| 1999 | 10 | 15 | 19 | Irene | 25.32 | -81.14 | 59.26 |
| 2000 | 9 | 17 | 6 | Gordon | 26.11 | -84.95 | 25.93 |
| 2001 | 9 | 14 | 10 | Gabrielle | 26.57 | -82.8 | 29.63 |
| 2002 | 10 | 2 | 0 | Lili | 23 | -85.7 | 24.08 |
| 2004 | 8 | 13 | 18 | Charley | 26.1 | -82.4 | 10.93 |
| 2005 | 7 | 9 | 12 | Dennis | 24.3 | -83.4 | 22.46 |
| 2005 | 9 | 20 | 18 | Rita | 23.8 | -81.6 | 35.61 |
| 2005 | 10 | 24 | 10 | Wilma | 25.9 | -81.53 | 66.67 |
| 2008 | 8 | 31 | 12 | Gustav | 24.71 | -85.51 | 33.34 |
| 2008 | 9 | 10 | 18 | Ike | 24.2 | -85.8 | 96.3 |
| 2012 | 6 | 25 | 0 | Debby | 28.5 | -85.8 | 118.53 |
| 2012 | 8 | 27 | 12 | Isaac | 25.8 | -84.8 | 77.78 |
Table 2: Storm characteristics for the west coast of South Florida coastal areas with central pressures less than 990 mb in the time period of 1950-2013.
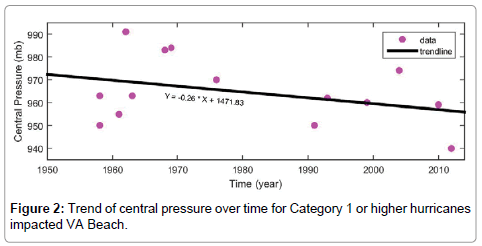
Figure 2: Trend of radius to maximum wind over time for Category 1 or higher hurricanes impacted west coast of South Florida.
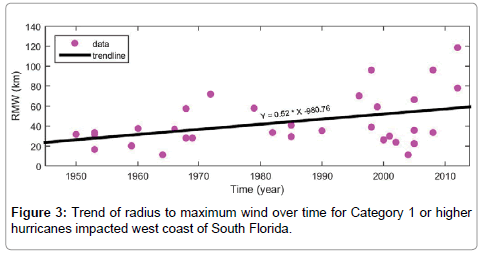
Figure 3: Trend of radius to maximum wind over time for Category 1 or higher hurricanes impacted west coast of South Florida.
Results
The storm frequency and storm intensity are analyzed for VA Beach. The RMW is statistically studied for west coast of South Florida. Note that the goal here is not to predict the future of storm frequency, intensity, or RMW. The above mentioned examples only explain the application of the proposed statistical approaches, should it be deemed useful by the JPM practitioner. Depending on the dataset and location of the study area, the proposed approaches can be considered and practiced by a climatologist in order to accurately perform the probabilistic modeling of hurricanes.
Utilizing Equations 1 and 2, the storm frequency is obtained as 2.7890E-4 storms/km/yr in Traditional Approach. The omnidirectional frequencies associated with proposed approaches and different hT values are shown in Table 3. As was expected, the calculated frequency using Rectangular Approach and hT=54 years yields the same frequency as Traditional Approach does. The rest of frequencies show smaller values with decreasing trend from higher hT values to smaller ones using Rectangular and Triangular Approaches. In contrast, the storm frequency increases from larger hT values to smaller ones utilizing Gaussian Approach. hT=4 years in Triangular Approach and hT=55 years in Gaussian Approach result in the smallest frequencies. The application of Modern Approaches in this example shows that: 1-storm frequencies resulted from Modern Approaches and for different hT values are smaller than or equal to the frequency calculated using Traditional Approach and, 2- storm frequency varies as a function of hT. The increasing or decreasing trend of frequency may change for a different set of hT values. This is explained by the effect of different approaches on the storm frequency and also by relatively long period of time (e.g., 1976-1991) within the dataset without any major events near VA Beach. The absence of data within these time spans distorts the temporal homogeneity of storm occurrence and the pattern of storm frequency does not show a clear trend. Research findings on storm frequency [20-22] also indicate that scientific community has not clearly agreed on the climate change contribution in hurricane frequency.
| ht = 55 years | ht = 25 years | ht = 14 years | |
|---|---|---|---|
| Rectangular Approach |
2.7890E-04 | 2.7674E-04 | 2.6750E-04 |
| Triangular Approach |
2.1012E-04 | 2.0906E-04 | 1.9941E-04 |
| Gaussian Approach |
1.7970E-04 | 2.3000E-04 | 2.4156E-04 |
Table 3: Omni-directional frequencies from Modern Approaches associated with different hT values.
The storm intensity is analyzed by fitting the temporal kernel function on storm pressure data to appreciate the events based on the time of occurrence. These functions were applied on central pressure of hurricanes and statistical displacement of the pressure field is summarized in Table 4. Note that the mean value of the pressure dataset presented in Table 1 is 965 mb by associating equal temporal weights (Traditional Approach) to the events. The mean value calculated using Rectangular and Gaussian Approaches for hT=55 years are consistent with the statistical value of Traditional Approach. Triangular Approach results in the most rapidly changing mean values. As hT decreases from 55 to 14 years, the central pressure is shifted to the lower values and storm intensity increases. The trend of central pressure variation is consistent with Figure 2 as the central pressure decreases and storm intensity increases near the present time.
| ht = 55 years | ht = 25 years | ht = 14 years | |
|---|---|---|---|
| Rectangular Approach |
965 | 958 | 958 |
| Triangular Approach |
961 | 956 | 953 |
| Gaussian Approach |
965 | 961 | 957 |
Table 4: Mean of central pressure (mb) from Modern Approaches associated with different hT values.
The RMW of Modern Approaches are shown in Table 5. The ht values in Table 5 are consistent with those in Table 4. Note that the time length of South Florida dataset (62 years) in longer than that for VA Beach. For ht=62 years, the mean RMW of Rectangular Approach (43.58 km) is equal to that of Traditional Approach. The results of Triangular and Gaussian Approaches indicate the continuous increase in RMW as ht decreases. From ht=55 to ht=25 years the RMW increases by 7 km and then decreases by 3 km from there to ht=14 years. This can be explained by the impact from hurricanes with small RMW such as Charley in 2004 and Dennis in 2005. The general increasing trend of RMW indicates that vaster area of South Florida has been impacted by the hurricanes occurred closer to the present time, as intended by the approach.
| ht = 55 years | ht = 25 years | ht = 14 years | |
|---|---|---|---|
| Rectangular Approach |
46 | 53 | 50 |
| Triangular Approach |
52 | 56 | 63 |
| Gaussian Approach |
44 | 51 | 54 |
Table 5: Mean of RMW (km) from Modern Approaches associated with different hT values.
Discussion
Numerous researches indicate that hurricane characteristics are likely to show different patterns in the future as the governing meteorological processes are influenced by climate change. The temporal kernel functions introduced in this study highlight the modern patterns of hurricane characteristics. The application of the proposed statistical framework is not limited to the storm frequency, storm intensity, and radius to maximum wind. The storm track heading or other characteristics that may vary in the future. Despite ongoing research, there is still a wide range of uncertainties about whether we will see a clear shift in future patterns of mid-Atlantic hurricane tracks. This topic drew attention particularly following Hurricane Sandy in 2012. Sandy proceeded along a typical path of mid-Atlantic hurricanes (toward northeast) but nearly at the same latitude with VA Beach the storm heading confronted Arctic anomalies and Greenland blocking, and was subsequently steered toward the east coast of U.S. [22-25]. Mattingly et al., [24] also discusses that the arctic anomalies and blocking pattern are correlated to the rapid decline in Arctic sea ice cover and accelerated melt of Greenland ice sheet during the recent decades. The possible changes in the heading of the storm track are another example of the potential for fundamental shifts in storm parameters within the mid-Atlantic region. Should any such changes be realized, the approach introduced in this study can be applied on directional storm frequency to assign more weight to recently occurred events and determine the possible pattern of future hurricanes.
The value of hT can be chosen based on the coastal area of interest and the pattern of hurricanes. The trend of data, the impact from unexpected extreme events, and level of required safety are the factors that play important roles in determination of the appropriate approach and the hT value. The decision made by climatologist would determine the pattern of hurricanes for prospective return periods.
The new kernel functions provide flexible approaches with different patterns of data consideration in the analysis. The weight of historic data may change slowly from old data to the most recent ones in Gaussian Approach, or rapidly from zero to the maximum value between two data points in Rectangular Approach. The choice of the proper kernel for a given study would be left to the JPM practitioner to justify within their particular work.
Conclusion
Myriad research suggests that some characteristics of hurricanes are likely to be impacted by climate change. Three kernel based approaches were proposed in this study that allows the JPM practitioner to highlight the characteristics of modern hurricanes within the storm climatology analysis. These approaches modulate the weighting coefficients of individual events in the probability analysis, such that modern storms are weighted more heavily. The temporal kernel functions assign weights to an array of historic data with the minimum and maximum weights given to the older and the newer data points, respectively. These weights project the data for future scenarios with greater emphasis on recently occurring events. The proposed approaches were applied on historic hurricane characteristics in VA Beach and South Florida. The results of analyses were consistent with the expected trend of the data.
Acknowledgement
The authors are grateful of Michael Baker International for the continued support of research based studies in coastal science and engineering practices.
References
- Resio DT(2007) White Paper on Estimating Hurricane Inundation Probabilities. In:  Boc SJ, Borgman L, Cardone V, Cox A, Dally WR, Dean RG, Divoky D, Hirsh E, Irish JL, Levinson D, Niedoroda A, Powell MD, Ratcliff JJ, Stutts C, Suhada J, Toro GR, and Vickery PJ (eds.). Appendix 8-2 (R2007) of USACE (2007), Interagency Performance Evaluation Taskforce (IPET) Final Report.
- Toro G, Resio DT, Divoky D, Niedoroda AW, Reed CW (2010) Efficient joint probability methods for hurricane surge frequency analysis. Ocean Engineering 37:125-134.
- Mousavi ME, Irish JL, Frey AE, Olivera F, Edge BL (2011) Global warming and hurricanes: the potential impact of hurricane intensification and sea level rise on coastal flooding. Climatic Change 104:575–597.
- Reed AJ, Manna ME, Emanuel KA, Lin N, Hortone BP, et.al. (2015) Increased threat of tropical cyclones and coastal flooding to New York City during the anthropogenic era. Proc Natl Acad Sci U S A 112:12610-12615.
- Emanuel K (2005) Increasing destructiveness of tropical cyclones over the past 30 years. Nature 436: 686-688.
- Knutson TR, Tuleya RE (1999) Increased hurricane intensities with CO2-induced warming as simulated using the GFDL hurricane prediction system. Climate Dyn 15: 503–519.
- Shen W, Tuleya R.E, Ginis I (2000) A sensitivity study of the thermodynamic environment on GFDL model hurricane intensity: Implications for global warming. J Climate 13: 109–121.
- Hill KA, Lackmann GM (2011) The impact of future climate change on TC intensity and structure: A downscaling approach. J Climate 24: 4644–4661.
- Henderson-Sellers A, Zhang H, Berz G, Emanuel K, Gray W, et.al. (1998) Tropical Cyclones and Global Climate Change: A Post-IPCC Assessment. Bull Amer Meteor Soc 79: 19–38.
- Trenberth KE (2012) Framing the way to relate climate extremes to climate change. Climate Change 115:283-290.
- Rosenzweig C, Solecki W (2014) Hurricane Sandy and adaptation pathway in New York: Lessons from a first-responder city. Global Environmental Change 28:395-408.
- Solecki W (2015) Hurricane Sandy in New York, extreme climate events and the urbanization of climate change: perspectives in the context of sub-Saharan African cities. Environmental Sustainability 13:88-94.
- Chouinard LE, Liu C (1997) Model for Recurrence Rate of Hurricanes in Gulf of Mexico. J. Waterway, Port, Coastal, Ocean Eng 123: 113-119.
- Ezer T, Atkinson LP (2014) Accelerated flooding along the U.S. East Coast: On the impact of sea-level rise, tides, storms, the Gulf Stream, and the North Atlantic Oscillations. AGU Publication 2: 362-382.
- Keshtpoor M, Puleo JA, Shi F, DiCosmo, Nicholas R (2014) Numerical simulation of nearshore currents and sediment transport patterns downdrift of a tidal inlet. J Waterw Port Coast Ocean Eng 141.
- Keshtpoor M, Puleo JA, Shi F (2014) Downdrift Beach Erosion Adjacent to the Indian River Inlet. Shore & Beach 82: 31-41.
- Kian R, Pamuk A, Yalciner AC, Zaytsev A (2015) Effect of Tsunami Parameters on the Sedimentation. Coastal Sediments Conference, San Diego, CA.
- Kian R, Yalciner AC, Zaytsev A, Aytore B, (2015) Tsunami Induced Resonance in Enclosed Basins, Case Study of Haydarpasa Port in Istanbul. European Geoscience Union General Assembly, Vienna, Austria.
- Knutson TR, Sirutis JJ, Garner ST, Vecchi GA, Held IM (2008) Simulated reduction in Atlantic hurricane frequency under tweny-first-century warming conditions. Nature Geoscience 1: 359 - 364.
- Zhao M (2009) Simulations of Global Hurricane Climatology, Interannual Variability, and Response to Global Warming Using a 50-km Resolution GCM. J Climate, 22: 6653–6678.
- Bender MA, Knutson TR, Tuleya RE, Sirutis JJ, Vecchi GA, et.al. (2010) Modeled Impact of Anthropogenic Warming on the Frequency of Intense Atlantic Hurricanes. Science 327: 454 – 458.
- Blake ES, Kimberlain TB, Berg RJ, Cangialosi JP, Beven II JL (2013) Tropical Cyclone Report - Hurricane Sandy (AL182012) 22-29 October 2012. National Hurricane Center.
- Mattingly KS, McLeod JT, Knox JA, Shepherd JM, Mote TL (2015) A climatological assessment of Greenland blocking conditions associated with the track of Hurricane Sandy and historical North Atlantic hurricanes. Intl J Climatol 35:746-760.
- Federal Emergency Management Agency(2015) South Florida Storm Surge Study: Intermediate Data Submittal 1 Section 5. Prepared by Baker AECOM, LLC.
Citation: Keshtpoor M, Osler M (2016) Climate Change Impact on Probability Analysis of Hurricanes. J Earth Sci Clim Change. 6: 317. DOI: 10.4172/2157-7617.1000317
Copyright: © 2016 Keshtpoor M, et al. This is an open-access article distributed under the terms of the Creative Commons Attribution License, which permits unrestricted use, distribution, and reproduction in any medium, provided the original author and source are credited.
Share This Article
Recommended Journals
Open Access Journals
Article Tools
Article Usage
- Total views: 14304
- [From(publication date): 12-2015 - Apr 03, 2025]
- Breakdown by view type
- HTML page views: 13419
- PDF downloads: 885