Research Article Open Access
Climate Change Impact on Land Suitability for Rainfed Crop Production in Lake Haramaya Watershed, Eastern Ethiopia
| Robai N Liambila* and Kibebew Kibret | |
| School of Natural Resources Management and Environmental Sciences, Haramaya University, Ethiopia | |
| *Corresponding Author : | Robai N Liambila School of Natural Resources Management and Environmental Sciences Haramaya University, Ethiopia Tel no: +254721268006 E-mail: liambilarobai@gmail.com |
| Received: March 14, 2016 Accepted: March 30, 2016 Published: April 04, 2016 | |
| Citation: Liambila RN, Kibret K (2016) Climate Change Impact on Land Suitability for Rainfed Crop Production in Lake Haramaya Watershed, Eastern Ethiopia. J Earth Sci Clim Change. 7:343. doi:10.4172/2157-7617.1000343 | |
| Copyright: © 2016 Liambila RN, et al. This is an open-access article distributed under the terms of the Creative Commons Attribution License, which permits unrestricted use, distribution, and reproduction in any medium, provided the original author and source are credited. | |
Visit for more related articles at Journal of Earth Science & Climatic Change
Abstract
Understanding the effects of climate change on land suitability for crop production has become an important issue with respect to food security. The main objective of this study was to evaluate the impacts of climate change on land suitability for rainfed crop diversification under current and future climate change scenario in Legambo sub-watershed. Microcomputer Land Evaluation Information System Decision Support System (MicroLEIS DSS) through the application of Almagra and Terraza models was used. Almagra model assesses the suitability of different soil types to a specific crop. Terraza model provides an experimental prediction for the bioclimatic deficiency. Soil morphological and analytical data were obtained from 4 representative soil profiles and stored in the Soil Database (SDBm). Agro-climatic data for 20 consecutive years (1995-2014), were obtained from National Meteorological Agency and incorporated to the Climate Database (CDBm). A future scenario of climate change was calculated according to the predictions of Intergovernmental Panel on Climate Change (IPCC) on regions of East Africa under scenario Representative Concentration Pathway (RCP) 8.5(high-emission scenario) by 2100. The results show that, the most suitable crops to grow in the study area are sweet potato > sorghum > maize > soybean > wheat in respect of that order. The main limitation factors for land suitability are soil texture and drainage conditions. Bioclimatic deficiency evaluation showed a positive response to climate change, with percent yield reduction decreasing. The net effect of climate change on land suitability is positive for both hypothetical scenarios and therefore, the study area is suitable for rainfed crop production for the selected Land Use Types (LUTs).
| Keywords |
| Crop diversification; Sustainable use; MicroLEIS; Decision support tools |
| Introduction |
| Climate change is a widespread challenge affecting many parts of the world [1]. This changes will not occur without marked impacts upon various sectors of our environment, and consequently of our society [2]. The changes in climate will appear and will have an important impact on land suitability and in particular, for rainfed crop production. Climate change has raised much concern regarding its impacts on future global agricultural production, varying by region, time, and socio-economic development path [3]. |
| Relatively scarcity of land resources for agriculture and insufficient food security of the world’s population require that the land be used in an optimum way in the context of climate change. With the increase of demand for land, land evaluation has become more important as people strive to make better use of the limited land resources. The principle purpose of land suitability evaluation is to predict the potential and limitation of the land for crop production [4]. Therefore, suitability is a function of crop requirements and land characteristics [5]. Land suitability analysis is a prerequisite to achieve optimum utilization of available land resource for agricultural production in a sustainable manner. It is crucial for planners and agricultural scientists to initiate and encourage farmers to practice cropping systems based on soil potential in the context of climate change. |
| Agriculture in Ethiopia has long been a priority and focus of national policy. Abera [6] stated that, one of the most important and urgent problems in Ethiopia are to improve agricultural land management and cropping patterns to increase the agricultural production with efficient use of land resources. Moreover, for these resources to be sustainable, both the policymaker and the land manager require information on how management options are influenced by the risks and opportunities associated with climate change. Lake Haramaya watershed is one of the most degraded lands in the Ethiopian highlands. More than 90 percent of Lake Haramaya watershed people are engaged in agricultural activities for their livelihood. Predominantly smallholding farmers depend on rainfall to cultivate their crops. Poverty, lack of access to improved technology, subsistence agriculture, deforestation, soil erosion, degraded lands, and over-population are some of the problems that increase the vulnerability of the people to climate change. |
| The amount of land is fixed; the kinds of use that the land can support and the competition among these uses vary over time. The intensity of the competition is often proportion to the density of the population and in the demands of the population on the land [7]. In this manner, land suitability evaluation plays very important role in order to help developers and agriculturists to match the land optimum use and optimizing the use of a land piece for a specified use [8]. |
| Wheat, maize and sorghum are important crops commercially produced in major parts of Ethiopia and Eastern Hararghe region, where there production depends very much on climate, soil, topography and water availability. These are the most important categories of environmental information required for land suitability evaluation. A variety of national suitability studies for specific crops exists [9,10], while a few exist for a broad variety of crops [11,12]. These researches do not consider long-term climate change and their impact on the suitability of the crops. In this sense, MicroLEIS DSS, a relational database management system offers a convenient platform for performing climate change impact on land suitability and as a tool critical in decision support. |
| There are many models and computer packages for simulating the land evaluation applications for land use planning [13]. Since the late 1980s, MicroLEISDSS model has evolved significantly towards an interface user-friendly agro-ecological system for sustainable land management [14]. MicroLEIS model has been used to predict the agricultural land suitability in many areas. Salem et al. [15] found that the soils of El-Bostan, El-Nubariya region, can be diagnosed into highly suitable, moderately one and not suitable with respect to soil texture and the exchangeable sodium percent (ESP). Shahbazi et al. [16] applied MicroLEIS DSS to evaluate the land use planning in Ahar area, East Azarbaijan. Results showed that in Ahar area, 45% of the total extension was classified as good capability land for agricultural. |
| Meanwhile, to evaluate the soil suitability of Lake Haramaya watershed, Ethiopia, for some specific crops, land suitability using MicroLEIS DSS system was implemented. The MicroLEIS DSS models are described in detail by De la Rosa et al. [17], Farroni et al. [18] and Horn et al. [19]. Suitability was determined, based on matching the biological requirements of crops to the quality and characteristics of land within the region in Lake Haramaya watershed. The methodology adopted combines most aspects of climate, site and soil attributes that influence crop suitability appropriate to the study area. |
| The main objective of this study was to evaluate the impacts of climate change on land suitability for rainfed crop production to achieve sustainable agriculture in the long term. The specific objectives were to (1) identify land suitability for specific crops for diversification and (2) to estimate crop yield reduction in rainfed condition in the study area. This research work provides information at local level which could be utilized by farmers for selecting the proper cropping pattern. |
| Materials and Methods |
| Description of the study area |
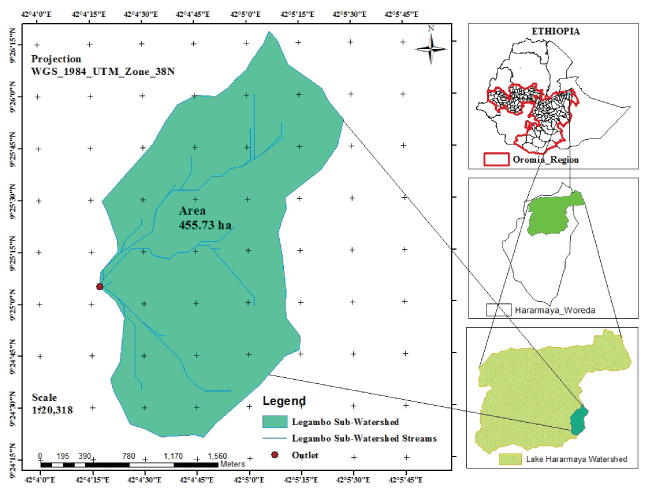
| Lake Haramaya Watershed is located in Haramaya and partly in Kombolcha districts, Eastern Hararghe Zone, Oromia National Region State, and East Ethiopia (Figure 1). It is located at the upstream part of Wabishabele Drainage Basin. The Watershed lies between 9°23´12.27´´– 9°31´9.85´´ N and 41°58´28.02´´–42°8´h10.26´´ E (UTM Zone 38) and covers an area of 15,329.96 ha. This study was conducted in Legambo sub-watershed, which is one of the 28 subwatersheds in Lake Haramaya watershed. It is 455.73 ha and is located between 9°24´25´´– 9°26´17´´ and 42°04´16´´– 42°5´26´´ E (Figure 1) (UTM Zone 38). Its slope ranges from 0.4 to 37.5%, and the elevation is from 2092 to 2345 meters above sea level. |
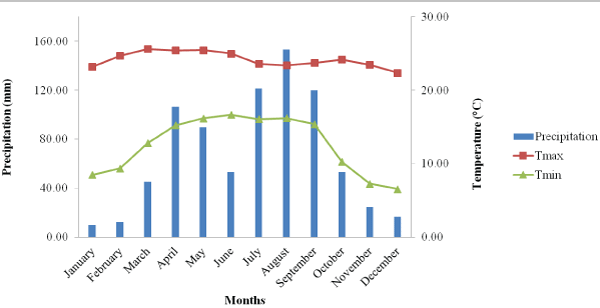
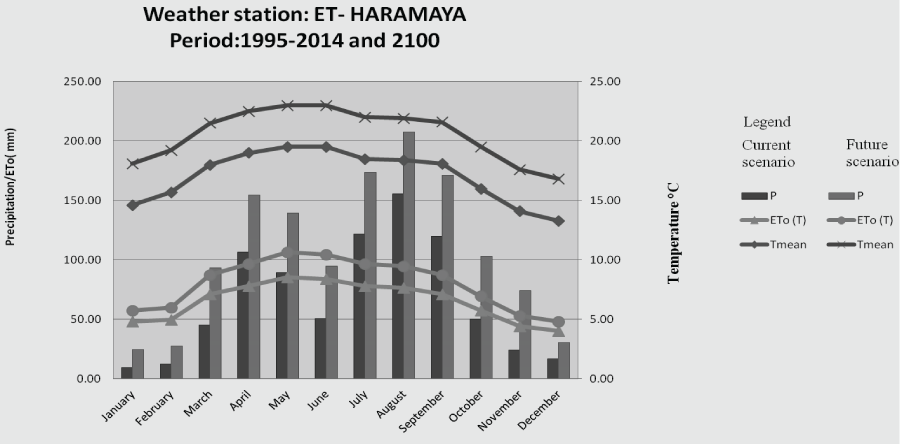
| Information obtained from Ethiopian National Meteorology Agency indicates that the mean annual rainfall and mean maximum and minimum temperatures of Haramaya watershed are 800.9 mm, 24.18°C, and 9.9°C, respectively for the last 20 years (1995-2014) as presented by Figure 2. The short rainy season, belg, stretches from March to May, while the main rainy season, kiremt extends from July to September, with the peak in August. However, it has been observed recently that the major portions of the agricultural soils in Legambo sub watershed are very shallow and most soils of the steeper slopes are unproductive truncates exposed to the sub soils. About 71% of the catchment is characterized by undulating and rolling topography [20]. Based on United States Department of Agriculture (USDA) soil textural classification scheme, the soils in the Watershed are grouped in to four different classes: clay, clay-loam, sandy clay loam and sandyloam [21]. |
| The components of farming systems are smallholder mixed croplivestock production. The major annual crops are sorghum (Sorghum bicolor L.) and maize (Zea mays, L.), intercropped with legumes. Bread wheat (Triticum aestivum L.) and sweet potato (Ipomoea batata L.) are grown in small areas. Sorghum and maize are cultivated under rain-fed conditions [22]. The major crops grown under irrigated conditions are, Khat (Catha edulis) (a woody stimulant species), which forms the main perennial cash crop of the sub-watershed, irish potato and vegetables (lettuce, carrot, onion, tomato and cabbage). The components of the livestock system are cattle, donkey, goats, sheep, and poultry at both farms. Livestock are used as source of food (meat, milk, and milk products) and as saving asset, while manure is used for soil fertility management to some extent. |
| Site selection, soil sampling and preparation |
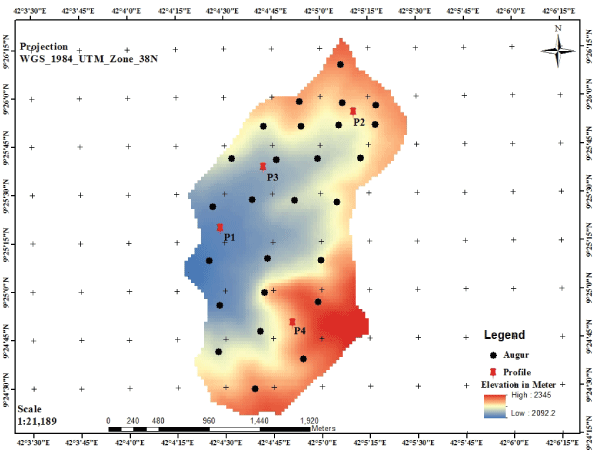
| Soil investigation was carried out in two successive steps (auger observation and profile sampling) based on major land/soil characteristics. In this case, with the help of the Arc GIS 10.1. The slope of the study area was reclassified into six slope classes, based on the FAO (WRB, 2014) general slope classes with some modification. Fixed-grid survey technique (100 by 100 m interval) was employed and soil auger observations made, using ‘Edelman auger’, at every 100 m by 100 m distance to identify variations in soil depth and texture characteristics along the slope gradient. The depth of augering was 100 cm, unless the soil depth was limited or lithic contact prevents the operation. Hand held GPS Garmin GPS MAP 62s (Garmin limited, 2011) was used for geo-referencing the augering points. The auger observations for the soil depth and surface texture were grouped into the USDA [23] depth and texture classes. Points with the same soil depth class and surface soil texture in a given slope class were considered as a single mapping unit. Boundaries of the mapping units were then delineated into four land mapping units namely LG001 (Slope 0-4%), LG002 (Slope 4-7%), LG003 (Slope 14-32%) and LG004 (Slope 7-14%), |
| Following the identification of the mapping units, further soil characterization was done using 4 soil profile pits that were excavated at the representative sites in each mapping unit (Figure 3). The profiles were described in-situ for morphological characteristics according to FAO WRB [24], and soil samples taken from every identified horizon. Soil samples were collected packed in plastic bags and processed for laboratory analyses. |
| Useful depth (cm), degree of profile development, drainage and carbonate content in representative soil profiles were determined and analyzed. Disturbed soil samples were air-dried, crashed and sieved (<2 mm) for the analysis of all soil properties. |
| Laboratory analysis of soil samples |
| Soil pH (soil reaction) was measured in 1:1 soil: water suspension solution using the Consort pH meter model C835. Salinity (dS/m) was measured using the Jenway conductivity meter model 4510 in soil to water ratio of 1:2.5 [25]. The cation exchange capacity (CEC) was determined after extracting the soil samples by ammonium acetate at pH 7.0 [26]. Particle size distribution was determined by hydrometer method [27]. Exchangeable calcium (Ca) and magnessium (Mg) in the extracts was determined using Buck atomic absorption spectrophotometer (AAS) model 210 VGP, whereas sodium (Na) and potassium (K) were quantified by Corning flame photometer model 410 [25]. The exchangeable sodium percentage (ESP) was then estimated from the concentrations of the exchangeable Na, and CEC. The analyses were undertaken at Haramaya University Soil Chemistry Laboratory. |
| The mean weighted value of each determined soil property (V) was calculated by multiplying the parameter value (Vi) of each horizon by horizon thickness (ti) divided by the total profile depth (T) according to the following equation [28]: |
 (1) (1) |
| After the final data preparation of the soil morphological, physical and chemical characteristics of representative mapping units, a multilingual SDBm Plus [29,30] was used to store and manipulate the soil data extracted from soil profiles to create information in control section between 0 to 100 cm using “File layer generators”to apply in the Almagra model. |
| Land suitability evaluation |
| The aim of this research was to investigate the study area to arrive at the possible LUTs. During the field study, rainfed crop production was considered as the major land use. For this study area, the different LUTs (crops) selected for evaluation were sorghum (Sorghum bicolor L.), maize (Zea mays L.), bread wheat (Triticum aestivum L.), sweet potato (Solanum tuberosum L.) and soybeans (Glycine max L.). |
| The physical and chemical properties were applied to Almagra Model available at Ref [31] to run the land suitability evaluation for some selected crops: wheat, maize, sweet potato, and soybean as annuals. The crops were evaluated based on available soil conditions of the study area. |
| The input for the analysis included useful effective depth (p), texture (t), drainage (d), carbonate content (c), salinity (s), sodium saturation (a) and degree of profile development (g), which was used as diagnostic criteria. Depending on the gradation considered for each of the criterion that was selected, five relative suitability classes was determined; optimum, highly, moderately, marginally and no suitability, represented as S1, S2, S3, S4 and S5, respectively. Sub classes were indicated by the level that corresponds to the maximum limiting soil factors. A simple map subsystem (Arc GIS 10.1) was used to show basic data and model results on a map. |
| Almagra model does not provide land suitability for sorghum, since sorghum is one of the most common crops in the study area. The land suitability was carried out manually by selecting specific criteria (drainage, texture, soil depth, CEC, pH, organic carbon and salinity) according to Sys et al. [32] where four suitability classes were established S1, S2 S3 and N. This is based on the FAO land evaluation framework [33] for rainfed agriculture. The adopted method consists of matching individual crop requirements as specified in the land evaluation manual (part III) [32], with the actual land characteristics. A suitability rating was attributed to each land characteristic. The crop requirements were further adjusted to suite the conditions of the study area. The suitability analysis was done per mapping unit and the results integrated to the Arc GIS and the simple map produced. |
| Agro climatic data collection and analysis |
| Climatic data such as mean, maximum and minimum temperatures for each month and total annual precipitation for the last 20 (1995- 2014) consecutive years was collected from National Meteorological Agency (NMA), Ethiopia. Mean monthly values of a set of temperature and precipitation variables were stored in a CDBm, which includes software subroutines for calculating climate variables for use in agricultural land evaluation, organization, storage and manipulation of agro-climatic data. |
| The projected temperature increase is widespread over the globe [34]. Therefore, to apply the land suitability evaluation approaches due to climate change and perturbation, two climatic scenarios were constructed. The first scenario was defined by the climate of the current situation, extracted from the climate observations during the last 20 years (1995-2014) for the study area, while the second scenario was based on projected changes in surface air temperature and precipitation for Africa under the highest future emission trajectory (RCP8.5) by 2100 (IPCC, 2013). The IPCC (2013) report on the prediction in changes in mean annual temperature and precipitation compared to the present status (1995-2014) for the study area was used to describe the situation by 2100. |
| Model projections out to 2100 have become the de facto standard, as in the assessment reports produced by the IPCC. This period is within the planning horizon of many natural resources managers especially for Africa where development rate is slow. Furthermore, the climate change that will occur during this period is not well understood. |
| Bioclimatic deficiency evaluation |
| For the calculation of water deficiency and percent yield reduction for the selected crops in the study area, the Terraza model was applied. The calculation of water deficiency and percent yield reduction includes the daily precipitation and temperature compilation on a decadal (10 days) and monthly basis for a period of 20 years (1995-2014). The bioclimatic classification begins by determining the monthly potential evapotranspiration (ETo), using the method of Thornthwaite [35], from the monthly mean temperature (Tm), and the monthly coefficient of light correction (Nm) depending on the site latitude calculated by the CDBm database. Terraza model evaluates the water deficiency of a site mainly from climatic factors and certain others of the plant, so that the evaluation of a single land unit (climate) may differ depending on the current use (crop). In general, the criteria followed are those established by the FAO [36] with some modifications. |
| The monthly reduction in crop production (Ry) was calculated using the following formula [36]: |
| 1 - Ya/Ym = Ky(1 - ETa/ETc) (2) |
| Substituting |
| 1 - Ya/Ym = Ry (3) |
| we have |
| Ry = Ky(1 - ETa /ETc) x 100 (expressed as %) (4) |
| Where: Ya, real crop production, Ym, potential crop production, Ky, coefficient of efficiency of the crop. |
| The annual reduction in crop production (Rys) was calculated as follows: |
| Rys = Kys (1 - ΣETa/ ΣETc ) x 100 (5) |
| Where: Kys, coefficient of seasonal reduction, ΣETa, sum of the monthly real evapotranspiration during the phonological period of the crop ΣETc, sum of the monthly evapotranspiration of the crop during its phenological period. |
| The Terraza model allows a possibility of defining any arbitrary set of climate perturbation(s) as the hypothetical climate change. For example, maximum and minimum temperature (°C) and precipitation (%) are climate related factors which can be manipulated as climate change by adding to the previous figures. |
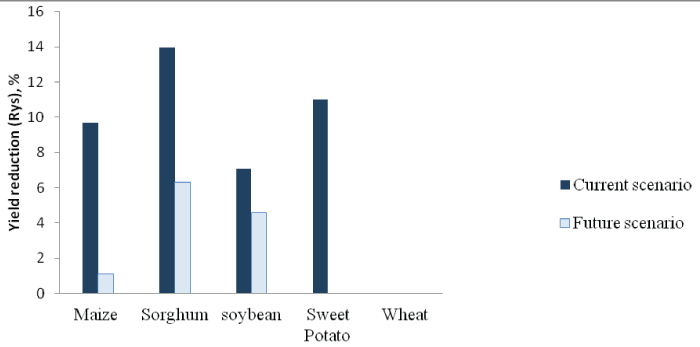
| Reduction in yield of sorghum, maize, soybeans, sweet potato and wheat of rainfed conditions were estimated and the results are shown in Figure 10. From the range of annual reduction in crop production (Rys), four classes of water deficiency were established H1-H4. |
| Results and Discussion |
| Land suitability for crops |
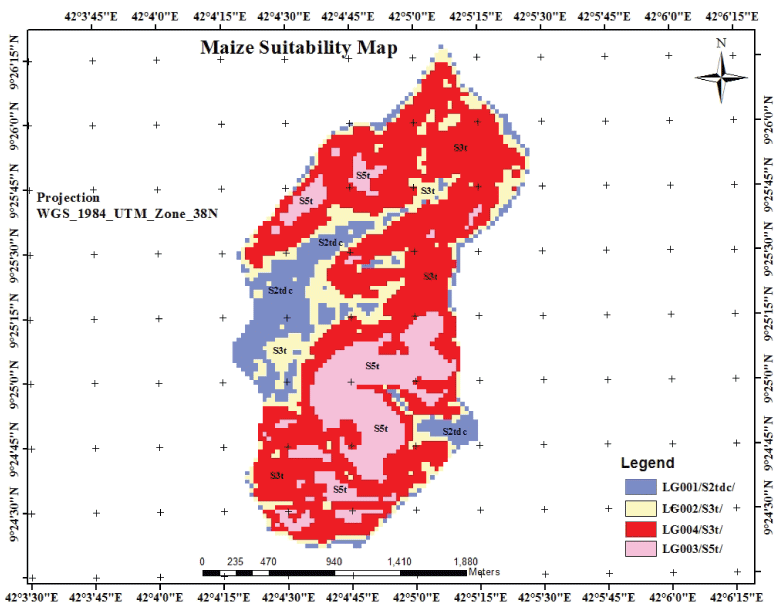
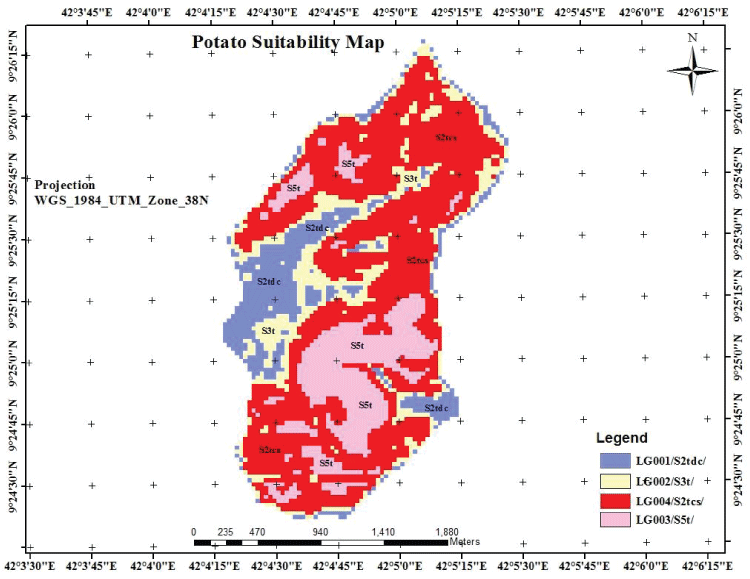
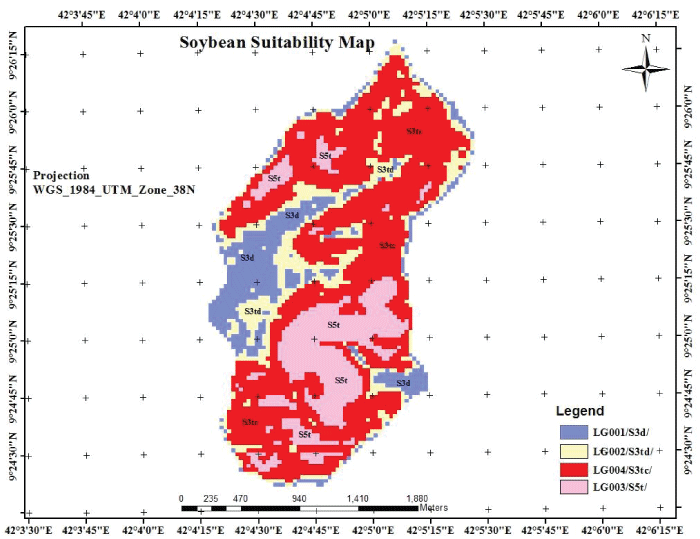
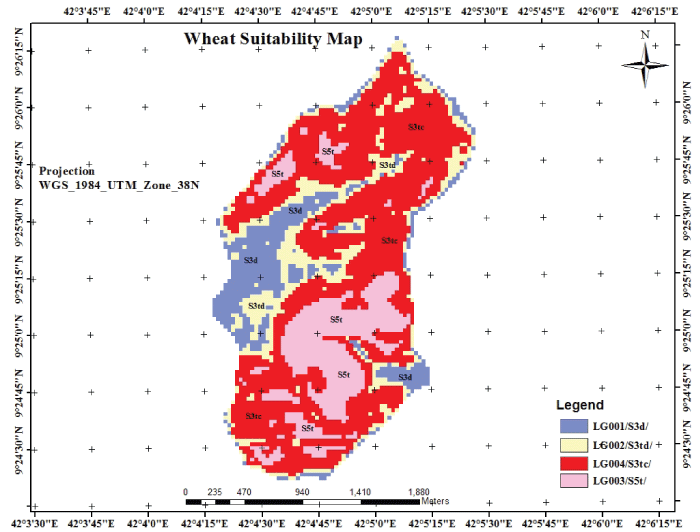
| The results of land suitability evaluation obtained by applying the Almagra (agricultural soil suitability) model, which is built in MicroLEIS system for agriculture land evaluation, are presented in Table 1. It includes the soil suitability classes for the selected crops and limitations. The results from Almagra were incorporated into the Arc GIS 10.1 and simple maps produced (Figures 4-7). |
| Out of four investigated mapping units, the map unit LG001 showed high suitability (S2) for maize and sweet potato crops but with texture, drainage and carbonate as limiting factors, nevertheless, it showed moderate suitability (S3) with drainage limitation for the remaining crops. The map unit LG002 showed moderate suitability to all the crops (S3) with texture and drainage constraints. However, LG003 showed no suitability (S5) with texture constraint to all the crops. Partly, map unit LG004 illustrated suitability to sweet potato, with texture, carbonate and salinity constraints and the rest of the crops showed moderate suitability with texture and carbonate as limiting factors (Table 2). The suitability classes were based on maximum limitations factors that cannot be corrected. |
| The land suitability in the study area for maize cultivation showed that, 14.11 % out of the total area is classified as highly suitable soils (S2) and 68.26% as moderately suitable (S3), while 66.61% is classified as highly suitable for sweet potato production and 15.76% as moderately suitable. On the other hand, 82.37% is classified as moderately suitable for wheat and soybean cultivation; however, 17.25% has no suitability for maize, wheat, sweet potato and soybean (S5) (Table 1) |
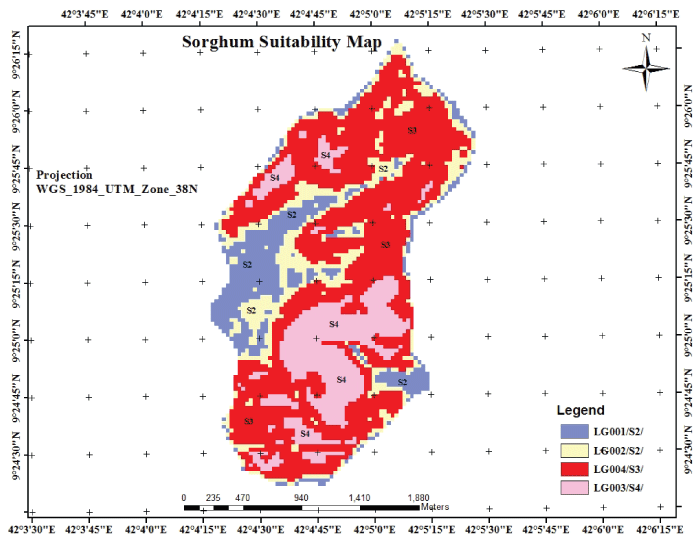
| On the other hand, MicroLEIS model does not include sorghum (Sorghum bicolor L.) in the suitability analysis. Due to the dominance of sorghum crop in the study area, soil suitability for sorghum was carried out manually according to the same principles applied in Almagra model and results integrated to Arc GIS 10.1. The result indicated that 29.86% of the study area is highly suitable, 52.51% as moderately suitable while 17.25% as marginally suitable for sorghum cultivation (Figure 8). |
| The most suitable field crop to grow in the studied area is sweet potato; it is considered the most suitable because S2 percent area was more than 60%, while sorghum and maize are also considered suitable (Table 1). These crops are considered suitable because the (S2) percent area for each single crop represents at least more than 10% of the investigated area that are represented by LG001, LG002, LG003 and LG004 mapping units. With the exception of sweet potato crop, approximately more than 50% of the studied area is considered moderately suitable (S3) for each of the examined crops because of the texture, soil salinity, and carbonate and drainage conditions. It is necessary to mention that approximately 17.25% of the investigated area is not suitable (S5) for growing most of the evaluated crops, except sorghum. This is as a result of dominant soil conditions within the study area. The soil texture is the limiting factor that more appears at the evaluation. Drainage, salinity and carbonate are also limiting factors for the cultivation of the selected crops. |
| Considering the suitability classification of sorghum, the arrangement of priority agricultural utilization or crop diversification according to their soil suitability classes in this area is as follows: sweet potato, sorghum, maize, soybean and wheat in respect of that order. The result of crop diversification is shown in Table 2. |
| Impact of Climate Perturbation |
| Predictions for East Africa by 2100 under the RCP8.5 scenario indicate that the mean temperature will increase by 3.5º C in all four season, in the future scenario and at the study area with respect to present day (1995-2014). The total precipitation projected is variable where the spring and summer season will increase by 10 percent, and 20 and 50 percent in autumn and winter, respectively (Table 3). In the study area, climate change will not cause severe water stress in the 21st century, because of the predicted increase in precipitation. |
| Using the RCP8.5 scenario (highest future emission trajectory) for 2100s, the basic necessary data of CDBm program such as mean, maximum and minimum temperatures, as well as total annual precipitation were calculated. Summaries of water balance components calculated through CDBm program of MicroLEIS for current scenarios and future for Haramaya station are graphically shown in (Figure 9). |
| Through climate change in the long term; annual average temperature, precipitation, and evapotranspiration will be increased by 3.5°C, 61.5 and 22.7%, respectively. Although precipitation increases are anticipated, it is important to note this does not necessarily translate into more available moisture for crop production. Higher temperatures increase evapotranspirative losses to the atmosphere, and the relative balance of the two factors may lead to less moisture in soils and surface waters for crop to utilize both now and in the future. This means that in the distant future, in spite of increase in rainfall in the study area; the main problem confronting agricultural land use might be flooding and probably post-harvest losses, due to high humidity during harvest period. FAO [37] stated that, areas such as in East Africa and the Ethiopian highlands, rainfall and runoff are expected to increase with climate change, and more extensive and severe flooding is anticipated. |
| Crop yield reduction |
| The bioclimatic deficiency was calculated by the application of the Terraza model, for the major crops, sorghum, maize, soybean, sweet potato and wheat. In the current scenario, the Terraza modelling approach predicts that, all the crops are suitable for the production. Wheat has 0% (H1 class) of yield reduction, currently maize, sorghum soybean and sweet potato have 9.68, 13.97, 7.06 and 10.99% (H1 class) yield reduction, while this reduction will decrease to 1.11, 6.31, 4.58 and 0%, respectively, in the future scenario (Figure 10). |
| The results showed that, the current water deficit in the study area will be reduced as a result of climate change by the 2100 for all the crops except wheat. Sorghum has the highest percentage yield reduction, this can be attributed to the high demand of water during the midstage of growth. All the crops that showed yield reduction either in the current or future scenario, there are possible explanations to this distinct behavior. One could be sorghum, sweet potato, soybean and maize have their phenological period that covers from March/April to August/September which coincides with the climatic conditions of maximum reduced precipitation and increased evapotranspiration in the month of June. For all the crops monthly yield reduction (Ry %) was experienced in June except sweet potato that was in May and June. From the climate data, the precipitation reduces in June and picks up again in July. This shows that the greatest reduction in available precipitation is encountered when the crops are planted early rather than late, and the same scenario will be experienced in the future. Wheat is planted in July, and this clearly shows why there is no yield reduction because the crop receives maximum precipitation throughout its growth period. Water availability and quality, and timing of rains for initial sowing during the growth cycle and at harvesting can have significant impacts on yields [38]. Therefore, planting dates changed for a better match with season length and productivity in relation to temperature, water availability and rainfall. |
| Conclusion |
| Climate change is rapidly emerging as a serious threat worldwide. No country is immune from its impacts. In Ethiopia, climate change poses the risk to the suitability of land in this region, which depends predominantly on agrarian economy, which is rainfed and smallscale farming. Significantly degraded lands, high rural population and utilization of lands regardless of its suitability points to a need to evaluate the impacts of climate change on land suitability. This research evaluates the suitability of land to some specific rainfed crops in Legambo- Lake Haramaya watershed with the aim of producing optimum agriculture land use by using MicroLEIS evaluation models. The produced agricultural land use could provide decision makers, land managers, and farmers with the information needed for improving land use quality decisions and guide them as to what crops are mostly suitable for the area. |
| The results showed variation in land suitability for different crops. In general, 82.35% of the study area is highly suitable to moderately suitable, while 17.25% of the study area was not suitable for rainfed agriculture. Both the classes S2 and S3 (highly suitable to moderately suitable) and S4 and S5 (marginally suitable and non-suitable) were the most representative classes for the crops. Mapping unit LG003 with 78.59 ha extension are not suitable for agricultural uses. Mapping units LG001, LG002 and LG004 with 375.32 ha extension are suitable and moderately suitable. Generally speaking, the main restricting factors for good land suitability in this study area were, texture and drainage. The arrangement of priority agricultural utilization or crop diversification was selected as sweet potato> sorghum > maize > soybean > wheat in that order. |
| Bioclimatic deficiency on the other hand, is the most-sensitive factor affected by climate change. For rainfed conditions, the percent yield reduction decreases with climate change for all the studied crops, as follows: wheat < sweet potato < soybean < maize < sorghum. Climate perturbation effects on rainfed conditions showed a positive impact on all the crops. The percent yield reduction will reduce in the future scenario, although, the general classification remains constant, and with special reference to the wheat crop, is constant in the two comparable scenarios with 0% yield reduction. |
| The marginally suitable areas for the major staple crops such as sorghum and maize are encouraging, in general, those crops can continue to be grown where they are currently grown because climate change provides better opportunity in terms of increased precipitation and temperature to which from the results is not likely to affect growth and yield. The net effect of climate change on land suitability is positive and therefore, this study area would take advantage and improve the lands that showed low suitability due to limitation factors that its effects can be manageable, such as texture and drainage through good agricultural practices. |
| The use of other robust models that can accommodate limitations of the present model can be used for further studies. To accommodate the social and economic factors in land suitability evaluation, gives a good idea especially when recommending the farmers to reallocate lands for each land use type. |
References
|
Tables and Figures at a glance
| Table 1 | Table 2 | Table 3 |
Figures at a glance
 |
 |
 |
 |
 |
| Figure 1 | Figure 2 | Figure 3 | Figure 4 | Figure 5 |
 |
 |
 |
 |
 |
| Figure 6 | Figure 7 | Figure 8 | Figure 9 | Figure 10 |
Relevant Topics
- Atmosphere
- Atmospheric Chemistry
- Atmospheric inversions
- Biosphere
- Chemical Oceanography
- Climate Modeling
- Crystallography
- Disaster Science
- Earth Science
- Ecology
- Environmental Degradation
- Gemology
- Geochemistry
- Geochronology
- Geomicrobiology
- Geomorphology
- Geosciences
- Geostatistics
- Glaciology
- Microplastic Pollution
- Mineralogy
- Soil Erosion and Land Degradation
Recommended Journals
Article Tools
Article Usage
- Total views: 13128
- [From(publication date):
March-2016 - Apr 01, 2025] - Breakdown by view type
- HTML page views : 11711
- PDF downloads : 1417
