Research Article Open Access
Circumferential versus Hand-held Laser Scanner Method for the Evaluation of Lower Limb Volumes in Normal-weight and Obese Subjects
Nicola Cau1*, Stefano Corna2, Valentina Aspesi2, Francesco Postiglione2, Manuela Galli1,3, Elena Tacchini2, Luisa Brugliera2, Veronica Cimolin1 and Paolo Capodaglio21Department of Electronics, Information and Bioengineering, Politecnico di Milano, Piazza Leonardo da Vinci 32, 20133 Milan, Italy
2Rehabilitation Unit and Research Lab in Biomechanics and Rehabilitation, S Giuseppe Hospital, Istituto Auxologico Italiano, Piancavallo (VB), Italy
3IRCCS “San Raffaele Pisana”, Tosinvest Sanità, Roma, Italy
- *Corresponding Author:
- Nicola Cau
Department of Electronics, Information and Bioengineering
Politecnico di Milano, Piazza Leonardo da Vinci 32, 20133 Milan, Italy
Tel: +39 02 23993359
Fax: +39 02 23993360
E-mail: nicola.cau@polimi.it
Received date: July 19, 2016; Accepted date: July 30, 2016; Published date: August 10, 2016
Citation: Cau N, Corna S, Aspesi V, Postiglione F, Galli M, et al. (2016) Circumferential versus Hand-held Laser Scanner Method for the Evaluation of Lower Limb Volumes in Normal-weight and Obese Subjects. J Nov Physiother 6:303. doi:10.4172/2165-7025.1000303
Copyright: © 2016 Cau N, et al. This is an open-access article distributed under the terms of the Creative Commons Attribution License, which permits unrestricted use, distribution, and reproduction in any medium, provided the original author and source are credited.
Visit for more related articles at Journal of Novel Physiotherapies
Abstract
Circumferential measurement (CM) for lower limbs volume computation is a simple and accurate method; however, its reliability depends on the operator’s skills. Recent studies support the use of a new technique for an accurate and reliable measurement of body segments based on 3D laser scanner method (LS3D). The detection of the limb volume in obese patients can be tricky, due to the excess of masses that may hamper the identification of anatomical landmarks. In this study, we wanted to compare CM and LS3D in terms of circumferential measures and volumes of lower limbs in normal-weight and in obese subjects. We measured lower limb volumes in 21 female obese and in 11 female healthy subjects with both methods. Our data show statistically significant differences in terms of volume as detected by CM and LS3D. In the comparison between methods, the control group had showed a higher number of parameters statistically different in comparison with the obese. The reason is related to the shape of the limb: whereas in lean subjects the leg shape is anatomically defined, in obese subjects the presence of fat layers masks the anatomical landmarks with the leg shape closely resembling a cone figure. In this latter case, the Frustum formula seems to better approximate the volume. LS3D presents with the advantage of detecting gibbousness and uneven limb shapes, i.e. in patients lymphedema, which can be overlooked by the Frustum formula. Our data suggest that LS3D may represent a suitable tool for clinical applications, especially for pre-post evaluations.
Keywords
Obesity; Volume measurements; Rehabilitation
Introduction
Different measures for lower limbs volume computation are available in clinical setting. These measures can be classified according to the equipment used and the data provided. Water displacement is considered the gold standard for limb volume measurement [1-3]. It is based on the Archimedes principle according to which the water volume moved by an object equals the object’s volume and it provides a direct measure of the limb volume. According to this method, the lower extremity is submerged in a tank of water whose displacement is measured to determine the volume of the leg [4]. Despite its accuracy, this method is not commonly used by clinicians for practical reasons.
The most widely used method in clinical practice is the Circumferential Measurement (CM) using a flexible measure tape. The leg volume is obtained using a indirect method as it is computed using a geometrical approximation (Frustum Formula [5]). The whole leg is divided into sections - usually ten - with each section representing a truncated cone. The final volume is determined by summing up the volumes of the different sections. This method presents with the advantages of being simple, inexpensive and accurate; however, it is operator-dependent and its reliability depends on the operator’s skills [6]. As the formula used for the volume calculation assumes that the leg is approximated to a truncated cone, CM does not capture information regarding leg shape (i.e., gibbousness or localized swelling). Another indirect volumetric method is perometry, which consists of a square-shaped sliding frame surrounding the perimeter of the limb. This frame contains rows of infrared light emitters and sensors on opposite sides. When the leg is placed inside the frame, it interrupts the emitted infrared beam on two planes. This provides two perpendicular diameter measurements of the limb segment. Thus, it is possible to estimate for each measuring point the correspondent diameter and calculate the volume of the limb. Despite its accuracy, this technique has some limitations in terms of costs and usability. In fact, the dimension of the frame is not wide enough to accommodate the leg of extremely large subjects. Another indirect volume measure is the bio-impedance method, which measures the tissue resistance to an electrical current in order to determine extra-cellular fluid volume. When a current is applied to the body through surface electrodes, it is transmitted through water-containing component within the tissues and a value of impedance can be calculated. The latter can be converted into an index score, which reflects volume measurement.
Recent studies support the use of a new technique for an accurate and reliable measurement of body segments based on 3D laser scanner method (LS3D) [7-9]. LS3D usually used in orthopaedics and orthoses design to create three-dimensional models, has been recently tested to measure body volumes. It has the advantages of being fast and non-invasive [10]. Comparison with gold standard (WD) method on upper limb volume measurement [8,9] have already proved good correlations. LS3D has shown to be accurate, reliable, not operator-dependent and able to provide a 3D representation of the limb. Besides this it represents a very good alternative to the WD measurement, which is not suitable for a routinely clinical context. The latter may add clinically useful information by detecting changes in limb shape.
Obesity can result in impaired lymphatic function and lymphedema of the lower limbs is common in obese patients. Oedema typically develops in the lower part of the legs but it may extend to the whole leg. The detection of the limb volume in obese patients can be tricky, due to the excess of masses characterizing these subjects that may hamper the identification of anatomical landmarks. In the literature, no data based on LS3D in obese subjects are present. In this study, we wanted to compare CM and LS3D in terms of circumferential measures and volumes of lower limbs in normal-weight and in obese subjects in order to provide support for the possible use of this method in clinical practice.
Subjects, Materials and Methods
Subjects
We enrolled 16 female obese (age: 61 ± 11 years, height 1.55 ± 0.07 m; weight: 98 ± 18 kg; BMI: 40.5 ± 5.6 kg/m2) patients (OG) who had been admitted to our hospital for a 4-week multidisciplinary rehabilitation program including weight management, physiotherapy, diet, adapted physical activity, nutritional and psychological support, medical supervision. Exclusion criteria were: BMI<30 kg/m2, orthopaedic/neurological conditions that may interfere with the testing position (see Laser scanner measurements). The control group (CG) consisted of 14 female healthy subjects recruited among the hospital staff (age: 28 ± 10 years; height: 1.63 ± 0.04 m; weight: 54 ± 6 kg; BMI: 20.1 ± 1.6 kg/m2). In our study we considered the LS3D as the gold standard due to the previous results reported in previous studies [8,9] and we evaluated the OG and CG using the circumferential method and the LS3D as following described.
Circumferencial measures (CM)
The circumferences of each leg were measured using a normal tape measure (1 mm sensitivity). Measurements were taken with an interval of 5 cm starting from the centre of the patella (0 point) as reported in Figure 1. Three measurements were taken above the knee (+5 point, +10 point and +15 point) while the number of measurements below the patella varied according to the leg length, with the lowest measurement point was above the malleolus.

Figure 1: Measurement points according to the circumferential method (CM).
The lower limb volume was calculated with the Frustum formula [5]
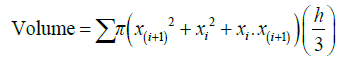
where x(i+1) and xi are the circumferences related to two consecutive sections and h is the interval, expressed in centimetres (h=5 cm). The total lower limb volume is determined by the sum of the volumes of all the sub-sections (Figure 1).
Laser scanner measurements (LS3D)
A hand-held laser scanner 3D system (O&P Scan Rodin4D, Pessac, France, laser peak power 1 mw, wavelength 670 nm, class I laser product) was used. Resolution of this scanner model is 0.1 mm and the absolute accuracy is 0.75. The system consists of a receiver with laser scanner (wand probe), a transmitter and a signal-processing unit. Data were saved and processed using a commercial laptop. To guarantee accuracy during the scanning phase, subjects were asked to stand still, as shown in Figure 2, and maintain this steady posture for the whole measurement duration (2 minutes).

Figure 2: Measurement positions (dotted points) on the lower limb.
As soon as the data were collected, a three-dimensional image was immediately displayed on the computer screen and data stored. The latter were then processed by a dedicate software - Rodin4D (version 5.6, Pessac, France).
Measurements points were the same previously described for CM (Figure 2). To develop the clinical scanning protocol two types of parameters were defined: circumferential measures and volume measures respectively indicated with C and V. As in CM, the same series of linear measures were taken on the leg length with a 5 cm-interval (above and below the centre of the patella 0_C). All sub-volumes related to the circumferential points were defined. The total volume (V_TOT) was calculated from the lowest to the +15_C point (Figure 3).

Figure 3: 3D scanning protocol parameters: 0_C = circumference measurement point at the patella level. V_TOT=total volume, V_SH=Shank volume and V_TH= thigh volume.
Bilateral measurements were performed for each subjects in CG with both methods (CM vs LS3D) and compared, in order to verify possible errors and differences. The same procedure was repeated for OG. The scanner data were used to characterize the OG in term of leg volume and mass distribution (Figure 4).

Figure 4: The work flow of the comparison analysis CM vs LS3D methods in obese and control group.
Statistical analysis
Statistical analysis was conducted using SPSS (version 19.0, SPSS inc., Chicago, IL). The Kolmogorov–Smirnov test was necessary to verify if the parameters were normally distributed. The data were not normally distributed, so Median and Interquartile Range (IQR) were calculated for each parameter. Correlation between CM and LS3D was analysed and the Spearman’s correlation coefficient was calculated. In order to evaluate the Level of Agreement (LOA) between the two methods, a Bland-Altman plot was performed. Statistical differences between CM and LS3D were highlighted using a non-parametric test (Wilcoxon test). A Mann-Whitney U test was used to compare OG and CG.
Null hypothesis was rejected when probabilities were below 0.05 (P<.05).
Results
CM vs LS3D in CG
Figure 5a represents the trend of the total leg volume measures (CM vs LS3D) of CG. Each dot represents the comparison between the two methods (i.e 14 subjects, right and left limb, in total 28 dots). The Spearman coefficients of correlation between volumes determined from CM and LS3D volumes was very high (R2=0.830, P<.05). This indicates a good agreement between the two methods. In Figure 5b, the Bland-Altman plot is displayed. It is a scatter plot of the means of CM and LS3D plotted against the difference between the two methods. This provides a visual representation of the LOA and in particular the difference in volume (V_TOT CM – V_TOT LS3D) determined by the two methods. The horizontal lines represent the mean of the differences, and the mean difference ± 1.96*SD. The average of the differences allows to estimate whether one of the two methods under-or over-estimate the volume measure. The other two lines represent the confidence interval. If the points on the graph fall between the two lines, then the two methods provide consistent results.

Figure 5: Level of agreement between circumferential method (CM) and laser scanner 3D method (LS3D) for CG. a) The trend of the total limb volume measures (CM vs LS3D); b) the bland-altman plot, a scatterplot of the means of CM and LS3D plotted against the differences between the two methods.
The results of the statistical analysis for comparison between CM and LS3D in CG are summarized in Table 1. In terms of circumferential measurements, not all of the parameters were statistically different. Data showed a significant difference at knee level and at the proximal part of the shank. Statistical differences in volumes were found except for three parameters: V-10, V-20, V-258 and V-30. The total volume was statistically different in LS3D and CM. Median total volumes were 4.26 ± 0.81 dm3 and 4.00 ± 0.69 dm3 in CM and LS3D, with a difference of 0.26 dm3 between the two methods(R2=0.830, P<.05).
| Control Group |
|||||
|---|---|---|---|---|---|
| LS3D | CM | ||||
| Unit | Median | QR | Median | QR | |
| V_TOT | dm3 | 4.00* | 0.69 | 4.26 | 0.81 |
| V_SH | dm3 | 2.26* | 0.51 | 2.30 | 0.56 |
| V_TH | dm3 | 1.79* | 0.22 | 1.95 | 0.34 |
| V-35 | dm3 | 0.185* | 0.07 | 0.20 | 0.04 |
| V -30 | dm3 | 0.22 | 0.06 | 0.23 | 0.06 |
| V-25 | dm3 | 0.305 | 0.08 | 0.31 | 0.09 |
| V-20 | dm3 | 0.415 | 0.10 | 0.40 | 0.09 |
| V-15 | dm3 | 0.44* | 0.11 | 0.45 | 0.08 |
| V-10 | dm3 | 0.425 | 0.08 | 0.43 | 0.06 |
| V-5 | dm3 | 0.445* | 0.08 | 0.46 | 0.06 |
| V+5 | dm3 | 0.48* | 0.08 | 0.55 | 0.07 |
| V+10 | dm3 | 0.59* | 0.05 | 0.64 | 0.11 |
| V+15 | dm3 | 0.7* | 0.10 | 0.77 | 0.13 |
| -35_C | cm | 209 | 25.50 | 215.00 | 12.50 |
| -30_C | cm | 218.5 | 28.00 | 220.00 | 30.00 |
| -25_C | cm | 255.5 | 36.50 | 260.00 | 35.00 |
| -20_C | cm | 301.5 | 38.50 | 297.50 | 40.00 |
| -15_C | cm | 334.5* | 31.50 | 335.00 | 35.00 |
| -10_C | cm | 338* | 24.50 | 340.00 | 25.00 |
| -5_C | cm | 327.5* | 25.50 | 325.00 | 20.00 |
| 0_C | cm | 350* | 28.50 | 355.00 | 22.50 |
| +5_C | cm | 379.5 | 24.50 | 385.00 | 30.00 |
| +10_C | cm | 412* | 18.00 | 417.50 | 37.50 |
| +15_C | cm | 461 | 26.50 | 460.00 | 40.00 |
Table 1: Median and quartile range of circumferential and volumetric parameters for the circumferential method (CM) and laser scanner 3D method (LS3D) in the CG.
The same analysis was performed for OG. In Figure 6 the results of the OG are shown. In this figure each dot represents the comparison between the two methods 3DLS and CM (i.e 16 subjects, right and left limb, in total 32 dots). Figure 6a represents the trend of the total leg volume measures (CM vs LS3D) and Figure 6b shows the correspondent Blant-Altman plot. Also for this group, the Spearman coefficient between CM and LS3D total volume was very high (R2=0.928, P<.05).

Figure 6: Level of agreement between circumferential (CM) and laser scanner 3D method (LS3D) for OG. a) Trend of the total limb volume measures (CM vs LS3D); b) the bland-altman plot, a scatter plot of the means of CM and LS3D plotted against the difference between the two methods.
In Table 2, the results of the circumferential and volume parameters (CM vs LS3D methods) for OG are reported. Our data showed that V_SH, V_TH and V_TOT detected by LS3D are statistically different compared to those obtained with CM. In addition, differences in V-5, V+5 and V+10 sub-volumes at the thigh were found.
| Obese Group | |||||
|---|---|---|---|---|---|
| LS3D | CM | ||||
| Unit | Median | QR | Median | QR | |
| V_TOT | dm3 | 5.65* | 1.57 | 5.99 | 1.46 |
| V_SH | dm3 | 3.02* | 0.83 | 3.05 | 0.92 |
| V_TH | dm3 | 2.75* | 0.71 | 3.01 | 0.61 |
| V-35 | dm3 | 0.30 | 0.07 | 0.29 | 0.05 |
| V -30 | dm3 | 0.29 | 0.13 | 0.28 | 0.11 |
| V-25 | dm3 | 0.36 | 0.17 | 0.39 | 0.14 |
| V-20 | dm3 | 0.52 | 0.15 | 0.52 | 0.17 |
| V-15 | dm3 | 0.61 | 0.13 | 0.61 | 0.15 |
| V-10 | dm3 | 0.60 | 0.13 | 0.61 | 0.11 |
| V-5 | dm3 | 0.6* | 0.14 | 0.64 | 0.13 |
| V+5 | dm3 | 0.68* | 0.22 | 0.79 | 0.17 |
| V+10 | dm3 | 0.89* | 0.28 | 0.99 | 0.21 |
| V+15 | dm3 | 1.19 | 0.28 | 1.21 | 0.23 |
| -35_C | cm | 271.5* | 22.50 | 262.50 | 25.00 |
| -30_C | cm | 255.00 | 64.00 | 247.50 | 45.00 |
| -25_C | cm | 284.50 | 71.50 | 277.50 | 65.00 |
| -20_C | cm | 331.50 | 72.50 | 342.50 | 57.50 |
| -15_C | cm | 378.00 | 48.00 | 382.50 | 52.50 |
| -10_C | cm | 398.00 | 34.00 | 400.00 | 42.50 |
| -5_C | cm | 392.5* | 37.50 | 385.00 | 37.50 |
| 0_C | cm | 425* | 42.50 | 425.00 | 42.50 |
| +5_C | cm | 477.00 | 43.50 | 470.00 | 50.00 |
| +10_C | cm | 526.50 | 56.00 | 530.00 | 50.00 |
| +15_C | cm | 585.5* | 83.50 | 577.50 | 52.50 |
Table 2: Median and quartile range of circumferential and volumetric parameters for circumferential method (CM) and laser scanner 3D method (LS3D) in the OG.
The comparison of circumferences and volumes between OG and CG showed that all of the parameters were statistically different between OG and CG using the two methods (CM and LS3D) displaying higher values for OG than CG.
Discussion
In obese patients, lymphatic oedema of the lower limbs is very frequent and is traditionally treated with a range of therapeutic options, from decongestive physiotherapy, manual lymphatic drainage techniques, intermittent pneumatic pressure, specific exercise programs, physical agents, and multi-layered compression with short-stretch bandages, meticulous wound and skin care, training on how to follow precautions and use life-long self-management techniques. The initial intensive phase of the treatment is followed by the maintenance phase consisting of the daily use of standard or individually sized compression garments. Treatment of this chronic condition may become costly in the long term. Optimizing treatment modalities based on an accurate assessment appears an important goal in rehabilitation of lymphedema. It appears therefore of paramount importance to identify an objective and reliable method to quantify volumes of the lower limbs. This may in fact lead to appropriate therapeutic prescriptions and duration of treatments.
Our data show statistically significant differences in terms of volume as detected by CM and LS3D. In a previous similar study on the upper limb [7] this was ascribed to the errors introduced by the frustum formula, since circumferences did not significantly differ between the two methods.
It is interesting to note that in the comparison between CM and LS3D, the CG had showed a higher number of parameters statistically different in comparison with OG; in fact, in CG the 58% of parameters were different respect to 41% in OG.
The reason is related to the shape of the limb: whereas in lean subjects the leg shape is anatomically defined, in OG the presence of fat layers masks the anatomical landmarks with the leg shape closely resembling a cone figure. In this latter case, the Frustum formula seems to better approximate the volume of the leg. LS3D presents with the advantage of detecting gibbousness and uneven limb shapes, i.e. in patients with lipoedema or lymphedema, which can be overlooked by the Frustum formula.
Our data suggest that hand-held laser scanner may represent, due to its facility of use and accuracy in detecting volumes, a suitable tool for clinical applications, especially for pre-post evaluations. This could be even more evident when the presence of localized swelling or gibbousness calls for a detailed limb shape detection. Previous studies have investigated the intra- and inter-operator reliability of a hand-held laser scanner method in determining the volumes of the arms [7].
From our point of view, LS3D could represent an innovative method of measuring the lower limb volume that could be used instead of CM in out-patients. It combines precision, reproducibility, ease of use, and the clinically meaningful extra-value of measuring geometrical information of the limbs that allow to focus and optimize medical treatment of localized conditions.
In conclusion, LS3D seems to provide additional information for the clinicians as compared to the traditional tape measurement. In the future, the development of low cost scanner models may represent a sustainable technology to be implemented in medical facilities.
Acknowledgments
We thank Eng. Simona Mascia for his valuable contribution in data elaboration. This work was supported by Polisocial Award 2012/2013, Politecnico diMilano.
References
- Damstra RJ, Glazenburg EJ, Hop WC (2006) Validation of the inverse water volumetry method: A new gold standard for arm volume measurements. Breast Cancer Res Treat 99: 267-273.
- Mayrovitz HN, Sims N, Hill CJ, Hernandez T, Greenshner A, et al. (2006) Hand volume estimates based on a geometric algorithm in comparison to water displacement. Lymphology 39: 95-103.
- Meijer RS, Rietman JS, Geertzen JH, Bosmans JC, Dijkstra PU (2004) Validity and intra- and interobserver reliability of an indirect volume measurements in patients with upper extremity lymphedema. Lymphology 37: 127-133.
- Brown J (2004) A clinically useful method for evaluating lymphedema. below Clin J Oncol Nurs 8: 35-38.
- Sitzia J (1995) Volume measurement in lymphoedema treatment: examination of formulae. Eur J Cancer Care 4: 11-16.
- Tan CW, Coutts F, Bulley C (2013) Measurement of lower limb volume: agreement between the vertically oriented perometer and a tape measure method. below Physiotherapy 99: 247-251.
- Cau N, Galli M, Cimolin V, Aranci M, Caraceni A, et al. (2016) Comparative study between circumferential method and laser scanner 3D method for the evaluation of arm volume in healthy subjects. J Vasc Surg Venous Lymphat Disord 4: 64-72.
- McKinnon JG, Wong V, Temple WJ, Galbraith C, Ferry P, et al. (2007) Measurement of limb volume: laser scanning versus volume displacement. J Surg Oncol 96: 381-388.
- Mestre S, Veye F, Perez-Martin A, Behar T, Triboulet J, et al. (2014) Validation of lower limb segmental volumetry with hand-held, self-positioning three-dimensional laser scanner against water displacement. J Vasc Surg Venous Lymphat Disord 2: 39-45.
- Harrison JA, Nixon MA, Fright WR, Snape L (2004) Use of hand-held laser scanning in the assessment of facial swelling: a preliminary study. Br J Oral Maxillofac Surg 42: 8-17.
Relevant Topics
- Electrical stimulation
- High Intensity Exercise
- Muscle Movements
- Musculoskeletal Physical Therapy
- Musculoskeletal Physiotherapy
- Neurophysiotherapy
- Neuroplasticity
- Neuropsychiatric drugs
- Physical Activity
- Physical Fitness
- Physical Medicine
- Physical Therapy
- Precision Rehabilitation
- Scapular Mobilization
- Sleep Disorders
- Sports and Physical Activity
- Sports Physical Therapy
Recommended Journals
Article Tools
Article Usage
- Total views: 11622
- [From(publication date):
August-2016 - Dec 18, 2024] - Breakdown by view type
- HTML page views : 10920
- PDF downloads : 702