Research Article Open Access
Chronological Change of the Serum IgA/C3 Ratio Indicates the Efficacy of Tonsillectomy for IgA Nephropathy
Yoshio Shimizu1,2,3*, Takashi Kobayashi2,4, Hitoshi Suzuki2,4, Yusuke Suzuki2,4, Satoshi Horikoshi4 and Yasuhiko Tomino2,41Nephrology Department, Juntendo University, Shizuoka Hospital, Izunokuni, Shizuoka, Japan
2The Clinical Research Project for Intensive Therapy of Chronic Kidney Diseases (CKD), Juntendo University Faculty of Medicine, Japan
3Shizuoka Medical Research Center for Disaster, Juntendo Universit, Japan
4Division of Nephrology, Department of Internal Medicine, Juntendo University Faculty of Medicine, Tokyo, Japan
- Corresponding Author:
- Yoshio Shimizu
Nephrology Department, Juntendo University, Shizuoka Hospital, Izunokuni, Shizuoka, Japan
Tel: +81-55-948-3111
Fax: +81-55-946-0858
E-mail: yosimizu@juntendo.ac.jp
Received Date: October 22, 2016; Accepted Date: November 12, 2016; Published Date: November 16, 2016
Citation: Shimizu Y, Kobayashi T, Suzuki H, Suzuki Y, Horikoshi S, et al. (2016) Chronological Change of the Serum IgA/C3 Ratio Indicates the Efficacy of Tonsillectomy for IgA Nephropathy. J Clin Diagn Res 4:132. doi: 10.4172/2376- 0311.1000132
Copyright: © 2016 Shimizu Y, et al. This is an open-access article distributed under the terms of the Creative Commons Attribution License, which permits unrestricted use, distribution, and reproduction in any medium, provided the original author and source are credited.
Visit for more related articles at JBR Journal of Clinical Diagnosis and Research
Abstract
Background/aims: Although the serum IgA/C3 ratio is a good biomarker to predict the diagnosis, histological findings, and prognosis of IgA nephropathy (IgAN), the chronological change of the IgA/C3 ratio has not been
discussed. The present study evaluates the chronological change of the IgA/C3 ratio.
Methods: The serum IgA/C3 ratio of 43 IgAN patients was measured at the time of biopsy and on the nearest consultation day in an outpatient clinic since April 30th, 2014. The change rate of the serum IgA/C3 ratio (⊿IgA/C3/ year) was calculated. The correlation between ⊿IgA/C3/year and other parameters, including the change rate of serum creatinine (⊿Cr/year), clinical and histological grades, and the risk stratification for end-stage kidney disease (ESKD) in IgAN patients determined by Japanese Society of Nephrology (JSN).
Results: The patients with tonsillectomy had a smaller ⊿IgA/C3/year than those without tonsillectomy. ⊿IgA/C3/ year was positively correlated with ⊿Cr/year. ⊿IgA/C3/year decreased along with the severity of histological grade, clinical grade, and ESKD risk. The patients with a combination of tonsillectomy and steroid pulse therapy show a strong down-regulation of ⊿IgA/C3/year and conserved their renal function. A multiple regression analysis revealed that significant enhancers for ⊿IgA/C3/year are tonsillectomy and ESKD risk grade 3, and that those for ⊿Cr/year are tonsillectomy, steroid therapy, and the clinical grade.
Conclusion: The serum IgA/C3 ratio does not only show the activity of IgAN, but also the chronological change of the IgA/C3 ratio indicates the efficacy of tonsillectomy for IgAN patients.
Keywords
Serum IgA/C3 ratio; Chronological change; IgA nephropathy; Tonsillectomy
Introduction
IgA nephropathy (IgAN) is the most common form of primary glomerulonephritis worldwide [1] and is one of the leading cause of end-stage kidney disease (ESKD) [2]. IgAN is characterized by the presence of polymeric IgA1 deposits in glomerular mesangial areas [3-5]. Since it is necessary to perform a renal biopsy to diagnose IgAN, many efforts have been devoted to developing verified methods to predict IgAN without the biopsy [5-8].
Since it was revealed in 2000 that the patients with a serum IgA/C3 ratio >3.01 have a higher possibility of IgAN [5], the IgA/C3 ratio has been discussed as a useful clinical biomarker to predict the diagnosis, renal histological findings, and prognosis of IgAN [5-7,9-13]. However, there is no report focused on the chronological change of the IgA/C3 ratio.
The Japanese Society of Nephrology (JSN) published clinical guidelines for IgAN in 2011 (3rd version) [14]. The guidelines are based on the data from a multicentre retrospective cohort study [15]. These guidelines indicate new risk stratification for ESKD progression based on clinical histological severity. In these guidelines, IgAN patients are divided into four groups (low, medium, high, ultra-high) according to the possible risk of ESKD in 5 years.
A combined tonsillectomy and steroid pulse therapy for IgAN patients has been uniquely developed and performed in Japan [16-18]. A randomized control trial of the tonsillectomy and steroid pulse therapy showed a significant anti-proteinuric effect during a 1-year follow-up [19].
In the present study, the relationships between the chronological change of the serum IgA/C3 ratio and clinical, histological, and therapeutic factors are evaluated. The usefulness of the serum IgA/ C3 ratio in daily clinical activities for IgAN patients and the close relationships between the chronological change of the IgA/C3 ratio and therapeutic options are revealed.
Patients and Methods
Patients
This study enrolled 43 IgAN patients who underwent renal biopsy in the Juntendo University Hospital and who were continuously treated in the outpatient clinic of the Juntendo University Hospital. The study was conducted according to the Declaration of Helsinki and was approved by the Institutional Review Board of the Juntendo University Hospital. Informed consent was obtained from all patients.
Sample collection
At the time of renal biopsy and the nearest consultation day from April 30th, 2014, all patients provided blood and freshly voided samples. Serum and urine samples were determined in the clinical laboratory center of the Juntendo University Hospital. The level of urinary protein excretion was individually normalized to urinary creatinine (Cr) levels. The estimated glomerular filtration (eGFR) was calculated using the Japanese eGFR equation [19].
Calculation of ⊿IgA/C3/year, ⊿Cr/year, and eGFR/year
The number days between the renal biopsy and the consultation in the outpatient clinic was determined as the observation period and converted to a fraction of a year. The serum IgA/C3 ratio at the time of the renal biopsy and on the consultation day was then calculated. The ⊿IgA/C3/year was obtained using following formula:
⊿IgA/C3/year = (IgA/C3 ratio on the consultation day – IgA/C3 ratio at the time of renal biopsy) / observation period (year) ⊿Cr/year and ⊿eGFR/year were similarly calculated.
Histological analysis
All renal biopsy specimens were evaluated by immunofluorescence, light, and electron microscopy. For light microscopy, paraffin sections were stained with hematoxylin-eosin (HE), periodic acid-Schiff (PAS), and periodic acid methenamine silver-Masson trichrome (PAM-MT). Histological severity was graded according to the JSN histological grading criteria for IgAN patients [14]. The patients who had a percentage of the affected glomeruli of <24.9 % of the total number of glomeruli were classified as histological grade (H-grade) I, 25 to 49.9 % as H-grade II, 50 to 74.9 % as H-grade III, and >75 % as H-grade IV.
Glomerular lesions, including global sclerosis, segmental sclerosis, and crescents (cellular, fibrocellular, and fibrous), were evaluated as affected. The grades were appended with ‘A’ when there were acute lesions, including cellular and fibrocellular crescents, and with ‘C’ when there were chronic lesions, including global sclerosis, segmental sclerosis, and fibrous crescents. When there was observed acute and chronic lesions simultaneously, the grades were supplemented with ‘A/C.’ [14,20,21].
Clinical grading and risk stratification of the progression to end-stage kidney disease (ESKD)
The clinical severity at the time of renal biopsy was determined according to the clinical grading criteria of JSN [14]. Patients with urinary protein excretion <0.5 g/day were graded as clinical grade (C-grade) I, with urinary protein excretion ≥ 0.5 g/day and an eGFR ≥ 0.6 ml/min/1.73 m2 as C-grade II, and with urinary protein ≥ 0.5 g/day and an eGFR<60 ml/min/1.73 m2 as C-grade III. The combination of the H-grade and C-grade of each patient was stratified as low, medium, high, and ultra-high risk (Table 1) [14].
| H-grade I | H-grade II | H-grade III+IV | |
|---|---|---|---|
| C-grade I | Low | Medium | High |
| C-grade II | Medium | Medium | High |
| C-grade III | High | High | Ultra-high |
Table 1: Risk stratification for progression to ESKD based on the clinical and histological severity in the JSN clinical guidelines for IgAN patients.
Statistical analysis
Categorical data were compared by chi-square test and post hoc residual analysis was performed to identify the categories responsible for a significant chi-square statistic. Data are expressed as proportions, mean ± SE as appropriate. Continuous variables are compared using an unpaired t-test or a one-way analysis of variance (ANOVA), as appropriate. Correlate variables are evaluated using the Spearman’s rank correlation coefficient test. A multiple regression analysis was performed to determine the influencing factors for ⊿IgA/C3/year or ⊿Cr/year using the candidate factors extracted in the univariate analyses. Statistical analyses were performed using JMP 10.0 statistical software (SAS Institute, Cary, NC, USA) or Js-STAR (ver. 2.9.9j). A P value<0.05 was considered significant.
Results
Patient characteristics
The mean age of all the subjects at the renal biopsy was 41.7 years. The mean observation period was 6.8 years. During this period, urinary protein excretion and serum creatinine (Cr) levels increased from 1.8 to 2.1g/g Cr and from 1.1 to 2.9 mg/dl, respectively. eGFR and the IgA/ C3 ratio decreased from 64.8 to 50.8 ml/min/1.73 m2 and from 3.4 to 2.6, respectively. Tonsillectomy was performed in 56% of the patients and steroid therapy was adopted in 30% of the patients (Table 2).
| Male (n=26) | Female (n=17) | Total (n=43) | |
|---|---|---|---|
| Age at biopsy (year) | 44.1 ± 3.0 | 38.0 ± 2.7 | 41.7 ± 2.1 |
| Age at outpatient clinic (year) | 51.4 ± 2.7 | 44.0 ± 2.6 | 48.5 ± 2.0 |
| Observation period (year) | 7.2 ± 0.6 | 6.0 ± 0.6 | 6.8 ± 0.4 |
| Urinary protein excretion at biopsy (g/gCr) | 1.7 ± 0.4 | 1.9 ± 0.3 | 1.8 ± 0.3 |
| Urinary protein excretion at outpatient clinic (g/gCr) | 1.6 ± 0.4 | 3.1 ± 1.7 | 2.1 ± 0.7 |
| Serum creatinine at biposy (mg/dL) | 1.2 ± 0.1 | 0.9 ± 0.1 | 1.1 ± 0.1 |
| Serum creatinine at outpatient clinic (mg/dL) | 3.5 ± 0.8 | 2.0 ± 0.8 | 2.9 ± 0.6 |
| eGFR at biopsy (mL/min/1.73㎡) | 65.4 ± 6.3 | 63.9 ± 7.1 | 64.8 ± 4.7 |
| eGFR at outpatient clinic (mL/min/1.73㎡) | 47.1 ± 8.0 | 56.6 ± 8.4 | 50.8 ± 5.8 |
| Serum IgA/C3 ratio at biopsy | 3.7 ± 0.3 | 2.9 ± 0.2 | 3.4 ± 0.2 |
| Serum IgA/C3 ratio at outpatient clinic | 3.0 ± 0.3 | 1.9 ± 0.2 | 2.6 ± 0.2 |
| Tonsillectomy (+/-) | 12/14 | 12/5 | 24/19 |
| Steroid therapy (+/-) | 6/20 | 7/10 | 13/30 |
Table 2: Characteristics of the IgAN patients.
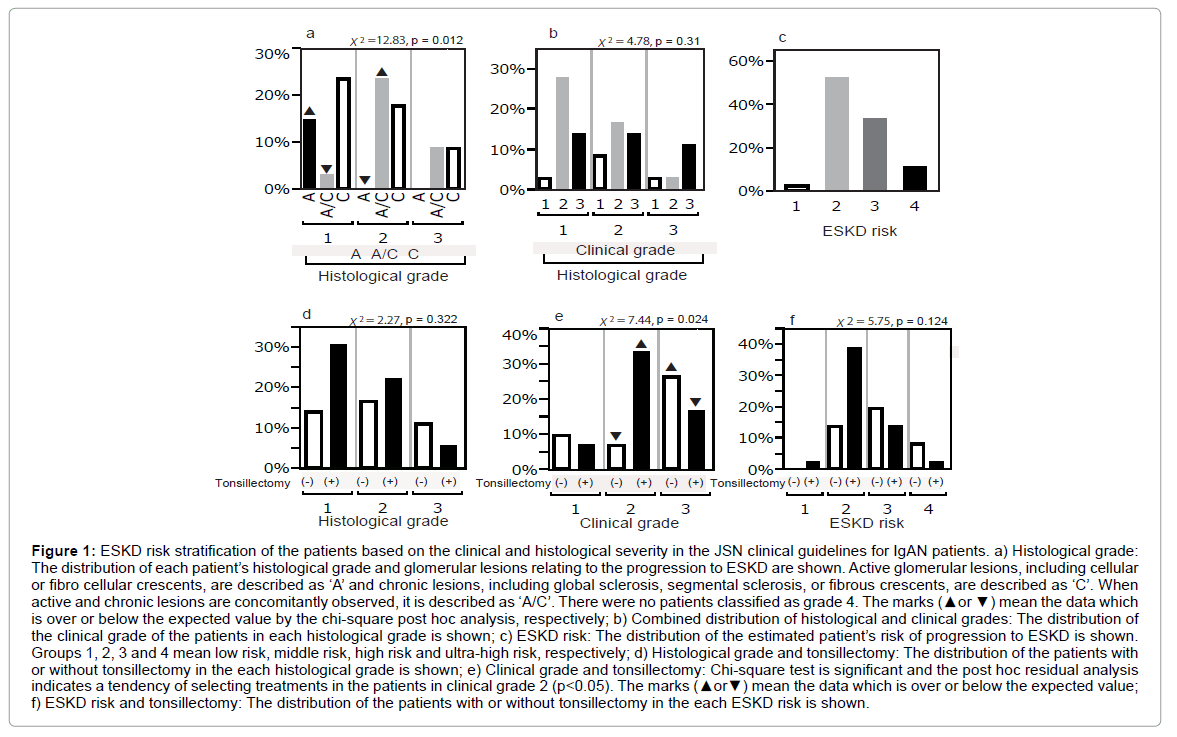
More than two third of the patients were classified into the histological grades 1 and 2. There were no patients in grade 4. While the patients who had dominantly active glomerular lesions were observed in histological grade 1, those with chronic glomerular lesions were distributed in every grade (Figure 1a). The patients with active lesions were significantly more than the expected value and those with active and chronic lesions were less in the histological grade 1. Inversely, those with active lesions significantly reduced and with active and chronic lesions gained in the histological grade 2 (p<0.05, Figure 1a).
Figure 1: ESKD risk stratification of the patients based on the clinical and histological severity in the JSN clinical guidelines for IgAN patients. a) Histological grade: The distribution of each patient’s histological grade and glomerular lesions relating to the progression to ESKD are shown. Active glomerular lesions, including cellular or fibro cellular crescents, are described as ‘A’ and chronic lesions, including global sclerosis, segmental sclerosis, or fibrous crescents, are described as ‘C’. When active and chronic lesions are concomitantly observed, it is described as ‘A/C’. There were no patients classified as grade 4. The marks (▲or ▼) mean the data which is over or below the expected value by the chi-square post hoc analysis, respectively; b) Combined distribution of histological and clinical grades: The distribution of the clinical grade of the patients in each histological grade is shown; c) ESKD risk: The distribution of the estimated patient’s risk of progression to ESKD is shown. Groups 1, 2, 3 and 4 mean low risk, middle risk, high risk and ultra-high risk, respectively; d) Histological grade and tonsillectomy: The distribution of the patients with or without tonsillectomy in the each histological grade is shown; e) Clinical grade and tonsillectomy: Chi-square test is significant and the post hoc residual analysis indicates a tendency of selecting treatments in the patients in clinical grade 2 (p<0.05). The marks (▲or▼) mean the data which is over or below the expected value; f) ESKD risk and tonsillectomy: The distribution of the patients with or without tonsillectomy in the each ESKD risk is shown.
Histological grade did not directly correlate with the clinical grade. The patients with clinical grades 1 and 3 were similarly distributed in all histological grades while those with clinical grade 2 were decreased along with the progression of histological severity (Figure 1b). The distribution of estimated ESKD risk for grade 1 (low risk), 2 (middle risk), 3 (high risk), and 4 (ultra-high risk) was 11%, 53%, 33% and 3%, respectively (Figure 1c). While the distribution of the patients with or without tonsillectomy was not significantly influenced by histological grade or ESKD risk (Figures 1d and 1f), tonsillectomy was selectively performed for the patients in clinical grade 2 and avoided the patients in clinical grade 3 (p<0.05, Figure 1e).
Univariate analysis for ⊿IgA/C3/year
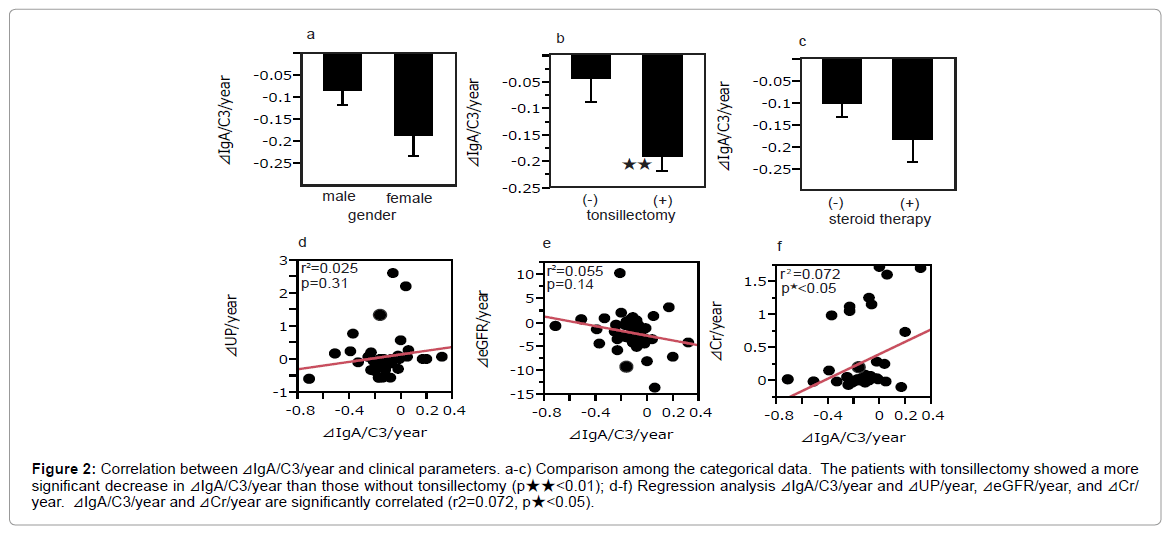
There was no significant difference in the mean ⊿IgA/C3/year between male and female patients (Figure 2a). Patients who had undergone tonsillectomy had a smaller ⊿IgA/C3/year than those without tonsillectomy (-0.19 ± 0.15 vs. -0.05 ± 0.18, p<0.01) (Figure 2b). Patients who had undertaken steroid therapy did not show a significant difference in ⊿IgA/C3/year compared to those without steroid therapy (Figure 2c).
Figure 2: Correlation between ⊿IgA/C3/year and clinical parameters. a-c) Comparison among the categorical data. The patients with tonsillectomy showed a more significant decrease in ⊿IgA/C3/year than those without tonsillectomy (p★★<0.01); d-f) Regression analysis ⊿IgA/C3/year and ⊿UP/year, ⊿eGFR/year, and ⊿Cr/ year. ⊿IgA/C3/year and ⊿Cr/year are significantly correlated (r2=0.072, p★<0.05).
While neither ⊿UP/year nor ⊿eGFR/year significantly correlated with ⊿IgA/C3/year (r2=0.025, p=0.31; r2=0.055, p=0.14, respectively) (Figures 2d and 2e), ⊿Cr/year significantly correlated with ⊿IgA/C3/ year (r2=0.072, p<0.05) (Figure 2f).
⊿IgA/C3/year and histological grades, clinical grades, ESKD risk, and tonsillectomy
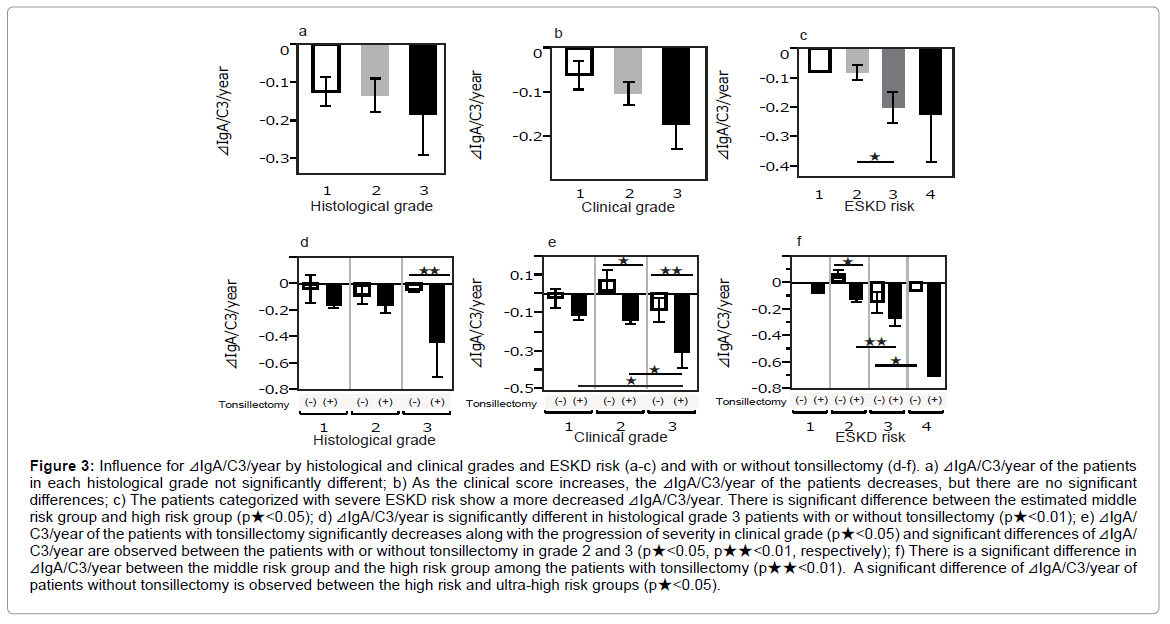
⊿IgA/C3/year tended to decrease along with the severity of the histological grade, clinical grade, and estimated risk for ESKD, and the patients in the high risk group for ESKD showed a significant decrease compared to those in middle risk group (Figures 3a-3c). ⊿IgA/C3/year of the patients with tonsillectomy showed a decrease in the severity in histological grade, clinical grade, and advanced ESKD risk. In contrast, there was no tendency between ⊿IgA/C3/year and these grades in the patients without tonsillectomy (Figures 3d-3f). ⊿IgA/C3/year of the patients in histological grade 3 with tonsillectomy revealed a greater decrease than those without tonsillectomy (p★<0.05) (Figure 3d). While patients in each clinical clinical grade without tonsillectomy showed no significant difference in ⊿IgA/C3/year, significant differences in ⊿IgA/C3/year are observed between clinical grades 1 and 2 in the IgAN patients with tonsillectomy (p★<0.05) (Figure 3e). Patients in clinical grades 2 and 3 show a marked difference with or without tonsillectomy (p★<0.05, p★★<0.01, respectively) (Figure 3e). The patients with tonsillectomy in higher risk for ESKD group reveal a significant reduction of ⊿IgA/C3/year compared to those in middle risk group (p★<0.01) (Figure 3f). While there was a significant difference in ⊿IgA/C3/year between the patients in the high risk group and the ultra-high risk group without tonsillectomy, the value is higher in ultra-high risk group (p<0.05) (Figure 3c).
Figure 3: Influence for ⊿IgA/C3/year by histological and clinical grades and ESKD risk (a-c) and with or without tonsillectomy (d-f). a) ⊿IgA/C3/year of the patients in each histological grade not significantly different; b) As the clinical score increases, the ⊿IgA/C3/year of the patients decreases, but there are no significant differences; c) The patients categorized with severe ESKD risk show a more decreased ⊿IgA/C3/year. There is significant difference between the estimated middle risk group and high risk group (p★<0.05); d) ⊿IgA/C3/year is significantly different in histological grade 3 patients with or without tonsillectomy (p★<0.01); e) ⊿IgA/ C3/year of the patients with tonsillectomy significantly decreases along with the progression of severity in clinical grade (p★<0.05) and significant differences of ⊿IgA/ C3/year are observed between the patients with or without tonsillectomy in grade 2 and 3 (p★<0.05, p★★<0.01, respectively); f) There is a significant difference in ⊿IgA/C3/year between the middle risk group and the high risk group among the patients with tonsillectomy (p★★<0.01). A significant difference of ⊿IgA/C3/year of patients without tonsillectomy is observed between the high risk and ultra-high risk groups (p★<0.05).
⊿Cr/year and histological grades, clinical grades, and ESKD risk
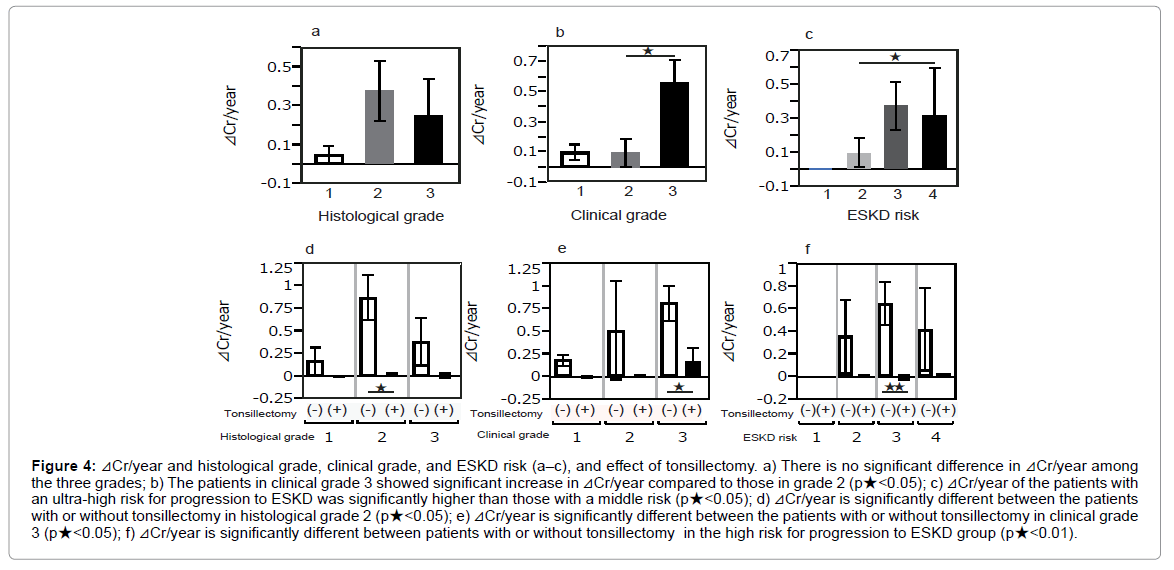
⊿Cr/year is not significantly different among the histological grades (Figure 4a). The patients in grade 3 showed a more significant elevation of ⊿Cr/year than those in grade 2 (p<0.05) (Figure 4b). Similarly, patients with an ultra-high risk for ESKD revealed a significantly higher level of ⊿Cr/year than those with a middle risk for ESKD (p<0.05) (Figure 4c).
Figure 4: ⊿Cr/year and histological grade, clinical grade, and ESKD risk (a–c), and effect of tonsillectomy. a) There is no significant difference in ⊿Cr/year among the three grades; b) The patients in clinical grade 3 showed significant increase in ⊿Cr/year compared to those in grade 2 (p★<0.05); c) ⊿Cr/year of the patients with an ultra-high risk for progression to ESKD was significantly higher than those with a middle risk (p★<0.05); d) ⊿Cr/year is significantly different between the patients with or without tonsillectomy in histological grade 2 (p★<0.05); e) ⊿Cr/year is significantly different between the patients with or without tonsillectomy in clinical grade 3 (p★<0.05); f) ⊿Cr/year is significantly different between patients with or without tonsillectomy in the high risk for progression to ESKD group (p★<0.01).
Comparing patients with or without tonsillectomy, the tonsillectomized patients showed a smaller ⊿Cr/year and a significant difference of ⊿Cr/year among patients in histological grade 2, clinical grade 3, and high risk for ESKD (p<0.05, p<0.05, and p<0.01, respectively) (Figures 4d-4f).
Effects of combination therapy with tonsillectomy and steroid therapy
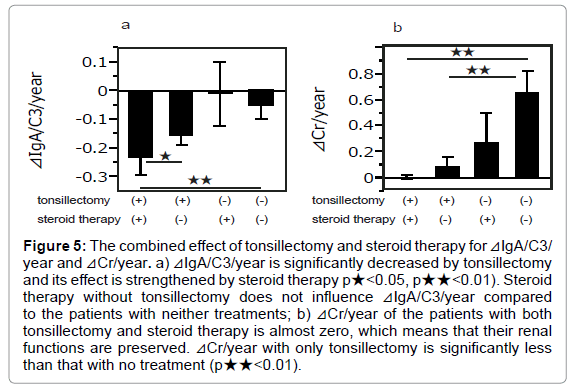
The smallest ⊿IgA/C3/year was observed in patients who had undergone both tonsillectomy and steroid therapy, and it was significantly less than the patients only treated with tonsillectomy and those without treatment (p<0.05, 0.01, respectively) (Figure 5a). ⊿Cr/year was almost 0 in the patients with dual therapies and it was significantly less than in the patients without treatment (p<0.01). The patients who were only treated with tonsillectomy revealed significantly less ⊿Cr/year than those without treatment (p<0.01) (Figure 5b).
Figure 5: The combined effect of tonsillectomy and steroid therapy for ⊿IgA/C3/ year and ⊿Cr/year. a) ⊿IgA/C3/year is significantly decreased by tonsillectomy and its effect is strengthened by steroid therapy p★<0.05, p★★<0.01). Steroid therapy without tonsillectomy does not influence ⊿IgA/C3/year compared to the patients with neither treatments; b) ⊿Cr/year of the patients with both tonsillectomy and steroid therapy is almost zero, which means that their renal functions are preserved. ⊿Cr/year with only tonsillectomy is significantly less than that with no treatment (p★★<0.01).
Multivariate regression analysis for ⊿IgA/C3/year and ⊿Cr/ year
Tonsillectomy and the patients with a high-risk for ESKD are revealed to be significant influencing factors for ⊿IgA/C3/year (p=0.0004 and p<0.05, respectively) (Table 3a). In model 1, for ⊿Cr/ year, tonsillectomy, steroid therapy, and patients with clinical grades 1 or 3 were found to have a significant influence (p=0.008, p<0.05, p<0.05 and p<0.01, respectively) (Table 3b). In model 2, in which ⊿IgA/C3/ year was adopted as a substitute for tonsillectomy, similar results were obtained. IgA/C3/year, steroid therapy, and clinical grades 1 or 3 were found to have a significant influence (p=0.005, p<0.05, p<0.05, and p<0.0001, respectively) (Table 3b).
| a | ||||
| β | SE | t-value | p-value | |
| Intercept | -0.11 | 0.04 | -2.5 | 0.02 |
| Gender (male) | 0.02 | 0.03 | 0.67 | 0.51 |
| Tonsillectomy | 0.12 | 0.03 | 4.05 | 0.0004★★ |
| Steroid therapy | -0.04 | 0.03 | -1.31 | 0.2 |
| ESKD risk grade 1 | 0.2 | 0.11 | 1.76 | 0.09 |
| ESKD risk grade 2 | 0.09 | 0.05 | 1.81 | 0.08 |
| ESKD risk grade 3 | -0.12 | 0.05 | -2.23 | 0.03★ |
| b | ||||
| β | SE | t-value | p-value | |
| Intercept | 0.18 | 0.08 | 2.25 | 0.03★ |
| Tonsillectomy | -0.21 | 0.08 | 2.79 | 0.008★★ |
| Steroid therapy (+) | -0.16 | 0.08 | -2.15 | 0.04★ |
| Clinical grade 1 | -0.28 | 0.12 | -2.34 | 0.02★ |
| Clinical grade 2 | -0.005 | 0.1 | -0.05 | 0.96 |
| Clinical grade 3 | 0.29 | 0.1 | 2.94 | 0.006★★ |
| c | ||||
| β | SE | t-value | p-value | |
| Intercept | 0.14 | 0.08 | 1.74 | 0.09 |
| ⊿IgA/C3/year | 0.59 | 0.2 | 3.03 | 0.005★★ |
| Steroid therapy | -0.19 | 0.07 | -2.56 | 0.015★ |
| Clinical grade 1 | -0.31 | 0.12 | -2.53 | 0.016★ |
| Clinical grade 2 | -0.12 | 0.09 | -1.38 | 0.17 |
| Clinical grade 3 | 0.43 | 0.09 | 4.59 | <0.0001★★ |
Table 3: a) Multivariate regression analysis of influencing determinants for ⊿IgA/ C3/year; b) Multivariate regression analysis of influencing determinants for ⊿Cr/ year; c) Multivariate regression analysis of influencing determinants for ⊿Cr/ year (model 2) ⊿IgA/C3/year is adopted as a possible determinant instead of tonsillectomy. Similar results are obtained.
Discussion
This research focuses on the chronological change of the serum IgA/C3 ratio in IgAN patients and it is shown that ⊿IgA/C3/year significantly correlates to ⊿Cr/year (Figure 2f). This finding means that patients whose serum IgA/C3 ratio increases after diagnosis would tend to see a decline in their renal function. It was reported that the serum IgA/C3 ratio is useful for predicting diagnosis in IgAN and positively correlates to the severity of prognostic grading [6-7,9,13]. According to previous reports and our own findings, it is suggested that the serum IgA/C3 ratio is a good biomarker for the disease activity of IgAN patients.
IgAN is considered as an immune complex disease in which circulating immune complexes (CIC) including IgA1, C3, and IgG deposit in glomeruli [22]. Most of the deposited IgA1 in glomeruli are polymeric and the serum concentration of polymeric IgA1 in IgAN patients is significantly higher than that in healthy controls [5,23]. Furthermore, peripheral lymphoid cells from IgAN patients synthesize significantly more pIgA1 than control subjects by pokeweed mitogen [24]. Clearance kinetics and renal deposition analyses of soluble IgA immune complex revealed that the clearance of monomeric IgA1 immune complexes was more rapid than that of pIgA1 immune complexes and only pIgA1 immune complexes deposited in glomeruli [25]. The complement system is not activated by mIgA, but by pIgA1 [26]. The IgA1-IgG immune complexes in IgAN are composed of IgA1 and the anti-IgA1 IgG autoantibody [27]. Since there is strong opsonizing activity in IgG, these IgA1-IgG immune complexes also activate the complement system [26]. The serum C3 level is lowered by glomerular deposition of pIgA1 or IgA1-IgG immune complexes. It is suggested that serum elevated IgA1 (pIgA1) and lowered C3 induce a sensitivity to IgA/C3 ratio-indicating disease activity of IgAN patients [28].
⊿IgA/C3/year is not significantly different between patients in each histological and clinical grade (Figures 3a and 3b). There is a significant difference in ⊿IgA/C3/year between the middle and high risk groups for the progression to ESKD (Figure 3c). While the histological and clinical grade groups are from cross sectional data at the time of renal biopsy, ESKD risk is estimated based on a cohort study in Japan [15] and this stratification is including a chronological concept as well as ⊿IgA/C3/year. It is suggested that both ⊿IgA/C3/year and ESKD risk are influenced by the treatments.
Since macroscopic hematuria is observed after upper respiratory infection and is driven by stimulating tonsils in IgAN patients, a relationship between tonsillar infection and IgAN has been argued [29]. The tonsil is a mucous lymphatic organ and polymeric IgA1 (secretory IgA1) is secreted on the mucous membrane. A part of this polymeric IgA1 is considered as a nephritogenic IgA1. The plasma cells, which produce nephritogenic pIgA1 may transfer into bone marrow [30]. These plasma cells produce circulating nephritogenic pIgA1 and glomerular depositive CICs are formed. A combined tonsillectomy and steroid pulse therapy has been developed and performed in Japan [16-19]. The objective of this therapy is to decrease plasma cells producing nephritogenic pIgA1 in the tonsils and to prevent the cells from transferring to bone marrow [31].
Among the patient groups of clinical, histological, and ESKD risk, there are significant differences of ⊿IgA/C3/year among patients with or without tonsillectomy (Figures 3d-3f). Moreover, ⊿IgA/ C3/year is significantly down regulated in the patients of the higher clinical grades and ESKD risk (Figures 3e and 3f). Similarly, significant differences of ⊿Cr/year are observed between the patients with or without tonsillectomy (Figures 4d-4f). ⊿Cr/year of the patients with tonsillectomy is suppressed to almost zero (Figures 4d-4f). These finding indicate that tonsillectomy does not only down regulate ⊿IgA/ C3/year, but also inhibits the rise of serum Cr.
It is suggested that steroid therapy has an additive effect on tonsillectomy since there is a significant difference in ⊿IgA/C3/year between the combination of tonsillectomy and steroid therapy, and tonsillectomy alone (Figure 5a). It is difficult to evaluate the effect of steroid mono-therapy for ⊿C3/year because it is significantly suppressed by the combination of tonsillectomy and steroid pulse therapy, and by tonsillectomy alone (Figure 5b).
Tonsillectomy and ESKD risk grade 3 have been indicated as significant enhancers for ⊿IgA/C3/year by a multiple regression analysis (Table 3a). It is suggested that the patients in the higher ESKD risk grade have a higher level of ⊿IgA/C3/year and are more down regulated by tonsillectomy than those in lower risk grades. Tonsillectomy, steroid therapy, and clinical grades 1 and 3 are significant enhancers for ⊿Cr/year (Table 3b). A similar analytic result is obtained when ⊿IgA/C3/year is used instead of tonsillectomy (Table 3c). This phenomenon indicates that the huge impact on ⊿IgA/ C3/year is driven by tonsillectomy. It is interesting that steroid pulse therapy is extracted as significant enhancer for ⊿Cr/year and it may reflect various pharmacological characteristics of steroids, including anti-inflammatory effects as well as the inhibition of producing nephritogenic pIgA1.
Conclusion
The serum IgA/C3 ratio might show the disease activity of IgAN patients at the time of sample collection and it is also suggested that tonsillectomy is effective against IgAN by an analysis of the chronological change of the serum IgA/C3 ratio.
Acknowledgements
The authors are grateful to Mr. Kaoru Sasao for his clerical assistance. This study was supported by a grant in a part by The Clinical Research Project for Intensive Therapy of Chronic Kidney Disease: a collaborative project between Kowa Co. Ltd., Kyowa Hakko Kirin Co. Ltd., Mitsubishi Tanabe Pharma Corporation, and Novartis Pharma, and by JSPS KAKENHI grant number 26461238. Shizuoka Medical Research Center for Disaster, Juntendo University is supported by the MEXT-Supported Program for the Strategic Research Foundation at Private Universities, 2015-2019.
References
- D'Amico G (1987) The commonest glomerulonephritis in the world: IgA nephropathy. Q J Med 64: 709-727.
- Nair R, Walker PD (2006) Is IgA nephropathy the commonest primary glomerulopathy among young adults in the USA? Kidney Int 69: 1455-1458.
- Berger J, Hinglais N (1968) Intercapillary deposits of IgA-IgG. J Urol Nephrol (Paris) 74: 694-695.
- Galla JH. IgA nephropathy (1995) Kidney Int 47: 377-387.
- Tomino Y, Sakai H, Miura M, Endoh M, Nomoto Y (1982) Detection of polymeric IgA in glomeruli from patients with IgA nephropathy. Clin Exp Immunol 49: 419-425.
- Tomino Y, Suzuki S, Imai H, Saito T, Kawamura T, et al. (2000) Measurement of serum IgA and C3 may predict the diagnosis of patients with IgA nephropathy prior to renal biopsy. J Clin Lab Anal 14: 220-223.
- Ishiguro C, Yaguchi Y, Funabiki K, Horikoshi S, Shirato I, et al. (2002) Serum IgA/C3 ratio may predict diagnosis and prognostic grading in patients with IgA nephropathy. Nephron 91: 755-758.
- Maeda A, Gohda T, Funabiki K, Horikoshi S, Shirato I, et al. (2003) Significance of serum IgA levels and serum IgA/C3 ratio in diagnostic analysis of patients with IgA nephropathy. J Clin Lab Anal 17: 73-76.
- Yanagawa H, Suzuki H, Suzuki Y, Kiryluk K, Gharavi AG, et al. (2014) A panel of serum biomarkers differentiates IgA nephropathy from other renal diseases. PLoS One.
- Nakayama K, Ohsawa I, Maeda-Ohtani A, Murakoshi M, Horikoshi S, et al. (2008) Prediction of diagnosis of immunoglobulin A nephropathy prior to renal biopsy and correlation with urinary sediment findings and prognostic grading. J Clin Lab Anal 22: 114-118.
- Komatsu H, Fujimoto S, Hara S, Sato Y, Yamada K et al.(2004) Relationship between serum IgA/C3 ratio and progression of IgA nephropathy. See comment in PubMed Commons belowIntern Med 43: 1023-1028.
- Zhang J, Wang C, Tang Y, Peng H, Ye ZC, et al. (2013) Serum immunoglobulin A/C3 ratio predicts progression of immunoglobulin A nephropathy. Nephrology (Carlton) 18: 125-131.
- Mizerska-Wasiak M1, Małdyk J, Rybi-Szumińska A, Wasilewska A, Miklaszewska M, et al. (2015) Relationship between serum IgA/C3 ratio and severity of histological lesions using the Oxford classification in children with IgA nephropathy. Pediatr Nephrol 30: 1113-1120.
- Matsuo S (2011) Clinical guides for immunoglobulin A (IgA) nephropathy in Japan, Third version. Jpn J Nephrol 53: 123-135.
- Kawamura T, Joh K, Okonogi H, Koike K, Utsunomiya Y, et al. (2013) A histologic classification of IgA nephropathy for predicting long-term prognosis: emphasis on end-stage renal disease. J Nephrol 26: 350-357.
- Hotta O, Miyazaki M, Furuta T, Tomioka S, Chiba S, et al. (2001) Tonsillectomy and steroid pulse therapy significantly impact on clinical remission in patients with IgA nephropathy. Am J Kidney Dis 38: 736-743.
- Xie Y, Nishi S, Ueno M, Imai N, Sakatsume M, et al. (2003) The efficacy of tonsillectomy on long-term renal survival in patients with IgA nephropathy. Kidney Int 63: 1861-1867.
- Matsuzaki K, Suzuki Y, Nakata J, Sakamoto N, Horikoshi S, et al. (2013) Nationwide survey on current treatments for IgA nephropathy in Japan. Clin Exp Nephrol 17: 827-833.
- Kawamura T, Yoshimura M, Miyazaki Y, Okamoto H, Kimura K, et al. (2014) A multicenter randomized controlled trial of tonsillectomy combined with steroid pulse therapy in patients with immunoglobulin A nephropathy. Nephrol Dial Transplant 29: 1546-1553.
- Matsuo S, Imai E, Horio M, Yasuda Y, Tomita K, et al. (2009) Revised equations for estimated GFR from serum creatinine in Japan. Am J Kidney Dis 53: 982-992.
- Nagayama Y, Nishiwaki H, Hasegawa T, Komukai D, Kawashima E, et al. (2011) Impact of the new risk stratification in the 2011 Japanese Society of Nephrology clinical guidelines for IgA nephropathy on incidence of early clinical remission with tonsillectomy plus steroid pulse therapy. Clin Exp Nephrol 19: 646-652.
- Suzuki H, Kiryluk K, Novak J, Moldoveanu Z, Herr AB, et al. (2011) The pathophysiology of IgA nephropathy. J Am Soc Nephrol 22: 1795-1803.
- Trascasa ML, Egido J, Sancho J, Hernando L (1980) IgA glomerulonephritis (Berger's disease): evidence of high serum levels of polymeric IgA. Clin Exp Immunol 42: 247-254.
- Egido J, Blasco R, Sancho J, Lozano L, Sanchez-Crespo M, et al. (1982) Increased rates of polymeric IgA synthesis by circulating lymphoid cells in IgA mesangial glomerulonephritis. Clin Exp Immunol 47: 309-316.
- Rifai A, Millard K (1985) Glomerular deposition of immune complexes prepared with monomeric or polymeric IgA. Clin Exp Immunol 60: 363-368.
- Daha MR, van Kooten C (2016) Role of complement in IgA nephropathy. J Nephrol 29: 1-4.
- Novak J, Renfrow MB, Gharavi AG, Julian BA (2013) Pathogenesis of immunoglobulin A nephropathy. Curr Opin Nephrol Hypertens 22: 287-294.
- Satake K, Shimizu Y, Sasaki Y, Yanagawa H, Suzuki H, et al. (2014) Serum under-O-glycosylated IgA1 level is not correlated with glomerular IgA deposition based upon heterogeneity in the composition of immune complexes in IgA nephropathy. BMC Nephrol 15: 89.
- Yamabe H, Ohsawa H, Inuma H, Miyata M, Sasaki T, et al. (1994) Worse urinary findings after stimulating tonsils in patients with IgA nephropathy. Nephron 66: 115-116.
- Suzuki Y, Tomino Y (2008) Potential immunopathogenic role of the mucosa-bone marrow axis in IgA nephropathy: insights from animal models. Semin Nephrol 28: 66-77.
- Suzuki Y, Suzuki H, Nakata J, Sato D, Kajiyama T, et al. (2011) Pathological role of tonsillar B cells in IgA nephropathy. Clin Dev Immunol 2011: 1-8.
Relevant Topics
- Back Pain Diagnosis
- Cardiovascular Diagnosis
- Clinical Diagnosis
- Clinical Echocardiography
- COPD Diagnosis
- Diabetes Diagnosis
- Diagnosis Methods
- Diagnosis of cancer
- Diagnosis of CNS
- Diagnosis of Diabetes
- Diagnostic Products
- Diagnostics Market Analysis
- Heart diagnosis
- Immuno Diagnosis
- Infertility Diagnosis
- Medical Diagnostic Tools
- Preimplementation Genetic Diagnosis
- Prenatal Diagnostics
- Ultrasonography
Recommended Journals
Article Tools
Article Usage
- Total views: 4013
- [From(publication date):
December-2016 - Apr 02, 2025] - Breakdown by view type
- HTML page views : 3129
- PDF downloads : 884
