Research Article Open Access
Characterizing University and College Student Employee Injuries: Methods and Challenges
Steven M Thygerson1* and Judy Ou21Department of Health Science, College of Life Sciences, Brigham Young University, USA
2Department of Environmental Health, Boston University, USA
- *Corresponding Author:
- Steven M. Thygerson
Brigham Young University
Department of Health Science
229C Richards Building
Provo, UT 84602, USA
Tel: 801-422-1891
Fax: 801-422-0273
E-mail: steven.thygerson@byu.edu
Received date: May 22, 2013; Accepted date: July 03, 2013; Published date: July 05, 2013
Citation:Thygerson SM, Ou J (2013) Characterizing University and College Student Employee Injuries: Methods and Challenges. Occup Med Health Aff 1:121. doi: 10.4172/2329-6879.1000121
Copyright: © 2013 Thygerson SM, et al. This is an open-access article distributed under the terms of the Creative Commons Attribution License, which permits unrestricted use, distribution, and reproduction in any medium, provided the original author and source are credited.
Visit for more related articles at Occupational Medicine & Health Affairs
Abstract
The purpose of this study was to characterize occupational injuries among university and college student employees. Participants: Undergraduate and graduate students employed at a large university who filed a workers’ compensation claim between 2005 and 2008. Methods: A total of 1,210 university student employee claims were analyzed. Frequencies and rates were calculated to obtain information about injuries, such as the specific part of body, the specific nature of injury, the general part of body, the general nature of injury, and costs. Results: Frequencies of injury were higher during the spring/summer term. Injury rates during the spring/ summer term were more than twice the general industry national average. Student employees aged 22 to 23 years filed twice as many claims as 18 to 19 year old student employees. Conclusions: Interventions, such as cut and puncture injury prevention programs, should be implemented at colleges and universities to control for student employee injuries, especially during spring/summer terms. Impact on industry: College and university administrators, healthcare professionals and safety personnel should develop uniform methods of tracking college and university student employee injuries in order to develop programs aimed at preventing injuries and illnesses to this unique population of workers.
Keywords
Student employees; Injuries; Occupational health and safety
Introduction
Many colleges and universities in the United States employ students to conduct a wide variety of work. Clerical work, custodial work, and grounds and maintenance work are a few types of jobs that expose students to workplace hazards every day. The quantity and quality of training that college and university student employees receive vary by institution. Students in one university may receive less safety related training compared to full-time employees at the same institution. Students who work hard at school and also work hard on the job may be more vulnerable to work-related injuries. The National Institute for Occupational Safety and Health (NIOSH) estimated that 18 and 19 year old students have twice the risk for work-related injuries than adults doing the same work [1]. Students that work as employees of colleges and universities may be at risk for injuries due to exhaustion, poor work habits, insufficient training, and inattentiveness. These issues are consistent causal factors of work-related injuries among young workers.
Occupational injuries associated with university student employees have not been studied in detail. Little is known about the frequency, rate, and types of injuries sustained by the working university student population. The American College Health Association documents university student health indicators through the Healthy College program; Injury and Violence is a category listed under Healthy College 2010 [2]. However, baseline estimates for university student employee injuries have not been established.
Although injury rates have not been well documented, information has been obtained about the prevalence of working university students. In 1998, 79% of undergraduate students identified themselves as being employed either through their universities or other organizations; 73% of the undergraduates who worked were under the age of 24 [3].
The Bureau of Labor Statistics identified the age group 16-24 as the working group associated with full-time student status [4]. The rate of occupational injury for adolescents, ranging from 14 to 19, in this age group has been studied. Injury rates for these young employees are typically higher than their adult counterparts and injuries sustained are usually more serious in nature [5-7].
Identifying the injury rate in the university student population is important both to students and employers. The National Center for Education Statistics projects a twelve percent increase in the number of undergraduate students between 2007 and 2018. Of the projected increases, nine percent of the increases are expected to come from students between the ages of 18 and 24 years [8]. College tuition costs are also expected to increase, which is reflected in the increasing number of students that spend part of their time in the workforce to help pay for tuition and living costs [9-12]. This trend of increasing employment in undergraduate students was first noted in 1960 [13].
Determining the rate of employee injury can also be valuable to universities because workers’ compensation claims and insurance can be costly. In 2002, employers in the United States paid a total of $72.9 billion in workers’ compensation premiums, with indirect and direct costs ranging between $128 billion and $155 billion [14].
Calculating rates and finding documentation of student injuries can be challenging. This paper uses university workers compensation records to characterize student employee injuries and describe challenges that universities may face when trying to identify the injury rate in their student employee population.
Methods
Data collection and analysis
Data were obtained from a university in the United States that employs a large number of students. The university hires over 30,000 students every year, making it one of the nation’s largest employers of university students (Student employment director, personal communication, May, 2010). The university is self-insured, and extends its workers compensation fund to all employed students. Data obtained originated from workers’ compensation records, department injury records, and the human resource department. The data from the years 2005 to 2008 was extracted and analyzed using Statistical Analysis Software (SAS). Frequencies were run using the data to obtain information about injuries, such as the specific part of body, the specific nature of injury, the general part of body, the general nature of injury, and the cost of each workers’ compensation claim. Information from the department records included the cost of the injury and the department in which the injuries originated. This study received Institutional Review Board approval from the authors’ academic institution.
Occupational Safety and Health Administration (OSHA) Incidence Rate
Injury and illness rates were calculated using the OSHA injury and illness incidence rate equation:
Rate per 100 full-time equivalent (FTE) employees = (Total # of injuries and illnesses × (200,000 hours per 100 employees)) / (Total number of hours worked)
The total number of injuries and illnesses were obtained from the workers’ compensation records. The total number of hours worked was found using the university’s existing hour cap policy for all student employees (Table 1).
| Year | School Term | Claims | Total Hired | Max. Hours Worked Per Employee Per Term | Max. Number of Hours Worked Per Term by all Employees |
| 2005 | Fall | 83 | 11,935 | 330 | 3,938,550 |
| Spring/Summer | 124 | 7,961 | 340 | 2,706,740 | |
| Winter | 98 | 12,301 | 330 | 4,059,330 | |
| 2006 | Fall | 102 | 12,159 | 330 | 4,012,470 |
| Spring/Summer | 140 | 7949 | 340 | 2,702,660 | |
| Winter | 88 | 12,424 | 330 | 4,099,920 | |
| 2007 | Fall | 86 | 12,095 | 330 | 3,991,350 |
| Spring/Summer | 124 | 7841 | 340 | 2,665,940 | |
| Winter | 95 | 11,923 | 330 | 3,934,590 | |
| 2008 | Fall | 86 | 12,477 | 330 | 4,117,410 |
| Spring/Summer | 106 | 8067 | 340 | 2,742,780 | |
| Winter | 77 | 12,884 | 330 | 4,251,720 |
Table 1: Workers’ Compensation Claims and Hours Worked by Student Employees.
Results
A total of 117,714 students were hired between 2005 and 2008 at the university. Although the school hired a large number of student employees, the university also experienced a high turnover rate, and the duration of student employment averaged 6 weeks. The university calendar is divided into four terms. The fall and winter terms are each sixteen weeks long, lasting from September to December and from January to April, respectively. The spring and summer terms are six weeks long, lasting from May to mid-June, and from mid-June through late August, respectively. The average number of students hired by the university each fall and winter term was 12,118 in 2005; 12,291 in 2006; 12,009 in 2007; and 12,680 in 2008. The average number of student employees for the combined spring/summer term was 7,961 in 2005; 7949 in 2006; 7,841 in 2007; and 8,067 in 2008.
The number of claims was greater during the spring and summer terms than the fall and winter semesters. A total of 494 claims were filed during the spring/summer term, while 359 claims were filed during the fall semester, and 357 claims were filed during the winter semester.
Female students filed 607 claims, while male students filed 601 claims. The number of female and male students that worked on campus in past years was not available information. However, this university’s population is unique because many of the males aged 19 to 21 are not present at the university due to voluntary missionary service.
The ages of students that filed workers’ compensation claims ranged from 16 to 59. The average age of students filing workers’ compensation claims was 23 years. The majority of the population that filed workers compensation claims was between 18 and 27 years of age. Older students filed more claims than younger students. Ten percent of the claims were filed by students aged 23 years, and thirteen percent of the claims were filed by students aged 22. Students aged 18 only filed 4.93 percent of the claims, and 19 year old students filed 8.6 percent of the claims (Figure 1).
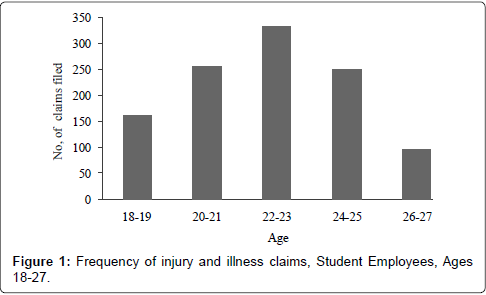
Figure 1: Frequency of injury and illness claims, Student Employees, Ages 18-27.
Student Injuries
The three most common student employee injuries were cuts/ lacerations/punctures, strains and sprains, and bruises. Over the four year period, cuts and lacerations were the most common injuries found on campus. Under the category of cuts, lacerations, and punctures, 355 claims were filed. Strains and sprains were the second most common type of injury with 286 claims. Bruises were the third most common type of injury with 223 claims (Figure 2).
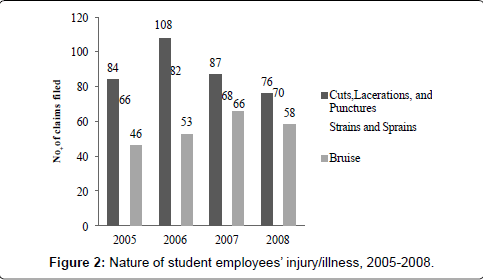
Figure 2: Nature of student employees’ injury/illness, 2005-2008.
The most common causes of injury were cuts/punctures, followed by lifting, and caught in between (Figure 3).
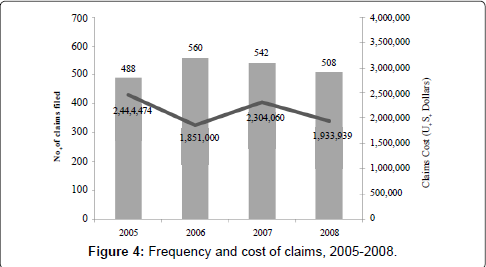
Figure 3: Cause of Injury or Illness, By Year, 2005-2008.
The records filed by university department showed the cost of injuries and the department in which injuries took place. A total of 2,098 injuries were filed with the various university departments. The disparity in the number of claims filed with workers’ compensation and the actual department claims could be due to differences in reporting protocol. Of these department claims, 1,424 required payment from the university’s workers’ compensation system. The lowest amount paid to a student for an injury was $4.00. The highest amount paid over the four year period between 2005 and 2008 was $140,414.66 (Figure 4).
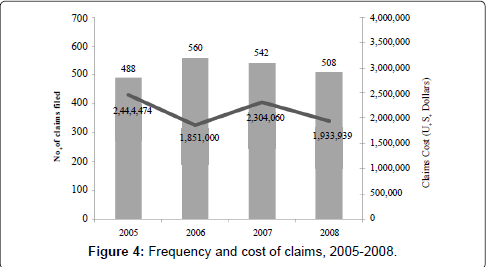
Figure 4: Frequency and cost of claims, 2005-2008.
The departments with the most frequent injuries over the four year period were Building Maintenance, Dining Services, and Grounds Maintenance. Although these departments had the most frequent claims, these three departments also hire a large number of students. It was not possible to get the number of hours worked since the record system does not search for historical data by department.
Injury rates were difficult to determine for this population due to the limitations in recordkeeping. Although researchers were able to find information about previously filed claims, there were no records available that had information about the total number of student employees, and information about the total number of hours worked for students was not available. However, the university does have a policy that states that all on campus employees are not allowed to work more than 20 hours a week if they are enrolled in school. By using the 20 hour work week as a baseline, it was possible to estimate the minimum injury rate for the student employee population. The Occupational Safety and Health Administration incidence rate equation was used to report injury rates by school term (Table 2). The rate by school term was used instead of the yearly rate because of the high turnover rate.
| Year | Terms | OSHA Incidence Rate |
| 2005 | Fall and Winter | 2.3 |
| Spring and Summer | 9.2 | |
| 2006 | Fall and Winter | 2.3 |
| Spring and Summer | 10.4 | |
| 2007 | Fall and Winter | 2.3 |
| Spring and Summer | 9.3 | |
| 2008 | Fall and Winter | 1.9 |
| Spring and Summer | 7.7 |
Table 2: OSHA Incidence Rate by Terms.
The 2008 OSHA rate for nonfatal workplace injuries and illnesses among all industries was 4.0 cases per 100 equivalent full-time employees (FTE) [15]. The student employees working during the fall and winter terms sustained an injury rate that was much lower than the national private industry average (1.9 vs. 4.0). However, the university student injury rate was much higher during the spring/summer term (7.7 vs. 4.0).
The most common injuries were caused by students being cut or punctured by objects in the work environment (48%). Another 8% were cut by hand-tools, and another 8% were injured by struck by an object handled incidents. Of the claims filed for strains and sprains, 27% of them were caused by lifting, 11% were caused by repetitive motion, 5% were caused by twisting/turning, and 5% were caused by strains/ overexertion. Bruises, the third most common nature of injury, were caused by object handling (17%), falling/flying objects (13%), caught in-between (10%), and stationary objects (10%).
Discussion
There were several challenges when trying to identify workers’ compensation claims associated with just the student employees hired by the university. The workers’ compensation records obtained only contained records about the claims filed. There was little data available about the non-injured population. Information about the gender, age, and department in which the non-injured student population worked were not available. The university’s data system could not query the database for historical data about the non-injured population, which severely limited the types of studies that the researchers were able to do. Additionally, there was not a way to determine the exact number of hours that students worked during the years 2005 to 2008. The payroll office also did not have a way to determine the number of hours that student employees worked from the years of 2005 to 2008. Additionally, the records obtained from the human resource department showed the number of students that were hired at some point during the school year, but a high turnover rate (average tenure for student employees is 6 weeks) makes determining the exact number of working students difficult.
The records themselves also show a change over time. The period from 2005 to 2008 showed a more uniform classification system than the years 2001 to 2004 showed. The records from 2001 to 2004 did not differentiate the claims between students and other employee types in a manner that would allow the records to be analyzed.
The high turnover rate also made determining the total number of student employees difficult. The records from the human resource department showed the total number of students that were hired and worked for the university at one point during the semester, but did not show how long each of the employees stayed in their jobs, or their full time equivalents. Additionally, some students are hired as contract employees whose agreements expire at various times. If the student’s contracts expire and the student is rehired under a new position, the student could be counted twice on the records. If the yearly rate was calculated instead of the rate per term, the number of employees that was calculated using the total yearly record could inflate the number of university employees.
Additional challenges in characterizing injuries among university and college student employees include the differences in reporting protocols between departments. Total workers’ compensation claims for university students did not equal the totals that departments reported.
The analysis revealed that the university student employee population decreased by almost 50% during the spring/summer terms. Although the number of students decreased, the number of claims filed during the spring/summer terms almost doubled. This could be due to the nature of the work that takes place during the spring and summer such as construction projects and more gardening projects. These activities may have more risk, which could explain the increased number of claims.
Results showed that the number of male and female employee claims were almost equal. Although the rate of injury for the genders was not available, the fact that the number of claims was almost equal for both genders provides questions about injury rates for future studies.
Students aged 22 to 23 years tended to file more claims than the younger students. This is surprising since NIOSH found that 18 and 19 years older were more likely to be injured than older working adults. The increased number of claims filed by older students implies that inexperience may not contribute as greatly to student employee injuries. The increased number of claims filed by older students could be due to a tendency for experienced employees to be more relaxed towards their work; especially if they have been employed in the same position for a long period of time. More experienced employees also may undertake jobs that involve more risk than new employees.
The relationship between job tenure and rate of injury could not be determined. Past studies on adult populations show that the number of claims filed declines as job tenure increases [16]. However, the findings with the workers’ compensation data show that the older employees filed more claims than younger employees. However, the records did not indicate whether the older employees worked at their positions longer than the younger employees. If the older employees worked at their jobs longer than the younger students, the university student populations may have different behavioral patterns than those identified in studies that dealt with adult job tenure. The finding that older, and perhaps more experienced, students file more injury claims could be attributed to older employees’ desensitization to on-the-job risks. Another possible explanation could be that the older employees take on jobs that involve more risk.
The incidence rate of injury for the university student population during the fall/winter terms (1.9 per 100 FTE) was much lower than the rates during the spring/summer term (7.7 per 100 FTE). The increased rate of injury during the spring/summer terms could be due to the types of work that students perform during the summer months, and could also be due to the lower number of student employees that work during the spring/summer months. The lower number of students, combined with the increased number of construction and gardening types of jobs that students undertake during the spring/summer terms, could place students at increased risk for injuries. To control student injuries, studies suggest that evidence-based and proactive multidisciplinary approaches be used [17,18]. Using workers compensation data should be used to present the evidence where injury prevention interventions should focus.
The limitations to this study make it very difficult to perform any case control or cohort studies. Since the record keeping system does not provide a method to obtain information about the past student populations, there is little information to draw comparisons between the injured and non-injured populations.
The limitations also make it difficult to determine the exact injury rate. Although the university’s policy of a 20-hour maximum work week makes it possible to determine the lowest injury incidence rate, a record with the exact number of hours worked would be more precise. Information about this population’s total number of hours worked could not be found using data from the Current Population Survey.
Conclusion
Characterizing student employee injuries can be challenging due to issues with high employee turnover and recordkeeping. The student injury rate during the spring and summer term is much higher than the national rate for general industry, but the rate during the fall and winter terms is much lower than the national rate. The high rate during the spring and summer terms shows that an intervention is needed to reduce the number of injuries that take place during the spring and summer. Interventions should include a focus on cut, puncture and laceration injury prevention, especially during the spring and summer months. Older students, who also may have longer tenure at the same job, may be at increased risk for injury.
The injury rate is difficult to calculate due to challenges with the university’s recordkeeping and the high employee turnover rate. Colleges and universities who employ students should improve injury record keeping methods in order to understand how to prevent injuries in the student employee population.
By developing a uniform method for injury and illness record keeping among college and university students, hazard controls can be developed that focus on this unique population that is college and university students. University administrators, healthcare professionals and safety personnel can track and develop programs aimed at preventing injuries and illnesses to students that may be different from normal faculty and staff at the college or university.
References
- National Institute for Occupational Safety and Health (NIOSH) (2003)NIOSH alert: Preventing deaths, injuries, and illnesses of young workers.Cincinnati, OH: U.S. Department of Health and Human Services, Public Health Service, Centers for Disease Control and Prevention, DHHS publication no. 2003-128.
- American College Health Association (2004) Healthy Campus 2010: Making it happen. In Task Force on National Health Objectives for 2010 (Ed.), Baltimore: American College Health Association.
- Horn LJ, Malizio A (1998) Undergraduates who work: National postsecondary student aid study, 1996. National Center for Education Statistics, U.S. Department of Education, Office of Educational Research and Improvement Publication No. NCES 98-137. Washington DC: U.S. Government Printing office.
- Bureau of Labor Statistics (2010) Labor force, employment, and unemployment statistics for youth ages 16 to 24 by school enrollment status.
- Belville R, Pollack SH, Godbold JH, Landrigan PJ (1993) Occupational injuries among working adolescents in New York State. JAMA 269: 2754-2759.
- Breslin C, Koehoorn M, Smith P, Manno M (2003) Age related differences in work injuries and permanent impairment: a comparison of workers' compensation claims among adolescents, young adults, and adults. Occup Environ Med 60: e10.
- Miller ME, Kaufman JD (1998) Occupational injuries among adolescents in Washington State, 1988-1991. Am J Ind Med 34: 121-132.
- National Center for Education Statistics (2009) Projections of education statistics to 2018: Enrollment in degree-granting institutions.
- Hexter H (1990) Students who work: A profile. Research Briefs, (ED 381-095). American Council on Education, Division of Policy Analysis and Research. Washington, DC.
- O'Brien EM (1993) Outside the Classroom: Students as Employees, Volunteers, and Interns. (ED 357-672). Washington, DC: American Council on Education, Division of Policy Analysis and Research.
- Orszag J, Orszag P, Whitmore D (2001) Learning and earning: Working in college. Brookline, MA: Upromise.
- The College Board (2002a) Trends in college pricing. Washington, DC.
- Stern D, Nakata Y (1991) Paid employment among U.S. college students: Trends, effects, and possible causes. Journal of Higher Education 62: 25-43.
- Williams CT, Reno VP, Burton JF (2004) Workers' compensation: Benefits, coverage and costs, 2002. Washington, DC: National Academy of Social Insurance.
- Bureau of Labor Statistics (2009) Incidence rate and number of nonfatal occupational injuries by industry and ownership, 2008.
- Breslin FC, Smith P (2006) Trial by fire: a multivariate examination of the relation between job tenure and work injuries. Occup Environ Med 63: 27-32.
- Blair EH, Seo DC, Torabi MR, Kaldahl MA (2004) Safety beliefs and safe behavior among midwestern college students. J Safety Res 35: 131-140.
- Thamrin Y, Pisaniello D, Stewart S (2010) Time trends and predictive factors for safety perceptions among incoming South Australian university students. J Safety Res 41: 59-63.
Relevant Topics
- Child Health Education
- Construction Safety
- Dental Health Education
- Holistic Health Education
- Industrial Hygiene
- Nursing Health Education
- Occupational and Environmental Medicine
- Occupational Dermatitis
- Occupational Disorders
- Occupational Exposures
- Occupational Medicine
- Occupational Physical Therapy
- Occupational Rehabilitation
- Occupational Standards
- Occupational Therapist Practice
- Occupational Therapy
- Occupational Therapy Devices & Market Analysis
- Occupational Toxicology
- Oral Health Education
- Paediatric Occupational Therapy
- Perinatal Mental Health
- Pleural Mesothelioma
- Recreation Therapy
- Sensory Integration Therapy
- Workplace Safety & Stress
- Workplace Safety Culture
Recommended Journals
Article Tools
Article Usage
- Total views: 15572
- [From(publication date):
June-2013 - Apr 16, 2025] - Breakdown by view type
- HTML page views : 10944
- PDF downloads : 4628