Special Issue Article Open Access
Characterization of Fe2O3/FeOOH Catalyzed Solvolytic Liquefaction of Oil Palm Empty Fruit Bunch (EFB) Products
| Sarani Zakaria1*, Tze Khong Liew1, Chin Hua Chia1, Fei Ling Pua1, Fan Suet Pin1, Rasidi Roslan1, Umar Adli Amran1, Antje Potthast2, Thomas Rosenau2 and Falk Liebner2 | |
| 1School of Applied Physics, Faculty of Science and Technology, Universiti Kebangsaan Malaysia (UKM), 43600 UKM, Bangi, Selangor, Malaysia | |
| 2Department of Chemistry, University of Natural Resources and Applied Life Sciences, (BOKU) A-1190, Vienna, Austria | |
| Corresponding Author : | Sarani Zakaria School of Applied Physics, Faculty of Science and Technology Universiti Kebangsaan Malaysia (UKM) 43600 UKM, Bangi, Selangor, Malaysia Tel: +60 3 8921 3261 Fax: +60 3 8921 3777 E-mail: sarani@ukm.my |
| Received: April 09, 2013; Accepted: June 12, 2013; Published: June 14, 2013 | |
| Citation: Zakaria S, Liew TK, Chia CH, Pua FL, Pin FS, et al. (2013) Characterization of Fe2O3/FeOOH Catalyzed Solvolytic Liquefaction of Oil Palm Empty Fruit Bunch (EFB) Products. J Bioremed Biodeg S4:001. doi:10.4172/2155-6199.S4-001 | |
| Copyright: © 2013 Zakaria S, et al. This is an open-access article distributed under the terms of the Creative Commons Attribution License, which permits unrestricted use, distribution, and reproduction in any medium, provided the original author and source are credited. | |
Related article at Pubmed Pubmed  Scholar Google Scholar Google |
|
Visit for more related articles at Journal of Bioremediation & Biodegradation
Abstract
The addition of Fe2O3/FeOOH nanoparticles as a catalyst in solvolytic liquefaction of oil palm empty fruit bunch (EFB) could be cheaper and efficient alternative for biomass industry in Malaysia. Fe2O3/FeOOH can be found naturally in limonite ores and it is cheap, but work efficiently in catalyzing liquefaction. The purpose of this study is to understand the effects on the combination of Fe2O3/FeOOH, as the catalyst in solvolytic liquefaction of EFB. Solvolytic liquefaction of EFB fiber, with and without Fe2O3/FeOOH, was carried out in the nitrogen gas atmosphere using an autoclave. This liquefaction mainly yielded solvolytic oil, n-hexane insoluble preasphaltene and asphaltene phase (PA+A), and solid residue. The presence of catalyst has significantly increased the liquefaction yield and solvolytic oil fraction. Chemical elemental analysis has showed that the products with lower oxygen content are obtained when Fe2O3/FeOOH is used. FT-IR spectroscopy proved that the conversion of the higher molecular compound to the lower molecular compounds with larger number of functional groups has occurred. The analytical Pyrolysis-GCMS revealed the existence of lower molecular weight alcohols, ketones, phenolic and aromatic compounds.
| Keywords |
| Biomass; Catalyst, Empty fruit bunch; Solvolysis; Liquefaction |
| Introduction |
| Oil palm industries in Malaysia generate about 90 million tons of renewable biomass per year. Oil palm biomasses include oil palm trunks, pruned and felled fronds, shells, palm press fiber and Empty Fruit Bunches (EFB). EFB is a suitable renewable biomass material for the conversion into the valuable products, because it is locally abundant and rich in lingo cellulosic components [1]. |
| Biomass can be converted into useful chemicals and liquid fuels via thermo chemical conversion processes, including combustion, gasification, pyrolysis, liquefaction and carbonization. Among them, liquefaction is a promising way to provide either valuable chemicals or liquid fuels [2]. Solvolytic liquefaction has been intensively studied in recent years, as a method that allowed the production of useful polymer precursors or chemicals by chemical treatment of biomass, in the presence of specific organic solvents (media). Depending on both, the type of biomass and the reaction conditions, different products can be obtained [3]. |
| Metallic catalysts are known to be effective additives in direct coal and biomass liquefaction. Previous studies [4-8] showed that the addition of catalysts can greatly improve the conversion rates and yield, and affect the composition of the liquid product. Biomass liquefaction, using Fe2O3 as a catalyst, is a common method to produce liquid fuel and useful chemicals, and also effective in improving the yield of biomass conversion [5,9,10]. FeOOH catalyst was also applied in the coal liquefaction, with high yield of conversion and high catalytic activity observed from previous studies [11,12]. Combination of Fe2O3 and FeOOH catalysts obtained from natural resources of limonite ores for coal liquefaction was studied by Kaneko et al. [13], showed high liquefaction activity and excellent oil yield from the process. |
| This paper reports on the effects of using Fe2O3/FeOOH nanoparticles on the yield and composition of the solvolytic oil obtained from oil palm Empty Fruit Bunches (EFB), through solvolytic liquefaction. Instead of the commonly used phenol, ethylene glycol (EG) was used as a solvent, because it is less harmful [14]. Nanoparticles size of Fe2O3/FeOOH is used to increase the dispersion and optimize the activity of these catalysts [15]. |
| Materials and Methods |
| EFB fiber was supplied by Szetech Engineering Sdn. Bhd. The average fiber size is about 0.8 mm in dimension. The properties of EFB fiber are shown in Table 1. Ferric chloride (FeCl3) and sodium hydroxide (NaOH) were purchased from Sigma-Aldrich and used as received. |
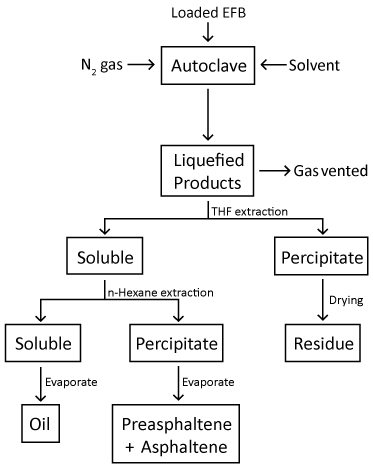
| The loading of the Fe2O3/FeOOH catalyst onto the EFB fibers was accomplished by the in-situ synthesis, as reported earlier [16]. Distilled water (100 ml) were filled into a round bottom flask, heated to 90°C and purged with nitrogen gas. EFB fiber (5 g) was then added into the flask and agitated using mechanical stirrer at 600 rpm. FeCl3 (0.305 g) were added to the suspension, and agitation was continued for another 5 minutes for Fe3+ ions to disperse thoroughly in the suspension. Subsequently, 5.75 ml of an aqueous NaOH solution (0.023 moles) were added to the fiber suspension to form the Fe2O3/FeOOH. After washed with acetone and distilled water, the fiber suspension was filtered and dried at 105°C for 24 hours. EFB and EG (mass ratio of 4:1) were placed into a 200 ml autoclave equipped with stirring and heating systems. After purging with nitrogen gas, the autoclave was then heated to 250°C, followed by a reaction time of 60 minutes. After the reaction completed, the autoclave was allowed to cool down to room temperature. Both liquid and solid products were collected for further analyses. The liquid product was separated into two fractions: Those soluble in THF, but insoluble in n-hexane, are referred to preasphaltene and asphaltene (PA+A), while oil is referred to those which are soluble in both solvents. Oil is later known as solvolytic oil fraction. Figure 1 shows the flowchart of solvolytic liquefaction process carried out in this study. The residue fraction is referred to those which do not dissolved in the solvents. |
| The total conversion and the yield of solvolytic oil, PA+A and residue fractions obtained in the solvolytic liquefaction reaction were calculated according to following equations: |
| X% = (1–Ws/W0)×100% (1) |
| PA+A%=(Wa/W0)×100% (2) |
| O+G%=[X–(PA+A)]×100% (3) |
| where X is total conversion of EFB, O+G is the total yield of solvolytic oil and gas fractions, Ws is the dry weight of residue, Wa is the dry weight of PA+A, and W0 is the dry weight of EFB. |
| C, H, N and S contents of oil products were determined using Thermo Finnigan Eager-300 CHNS analyzer. Oxygen content was estimated based on the difference of C, H, N and S contents of the samples. The HHV of the oil products was then calculated using the Dulong formula developed by Demirbas [17], as followed: |
| HHV (MJ/kg)={33.5[C]+142.3[H]–15.4[O]–14.5[N]}×10-2 (4) |
| The samples for FT-IR were prepared with equal sample weight mix with KBr, to form pellets. The samples were recorded using a Perkin- Elmer FTIR2000 spectrophotometer in the near IR region (4000-370 cm-1). |
| Curie point pyrolysis GC/MS was performed using a Pyromat (GSG Ltd.), coupled with a GC 6890 and MSD 5973 (Agilent Technologies). About 200 μg of the sample had undergone pyrolysis at 600°C (FecralloyTM) for 10 seconds. The pyrolysate was carried by helium into the inlet (250°C, split 1: 20) of the gas chromatograph. Separation was achieved using a fused silica column (DB-5 ms, 30 m, 0.25 mm, 25 μm), a column flow of 0.9 ml min-1, an oven programmed starting with 50°C (5 min), then 5°C min-1 to 280°C (2 min), and an auxiliary temperature of 250°C. The mass spectrometer was operated in EI mode at 70 eV, 230°C, and 1.5×10⁻⁵ Torr. |
| Results and Discussion |
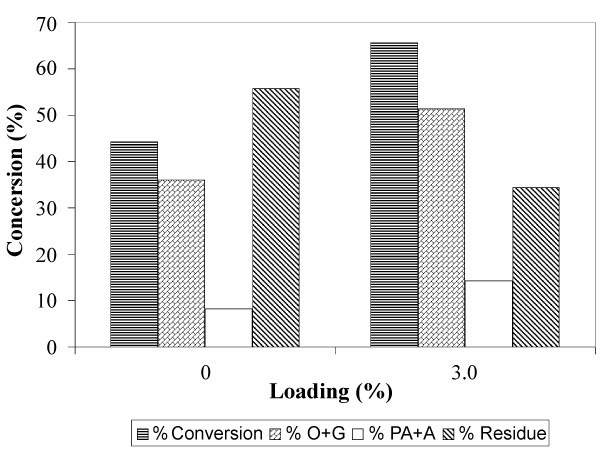
| Figure 2 shows the total conversion and yield of the solvolytic liquefaction of EFB, with and without Fe2O3/FeOOH. As shown in Figure 2, the total conversion of EFB liquefaction increase from 44.26% to 65.58%, when Fe2O3/FeOOH presence in fiber. The same trend can be observed for the yield of O+G. In the presence of catalysts, the yield of O+G obtain is 51.40%. If compared to the sample without catalysts, the yield of O+G is lowered by 15.36%. The yield of PA+A has also increased from 8.22% to 14.18%, in the presence of Fe2O3/FeOOH. From the results, we can conclude that the presence of Fe2O3/FeOOH as catalyst in the solvolytic liquefaction of EFB has significantly enhanced the bond cleavage, cracking and thermal degradation of the fiber. |
| Table 2 shows the results of elemental analysis and the Higher Heating Values (HHV) of different product fractions from both catalytic and non-catalytic liquefaction process. In the absence of catalyst, preasphaltene/asphaltene fraction (PA+A) is found to have the highest carbon and the lowest oxygen content from all product fractions that resulting in the highest HHV value. Meanwhile, solvolytic oil fraction contains the least carbon and highest oxygen. Hence, its HHV value is slightly higher than the residue. This is probably due to the higher content of hydrogen. However, the HHV of these two fractions (solvolytic oil and residue) are very low, because of the unfavorable C/O ratio. The presence of the Fe2O3/FeOOH catalyst during solvolytic liquefaction only resulted to slightly increases of carbon contents and HHV values of these fractions, but has a comparatively strong effect on the PA+A fraction. |
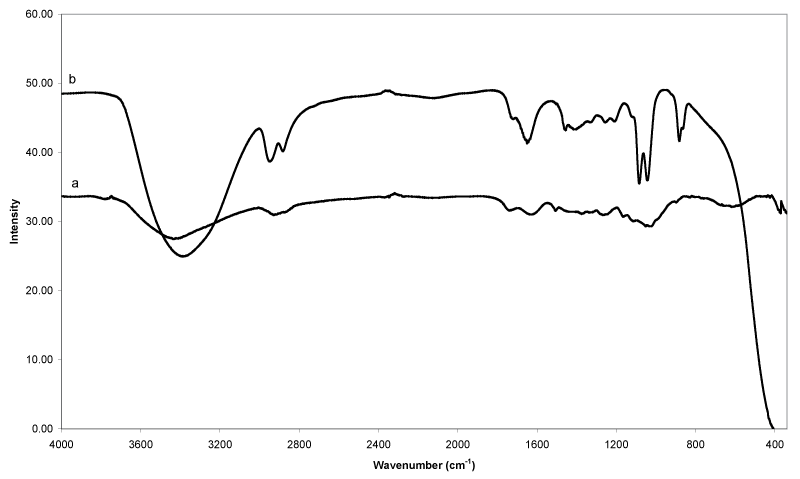
| Figure 3 compares the IR spectra of EFB fiber (a) and the solvolytic oil fraction (b) obtained from catalytic liquefaction using ethylene glycol, as reacting/heat transferring medium. The vibration band pattern of spectrum 3(a) is similar to that of woody biomass [18], and contains typical signals of cellulose, hemicelluloses and lignin. The presence of cellulose is confirmed by the characteristic bands such as O-H stretching (3428 cm-1), C-H2 shearing (1437 cm-1), C-H stretching (1376 cm-1), O-H in-plane bending (1330 cm-1), C-O-C asymmetry stretching (1162 cm-1) and C-O stretching (1050 cm-1 and 1020 cm- 1). Typical signals reducing end group for hemicellulose and cellulose can be found at 1734 cm-1 (carbonyl C=O stretching), 1376 cm-1 (C-H stretching), 1162 cm-1 (C-O-C asymmetry stretching), 1050 cm-1 (C-O stretching) and 1020 cm-1 (C-O stretching). These bands caused by aromatic C=C stretching (1631 cm-1 and 1505 cm-1), C-H2 bending (1437 cm-1), aromatic in-plane C-H deformation (1256 cm-1), and C-H in-plane bending (891 cm-1) are strongly indicative for the presence of lignin in the EFB fibers. Table 3 and 4 summarized the FTIR bands and functional groups assignment of EFB fiber and solvolytic oil fractions, respectively. |
| The IR spectrum of the oil fraction is presented in Figure 3b. The broad stretching band of hydroxyl groups (3600-3200 cm-1) is assumed to be due to the presence of considerable amounts of non reacted ethylene glycol, EG oligomers and EG derivatives, a distinctly increased number of hydroxyl groups in lower molecular compounds obtained from the EFB fibers by thermal hydrocracking, and residual amounts of water (Table 4). The intensity of C-H stretching (3000 to 2800 cm-1) and C-H bending (1465 to 1350 cm-1) bands increase as more alkane groups formed from the liquefaction reaction. The formation of carbonyl compounds (carboxylic acids, ketones and aldehydes, e.g.) due to the decomposition of cellulose and hemicellulose is shown by peaks at 1730 to 1650 cm-1 (increased intensity of C=O stretching). The bands appearing in the range of 1300 to 950 cm-1 can be assigned to C-O stretching and O-H bending, indicating the presence of primary, secondary and tertiary alcohols, phenols, esters and ethers. The sharp signal at 1080 cm-1 and 1040 cm-1 are most likely due to C-O stretching confirming the presence of alcohols and ethers, as they are also detected in the analytical pyrolysis of GC/MS. Furthermore, the appearance of signals that could be clearly attributed to the presence of aromatic (1460 cm-1, 1240 cm-1, 1120 cm-1 and 870 cm-1), and carbonyl groups (1720 cm-1) indicate that the oil fraction contains a certain percentage of lignin derived decomposition products. |
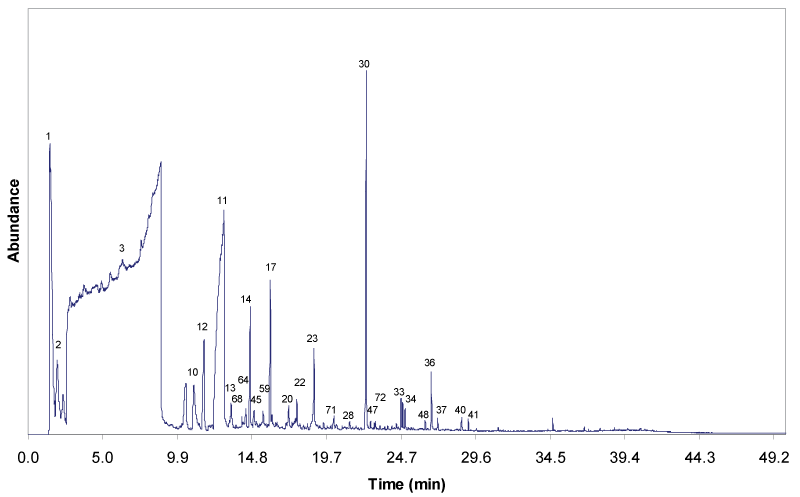
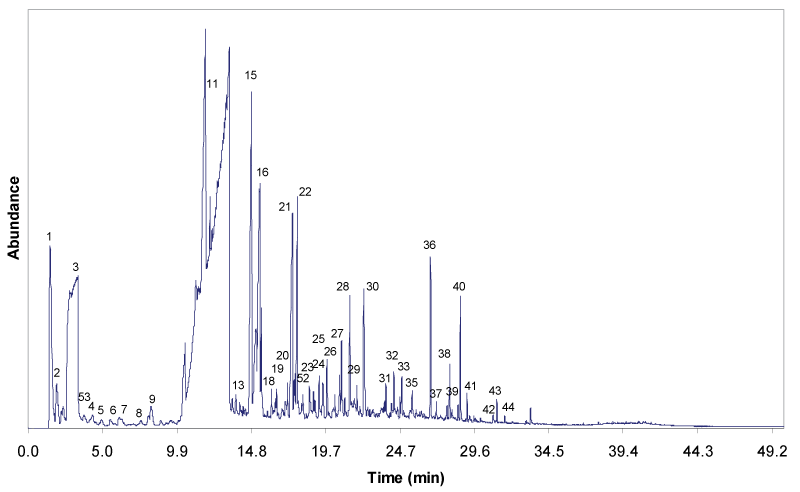
| Figure 4 and 5 show the gas chromatograms of the solvolytic oil fractions obtain through the liquefaction process, with and without Fe2O3/FeOOH nanoparticles, respectively. The pattern and the intensity of the peaks clearly reveal that the composition of both solvolytic oil samples differ significantly. The presence of larger number of compounds is detected in the solvolytic oil fraction that is obtained by catalytic liquefaction. The results show that the presence of catalyst has enhanced the molecular bonds cleavage, and the cracking of EFB fiber into compounds with low molecular weight. The solvolytic oil fraction from non-catalytic liquefaction shows significantly larger amounts of ethylene glycol. In the presence of the Fe2O3/FeOOH nanoparticles, the peaks of EG oligomers (di-, tri-, and tetraethyleneglycol) and EG condensation products with alcohols, phenols and organic acids are detected. Furthermore, in the presence of catalyst, higher amounts of lignin-derived degradation products, namely 4-methyl-, 4-ethyl-, 4-vinyl-, 4-propyl-, 4-(prop-1-enyl)-derivatives of guaiacyl and syringyl formed. Partially, the phenolic lignin decombustion products are found, which correspond to the ethylene glycol ethers (phenol, benzoic acid, guaiacol). A similar trend is observed for the polysaccharide degradation products. Higher yield of polysaccharide degradation products is obtained for that solvolytic oil fraction in the presence of catalyst. The identification of these compounds in the solvolytic oil fractions were determined by GC/MS is listed in Table 5. |
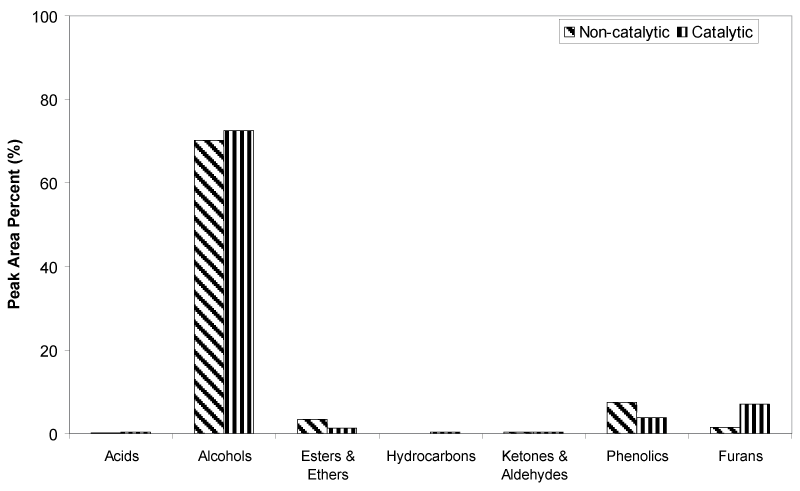
| The percentage of peak area for each identified oil fraction compounds were quantified and distributed based on chemical functional groups, are summarized in Figure 6. Alcohols are the dominant chemical groups in both non-catalytic and catalytic oil fractions, as the total area (%) were 70.17% and 72.48%, respectively. As can be seen in Figure 4 and 5, majority of alcohols group in noncatalytic oil fraction are from ethylene glycol (Peak 3), and small amount of EG derivatives such as di-, tri- and tetra ethylene glycol. Whereas, huge amount of diethylene glycol (Peak 12) was detected in catalytic oil fraction, together with other alcohols group such as ethylene glycol, tri ethylene glycol, tetra ethylene glycol and EG derivatives, and also 3-pentanol and 2-methyl-3-hexanol from holocellulose decomposition. The increase of diethylene glycol compound in catalytic oil fraction showed that the presence of Fe2O3/FeOOH enhanced the reaction between EG molecules through dehydrolysis, releasing free radicals of H+ and OH- for the cracking reaction of polysaccharide materials, as shown in Figure 7. Hence, this has increased the amount of furans group from 1.50% to 7.15%. Small amount of acids, hydrocarbons, ketones and aldehydes are detected in both non-catalytic and catalytic oil fraction. |
| Conclusion |
| The presence of Fe2O3/FeOOH nanoparticles as catalyst in EGbased solvolytic liquefaction of empty fruit bunches significantly increased the yield of both polysaccharide and lignin degradation products in the solvolytic oil fraction at comparatively low temperature (250°C). As the HHV for catalytic liquefaction products were only slightly higher compared to non-catalytic process, further purification and separation of the lower-molecular liquefaction products, such as alcohols, ketones, carboxylic acids, and aromatic compounds (phenol, guaiacyl and syringyl derivatives) would be a good step towards further valorization of the oil fraction. |
| Acknowledgements |
| The authors would like to acknowledge the financial supports given by the Ministry of Science, Technology and Innovation of Malaysia (MOSTI) for e-Science Fund Grant (03-01-02-SF0030), Ministry of Higher Education of Malaysia (MOHE) for Fundamental Research Grant (UKM-ST-07-FGRS-0232-2010), National University of Malaysia (UKM) for Research University Operation Grant (UKMOUP- BTT-29-143/2011), ExxonMobil (M) Research Grant (STGL-012-2008), UKM-DIP-2-12-34 and UKM Outbound Mobility Program. The authors also would like to acknowledge Department of Chemical, University of Natural Resources and Applied Life Sciences (BOKU), Austria for assistance on Py-GC/MS measurements. |
References
|
Tables and Figures at a glance
| Table 1 | Table 2 | Table 3 | Table 4 | Table 5 |
Figures at a glance
 |
 |
 |
 |
| Figure 1 | Figure 2 | Figure 3 | Figure 4 |
 |
 |
 |
|
| Figure 5 | Figure 6 | Figure 7 |
Relevant Topics
- Anaerobic Biodegradation
- Biodegradable Balloons
- Biodegradable Confetti
- Biodegradable Diapers
- Biodegradable Plastics
- Biodegradable Sunscreen
- Biodegradation
- Bioremediation Bacteria
- Bioremediation Oil Spills
- Bioremediation Plants
- Bioremediation Products
- Ex Situ Bioremediation
- Heavy Metal Bioremediation
- In Situ Bioremediation
- Mycoremediation
- Non Biodegradable
- Phytoremediation
- Sewage Water Treatment
- Soil Bioremediation
- Types of Upwelling
- Waste Degredation
- Xenobiotics
Recommended Journals
Article Tools
Article Usage
- Total views: 14443
- [From(publication date):
specialissue-2014 - Apr 02, 2025] - Breakdown by view type
- HTML page views : 9882
- PDF downloads : 4561
