Characterization of Cattle Production Systems in Nyagatare District of Eastern Province, Rwanda
Received: 08-Dec-2016 / Accepted Date: 22-May-2017 / Published Date: 29-May-2017
Abstract
This study was conducted to characterize the cattle production systems in eastern province of Rwanda using pre-tested questionnaires, interviews as well as focus group discussions in a period of six months, despite all the interventions to improve livestock production in Rwanda, there is limited information/data available on the current status of cattle production systems, up-to-date information on challenges affecting the sector. The respondents were selected by multi-stage sampling technique at sector and cell levels, sample size were 360 farms. The result indicated that majority of farms (98.3%) were private owned by big families (five to seven members) and the majority (53.9%) of the farmers had only primary education. Most respondents 189 (52.6%) were in the age range 41-50 years. Most farms (48.3%) were located near trading centers. The farm size averaged 6.5 ± 0.8 arcs and most farms (64.7%) were fenced. Grazing on fenced farms (76%) was the main rearing system except in Rukomo sector (50%) where zero grazing prevailed. Natural pastures savanna grass land was the main feed resource tethering (9%) and communal grazing had diminished. Napier grass was the main planted forage (93.2%), followed by Chloris gayana (3.1%) and Brachiaria (1.2%). Legumes were rarely (2.5%) reported. Vitamin and salt blocks, hay and crop residues were the predominant supplementary feedstuffs. However maize and rice brans were reported to be the main feedstuffs used in supplementary feeding of lactating cows. Most farmers (89.7%) reported shortage of water as most of the farmers trekked their cattle to the nearest valley dam (59.2%), rivers (21.1%) and a few 6% had water on farms. Trypanosomiasis was most reported animal disease in sectors (Karangazi 85%, Rwemiyaga 82.8%). Tick borne diseases were not common rare (24.7%) while viral and mycoplasma diseases were hardly reported. Other methods of diseases control were vaccination, fencing (27.4%). The reported mean age at first calving (AFC) for Ankole cattle was 40.2 ± 0.3 months, calving interval and had the least mean milk yield of 2.4 ± 0.08 L. Higher calf mortality rate was reported. Majority of farmers (90.8%) never kept any records. Indigenous cattle were predominant (60.6%) followed by cross breed 24.8% and exotics 5.4% and all farmers kept small ruminants (goats, sheep, chicken and pigs). Natural breeding predominant (74.9%). In conclusion the main challenges were diseases, lack of breeding facilities, shortages of feeds, water, inadequate extension services. Farmers should adopt artificial insemination, improved pastures and introduce legumes in dairy nutrition, purchase diary meals and vita-mineral blocks for effective supplementation.
Keywords: Cattle rearing; Feeding; Breeding; Diseases; Records; Rwanda
4217Abbreviations
AFC: Age at First Calving; CBPP: Contagious Bovine Pleural Pneumonia; EDPRS: Economic Development and Poverty Reduction Strategy; FAO: Food and Agriculture Organization; Frw: Francs Rwandaise; GDP: Gross Domestic Product; LISP: Livestock Infrastructure Support Program; MINAGRI: Ministry of Agriculture and Animal Resources; MINALOC: Ministry of Local Government; NISR: National Institute of Statistic of Rwanda; OECD: Organization for Economic Co-operation and Development; P.D.M: Project pour le Development du Mutara; PADEBEL: Project d’Appui au Development de l’elevege Bovin laitier au Rwanda; RAB: Rwanda Agricultural Board; SAS: Statistical Analysis System; SPSS: Statistical Package for the Social Sciences; TLU: Tropical Livestock Unit (ruminant) of 250 kg LW); %: Percentage
Introduction
Background
Livestock production has played a major role in the development of countries in Africa [1]. Currently livestock production or husbandry is one of the fastest growing agricultural subsectors in Rwanda; its share of agricultural Gross Domestic Product (GDP) is already 33% in Rwanda and is rapidly increasing [2]. This growth is driven by the rapidly increasing demand for livestock products, which is driven by population growth, urbanization and increasing incomes [3]. As income increases, so does expenditure in livestock products [4].
The Government of Rwanda has acknowledged livestock as an important part in achieving food security for Rwanda, especially in terms of the protein requirements and also its potential role in poverty alleviation [5]. Livestock is one of the key pillars for economic growth, poverty reduction as described in the EDPRS 1 [6]. In the year 2000, the Government of Rwanda launched a development program (Vision 2020) with main objective of transforming the country into a knowledge-based middle-income country. The major agenda were to reduce poverty, health problems, making the nation united and democratic. Modernization of agriculture and livestock production was one of the major strategies of the Vision 2020 [7].
Under this strategy, the livestock sub-sector would be fully modernized by 2020 and Rwanda would be self-sufficient in livestock products with surplus for export particularly milk and dairy products [5]. Emphasis has recently been focused on the replacement of indigenous Ankole cattle with exotic dairy breeds; especially with the Holstein Friesian so as to improve dairy productivity in Rwanda [7]. The cattle population in Rwanda is still dominated by the indigenous long horned Ankole cattle estimated to be 76% of the national herd that are kept extensively [8]. This Ankole breed has an advantage of being highly adapted to adverse environmental conditions, including tolerance to heat stress and tropical diseases [6]. In addition, Ankole cattle can withstand periodic feed shortage better than exotic breeds, as well as walk very long distances in search of pasture and water. The Ankole cattle are also believed to be producing high quality milk and beef [9].
In addition, there has also been a gradual shift from free-range to intensive management practices such as zero-grazing and feed supplementation for improved milk yields [10]. In Rwanda, the major factor associated with low productivity of cattle has often been attributed to poor genetic potential and low standards of husbandry practices (breeding, feeding and housing) [5]. In line with vision 2020 and the Economic Development and Poverty Reduction Strategy (EDPRS 1, 2008-2012) the Government of Rwanda started the policy of cattle distribution aimed at intensification of livestock production systems. The “One cow per poor Family” (Girinka 2006-2017 program, Land consolidation and redistribution, the livestock infrastructure support project, and construction of big water reservoirs (valley dams under PDERCU and PADEBER are some of the major government projects aimed at livestock intensification) [11].
However, there is still a challenge of designing and developing appropriate livestock production systems in such a way that they can contribute to both food security and poverty alleviation, especially in the small-holder sector, without leading to environmental degradation. Currently there is no adequate information characterizing the current status of cattle production including management practices, feed resources, feeding practices, breeds, breed improvement practices, animal health, reproduction, productivity and challenges. This is despite of many years of government support towards transformation of livestock production system over the last decade or so. In such a scenario, it becomes very difficult to plan further interventions. This study therefore aimed at characterization of the cattle production systems in Rwanda using a case of Nyagatare District.
Statement of the problem
Livestock production in Eastern Province of Rwanda has undergone many changes since the genocide of 1994 including large scale losses of livestock due to the war and disease epidemics that followed the influx of herds of livestock with post genocide returnees. Since 2005 there has been degazetting of Akagera National Park to create more livestock grazing areas, land reforms with consolidation and redistribution, and the government policy of reducing local cattle genotypes to about 40% of national herd.
The provision of livestock infrastructure (valley dams and livestock markets, feeder roads, dairy plants, milk collection centers, AI (artificial insemination) services and Girinka were all notable projects towards livestock intensification. However, there was still a great challenge of differences in livestock production and management systems that require different interventions in such a way that they can contribute to both food security and poverty alleviation, especially in the smallholder sector, without leading to environmental degradation [7]. Despite all the interventions to improve livestock production in Rwanda, there is limited information/data available on the current status of cattle production systems. Furthermore, there is also a dearth of up-to-date information on challenges affecting the sector. This study therefore aimed at characterization of cattle production systems in Nyagatare District, Eastern Province of Rwanda.
Objective of the study
General objective: The overall objective of the study was to characterize the cattle production systems in Nyagatare district, eastern province of Rwanda.
Specific objectives:
i. To assess the current cattle husbandry and management practices in Nyagatare district, eastern province of Rwanda.
ii. To determine the prevailing herd structure/composition and production traits of cattle in the district.
iii. To determine the levels of evolution of cattle production systems in the district.
iv. To identify the major challenges and constraints facing cattle farmers in the district.
Research questions
i. What are the current cattle husbandries and management practices in Nyagatare district, eastern province of Rwanda?
ii. What is the prevailing herd structure, composition and production traits of cattle in Nyagatare district, eastern province of Rwanda?
iii. What are the levels of evolution of cattle production systems in Nyagatare district, eastern province of Rwanda?
iv. What are the major challenges and constraints facing cattle production in Nyagatare district, eastern province of Rwanda?
Significance of the study
Rwanda government acknowledges livestock as an important part in achieving food security in her country, especially in terms of the protein requirements and also its potential role in poverty alleviation and is seen as a key pillar for economic growth, poverty reduction as described in the EDPRS 1 [11]. There is no up to date information on the current status of production systems. Detailed information on the status of production systems is required for planning of further interventions to increase production and also useful for gauging the level of progress accruing from the various interventions. The findings have a potential positive contribution towards policy formulation and planning of development interventions in livestock production.
Scope of the study
Nyagatare district was used as case study. It involved qualitative assessment of cattle production systems in the district. The assessment of characterization of production systems was in terms of key variables such as livestock herd structures and composition, management practices, breeding, feeding, health, production and reproduction practices that were currently prevailed during the study period. The study was carried out in a period of six months beginning March 2016 dry season to September 2016 the beginning of wet season.
Literature Review
Cattle production systems
A production system is farming enterprise type consisting of broadly similar resource bases, household livelihood and constraints and for which similar development strategies intervention would be appropriate [12]. The analysis of a farming system encompasses a few dozen or many millions of households [13]. In sub-Saharan Africa as elsewhere, livestock are kept in different production systems, which face varying constraints, possess different potentials for growth and have different resource endowments [14]. Differentiation by production or farming system is a powerful tool for communicating conclusions to policy makers [13]. The common example of cattle production systems includes extensive, semi-intensive and intensive depending on intensity of livestock production.
Classification of cattle production system
Livestock production systems can be classified according to many criteria, the main ones being integration with crop production, the animal-land relationship, agro-ecological zones (AEZ), intensity of production and type of product Steinfeld and Seré 1996. Other criteria include size and value of livestock holdings, distance and duration of animal movement, types and breeds of animals kept, market integration of the livestock enterprise, economic specialization and household dependence on livestock [14]. In Africa, there are many possible classifications of production systems which include the degree of movement as a descriptor: either as nomadic system, transhumant system and sedentary system [14]. The classification of the farming systems of developing regions has commonly based on the criteria like; available natural resource bases including; water, land, grazing areas and forests, climate, landscape including slope, farm size and land tenure which are the important determinates [15]. Description of the productive system is particularly relevant in developing regions where farm animals are kept under diverse production systems and for multiple uses [16]. When characterizing a livestock population and production system in order to inform sustainable utilization of livestock resources, emphasis should be given to farmers’ and pastoralist’ indigenous knowledge that relate to the management of the genetic resources in question. The report of Nakimbugwe and Muchunguzi [17] indicated that there are no clearly set criteria for the delineation of livestock production systems. As a result, little information is available on livestock production systems in the country.
Production and management systems for domestic livestock can be broadly classified as grazing systems, mixed farming systems, extensive system, intensive and semi-intensive system [14]. According to Sere and Steinfeld 1996, pastoral livestock systems are those in which greater than 90% dry matter fed to the livestock in these systems comes from rangelands, pastures, annual forages, purchased feeds and less than 10% of the total value of production comes from non-livestock farming activities. Rwanda agricultural board [18,19] have reviewed and broadly classified livestock production system in Rwanda four categories: extensive production, mixed crop-livestock farming system, intensive and semi-intensive systems.
Extensive production: This system is practiced mainly in eastern province, especially in Nyagatare and Gatsibo districts. Cattle almost get their entire dry mater intake from annual pastures in individual farms, communal grazing lands or crop residues [8]. Annual stocking rates are often higher than the recommended carrying capacity per hectare. On communal areas, land is characterized by overgrazing and development of undesirable plant species. This implies that the present stocking rate per hectare has reached critical levels and may be a serious threat to the environment. Signs of serious environmental damage are apparent due to the high concentration of cattle confined to small areas of land especially near water sources. Spread of cattle diseases is easier because of shared water and grazing areas. Pastoralists in this system keep about 1-15 cows [8].
The government has tried to intervene to reverse this trend through two major development projects. These include PADEBL, which is concerned with all issues of dairy development and funded by the African Development Bank (ADB). Another is PDRCIU, a multipurpose IFAD funded project, dealing with community resources including livestock and infrastructure development, especially provision of water dams at strategic areas.
Mixed crop/livestock systems: This system evolved from the agropastoralist that used to exist when communal grazing lands still existed. The agro-pastoralists system where cattle are grazed on communal lands between cultivated areas has dwindled fast and currently represents about 16% of the national cattle population. Mixed systems can be defined as farming systems conducted by households or by enterprises where crop cultivation and livestock rearing are more or less integrated components of one single farming system. The more integrated systems are characterized by interdependency between crop and livestock activities [20]. A typical example of a more integrated system is that found in Ruhango (southern) and Rubavu (western) districts, and some parts of Kigali peri-urban and Ngoma district. Such systems are basically resource driven aiming at an optimal circulation of locally available nutrients. Part of the time animals may still be tethered on communal areas to eat whatever they can reach. In general, there are more opportunities to mitigate the negative impacts and enhance the positive impacts of livestock on the environment in mixed systems than in specialized systems. Mixed farming systems therefore, offer positive incentives to compensate for environmental effects and are said to be in environmental equilibrium [21].
Crop residues can be used for animal feed, while livestock and livestock by-product production and processing can enhance agricultural productivity by intensifying nutrients that improve soil fertility, reducing the use of chemical fertilizers [22]. The waste products of one component serve as a resource for the other for example, manure is used to enhance crop production; crop residues and by-products feed the animals, supplementing often inadequate feed supplies, thus contributing to improved animal nutrition and productivity [23]. The challenge is to maintain this equilibrium at the same time improving cattle productivity and milk yields through better but appropriate production and feeding technologies.
The cut and carry systems: Defined as systems where feed, crop residues and/ or litter is cut and carried from communal areas and/or other farms to livestock, which are confined, on or close to the farm. The major share of the feed is cut and carried from outside the farm [24]. This system is characterized by land scarcity and housed cattle are fed on fodder cut from riverbanks, roadsides and other areas where green vegetation is abundant including large scale sugar estates (Kamonyi) and tea farms (Rusizi). Besides the cut and carry forage systems under landless conditions mentioned above, zero grazed cattle include those stall-fed on improved grass/legume forages grown on fallow land, back yard plots and forage farms [25]. This system is prevalent and is practiced in Kigali city, Kigali-peri urban, Rusizi, Ruhango and Nyanza, Huye, Rwamagana and Ngoma districts Eastern province. Cultivated forage includes mainly elephant grass (Penissetum purpureum), Guatemala grass (Tripscum luxum) and Setaria spp. Crop residues and fodder resources from the farms are intensively used but are insufficient to meet all feed requirement. External and local concentrates are supplied only occasionally in small amounts, if at all (Ruhango, Kicukiro, Huye and Ngoma). Feeding of concentrates is very common in zero grazed dairy cattle in Kigali city [5].
In rural Rwanda, the cut and carry system is labour intensive and found in densely populated rural areas with a high potential for crop cultivation: such as valleys of hilly areas, areas, surroundings large estates and in urban and peri-urban areas. In the concerned areas, free grazing of cattle is not allowed or is restricted to prevent damage to crops, vegetation on hill slopes and/or planted forests [26]. In general livestock are their main asset and savings account. Through sale of products and services they contribute considerably to household food security and income [27].
Dairy ranching: This system is rarely practiced in Rwanda compared to other countries like Kenya or Uganda mainly due to lack of bigger pasture lands required. A few private farms are found in Eastern province and government farms (Songa and Rubona) in Southern province [2]. This system is less labour intensive and more economical, but lack of large pasture lands makes it an insignificant system in Rwanda [28]. The impact of this systems on the environment will depend on the source of the feed and thus separate systems are described for feed provided by; communal grazing, crop residues, cut and carry processes, produce on farm and external feed [25].
Zero grazing: Zero grazing (intensive systems) are more frequently found in many countries, which have the capital to invest in grain supplies for animals’ feed and supportive technologies such as veterinary care and modern production facilities [28]. The more intensively managed systems cattle are fed rations that are relatively high in concentrate and stored forages (hay and silage paying careful attention to controlling input cost [29,30]. Intensive systems involve high levels of inputs, such as supplemental fortified mixtures of feed, water, disease prevention and require more capital investment such as housing construction and equipment to enhance desired production characteristics, like milk and increased carcass weight [13,31].
In Rwanda, grazing lands are shrinking sharply because crop cultivation is progressively encroaching on grazing areas with increasing human pressure [32]. Therefore, over 60% of households cultivating less than 0.7 ha and owning livestock, practice zero-grazing, where farmers’ cut-and-carry forage and crop residues to feed animals that are kept exclusively under sheds [5]. In general, the main feed for dairy cattle under a zero-grazing system is Napier grass (Pennisetum purpureum) [25]. For more than a decade, efforts to improve the local feed resource base and feeding management have been based on the introduction, characterization and evaluation of exotic forage species, including grasses and legumes [33]. The locally available by-products are gradually replacing more expensive commercial feeds [21]. The livestock revolution is stretching the capacity of existing production, but it is also exacerbating environmental problems at the same time, ways need to be found to preserve the natural resource base [34].
Evolution of cattle production systems
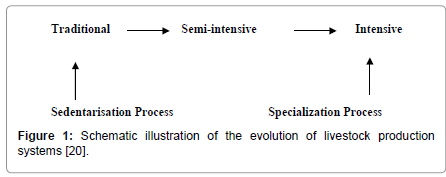
Evolution of livestock production systems has been recently reviewed [35]. It has been observed that evolution influences current trends of livestock production and their future prospects in the world’s diverse [4]. Evolution is also related to the key drivers of change in the global livestock sector and how these influence livestock production systems and their impacts on the management of animal genetic resources for food and agriculture [20]. In the industrialized world, the narrowing animal genetic resource base in industrial livestock production systems raises the need to maintain a broader range of animal genetic resources to be able to deal with future uncertainties, such as climate change and zoonotic diseases. Drivers of change in global livestock systems are shown in Figure 1.
Globalization and economic development: Domestication of livestock started several millennia ago and humans have shaped the genetic make-up of domesticated animals to respond to human needs in different production environments [36]. Since 1945, the world has seen an unprecedented economic growth, starting in the industrialized economies (countries of the Organization for Economic Co-operation and Development [OECD]) and expanding into the world over the past two decades [3,20]. This latter was epitomized by the economic growth path of number of developing countries, mainly in Asia and Latin America, which have undergone major transformations associated with significant growth in their economies and increase in per capita incomes [36]. The contribution of livestock to agricultural gross domestic product (GDP) demonstrate the significance of the livestock sector in many economies (providing value addition); this occurs even in countries that are experiencing rapid economic growth (India and China’) and/or have a growing share of industrial livestock systems (China, Brazil and Argentina) [37].
The trends in foreign direct investment (FD1) shows that increases in FDI are concentrated in few countries (China and India) [37] and these countries are the ones in which the industrialization of livestock production has been rising sharply. Some other countries in Africa such as Kenya and Botswana have also recorded significant increases in FDI over the past decade, although from a lower base [35].
Economic development has led to important changes in the spatial distribution of the world population, leading to a rapid process of urbanization in the developing world [38]. In the industrialized world, population growth rates have declined in the last decades as social security, female employment in labor-scarce economies, cultural/social changes have led to declining birth rates and gradually aging populations [31]. In terms of consumer demand, there is more demand for “fast food” and processed animal products [31]. Food safety requirements are becoming increasingly stringent, due to disease problems such as bovine spongiform encephalopathy (BSE) associated with processed animal products [20]. A similar trend is occurring in developing countries, although currently limited to the affluent (rich) urban class [35].
Another key driver of change that is leading towards larger-scale, cereal-based animal production systems around the world has been the rise in labor costs in the industrialized economies and in some parts of the developing world, as a result of economic growth and rising incomes [34]. Changing economic policy associated with rapid economic growth in parts of the developing “world such as Asian “tiger” economies has changed the investment climate in emerging economies and led to massive inflows of FD1 [33]. Similarly, labour migration from developing to industrialized economies has generated capital flows back to developing countries, which are often larger than official development assistance [39].
In the context of rapid population growth, many countries and social and ethnic groups within countries have not participated in the growth process [40]. Large numbers of poor people, particularly in rural areas, have been left behind or adversely affected by the changes [41]. For example, such communities may actually suffer from loss of access to natural resources, bear the brunt of environmental impacts and be characterized by the breakdown of traditional social and economic ties and values, without a better (or at least viable) alternative. Also, local breed animals are often not competitive in this changing world [42].
Availability of market for livestock products: The increasing demand for animal products as well as higher standards to improve the quality and safety of the products and more processed animal products have substantial consequences for the evolution of livestock production systems [22]. Overall, the processes of economic development, urbanization, population growth and changing patterns of consumption have led to continuous increase in the consumption of animal products in the developing world, a process that has been termed the “livestock revolution”. FAO data suggest that this trend is expected to continue for several decades because of the strong direct correlation between rising income and increasing animal product consumption [31].
The growing demand for animal products in the developing world is associated with the changes in production location, facilitated by the increasing ease of transporting feed and animal products around the world [43]. Animal products were previously produced close to where the consumers live. Increasingly, livestock production now takes place close to the locations with good access to feed, either in feed production areas or ports [3].
Factors affecting cattle production in Rwanda and in tropics
Animal factors: As compared to breeds originated from temperate areas, cattle breeds originating from the tropics generally have a limited genetic potential for milk production and remain mediocre producers (500-1500 kg per lactation) even when the best possible husbandry conditions are available to them [44]. However, the Rwandan/Africa indigenous breeds have special adaptive traits for disease resistance, heat tolerance and ability to utilize poor quality feed [12].
Calving interval can be divided into three periods: gestation, postpartum anoestrus (from calving to first oestrus) and the service period (first postpartum oestrus to conception) [33]. The “days open” period should not exceed 80-85 days if a calving interval of 12 months is to be achieved [10]. The economic return from milk production is maximized with a calving interval of 12 months, a dry period of approximately 60 days and days open of 85 days. The duration of this period is influenced by nutrition, season, milk yield, parity, suckling and uterine involution [16,20] used standard herd structures to study the factors affecting herd structure, and they as summarized: Age at first calving: this affects the relative proportions of calves, heifers and cows in the herd. As the age at first calving decreases, (other factors remaining the same) the number of replacement heifers required is reduced and the proportion of breeding cows increases; the overall, ‘herd size decreases thus reducing the land and feed resource requirements for the herd [41].
Calf mortality: high levels of calf mortality necessitate increased levels of fertility if sufficient replacements are to be available. Low calf proportions in the herd could indicate one or a combination of the following: that adult mortality is low; that excess calves not needed as replacements have been sold; that calving percentages are low; and that the calf mortality is high [16]. Herd fertility: The ratio of breeding cows to calves is an indicator of the relative fertility levels under steady-state conditions. A calf proportion of 25 percent is the maximum that can occur in a female herd unless the breeding herd has been previously depleted. Herds with less than 10 percent of calves are probably declining [10].
Breeding Factor: historically, domestication and the use of conventional livestock breeding techniques have been largely responsible for the increases in yield of livestock products that have been observed over recent decades [25]. Selection within breeds of farm livestock produces genetic changes typically in the range 1-3% per year, in relation to the mean of the single or multiple traits that are of interest [45]. There is much more potential in the use of crosses of European breeds with local Ankole that are well-adapted to local conditions, may increase milk yield, carcass dressing percentage, fecundity and market attainment weight [35]. Genomic selection should be able to at least double the rate of genetic gain in the dairy industry [46], as it enables selection decisions to be based on genomic breeding values.
In developing countries like Rwanda genetic improvement is one of the many contributing factors to increased livestock productivity, production and with improving the nutritional and health status of animals would be the key factors for this improvement in livestock production [37]. But if livestock are to continue to contribute to improving livelihoods and meeting market demands, the preservation of farm animal genetic resources will be critical in helping livestock adapt to climate change and the changes that may occur in these systems, such as shifts in disease prevalence and severity [47,48]. Institutional and policy frameworks that encourage the sustainable use of traditional breeds and in situ conservation need to be implemented and more understanding is needed of the match livestock populations, breeds and genes with the physical, biological and economic landscape [37].
Husbandry/management factors: Inability to feed animals adequately throughout the year is the most widespread phenomenon, Dry-season feed supply is the paramount problem and natural pastures of the tropics have significant seasonal variations of productivity and nutritive value [20]. In addition, the most serious factor of animals, disease constraints have reasonable impact on livestock productivity especially parasitic and viral diseases mainly vector-transmitted that have a wide geographic distribution and whose severities are strongly influenced by the environment especially diseases transmitted by ticks (east coast fever babesiosis, anaplasmosis, heart water) contributing to decrease the productivity of livestock [49]. Climatic with temperatures more than 25°C, particularly in humid air conditions leads to a reduction of dry matter intake by milking cows and, as a consequence, a drop in their production. High ambient temperatures have another depressive action on milk production by reducing the fertility of the cows, thus lengthening the interval between lactations.
Socially according to Rwandan history cattle keeping was the main source of income in terms of trade exchange. It is traditional that bride wealth payments (inkwano) are made in terms of cattle. Sometimes there is a ritual purpose (example installation of ancestral spirits (abakuru), ritual slaughter, social status and pleasure in ownership ritual requirement for a household to keep a mature bull upon which an ancestral spirit is installed by a spirit medium [6]. The most important functions of cattle in Rwanda today are economic functions, associated firstly with increased crop production through use of animal draught and secondly with provision of cattle products, mainly milk but also meat, hides, horns, local sale and other by-products for domestic consumption [19].
Current status of animal production in Rwanda
In Rwanda, agriculture contributes to 33% of GDP with livestock contributing about 16%. The current livestock population consists of 1,194,895 cattle, 1,270,903 goats 371,766 sheep 211,918 pigs, 498,401 rabbits and 482,124 poultry [19]. Most of livestock, especially cattle are found in Eastern and Southern provinces. Nyagatare District is one of the leading cattle producing areas in Eastern Province [50]. According to statistics by Rwanda agricultural board (RAB), the cattle population in the district exceeds the estimated carrying capacity for the available grazing land [51]. The predominant cattle production system is the mixed farming (Agro-pastoral) system characterized by keeping of Ankole-Friesian crosses that graze on natural communal pasture. Crop residues, especially maize, beans, banana and potato residues are fed as supplementary feeds mainly during dry season [32]. Besides overstocking, scarcity of water and shortage of feeds, there is also a problem of heavy disease burden; the commonest being east coast fever (ECF), trypanosomiasis and epidemic diseases such as, foot and mouth disease (FMD) contagious bovine pleural pneumonia (CBPP) [52].
Constraints of cattle production in Rwanda
In Rwanda, livestock production faces many challenges including, lack of feeds. This is due to shortage in farming land, insufficient and non-controlled commercial feeds [32]. This has adverse implications on reproductive efficiency of animals as feed nutrients become inadequate in supporting the potential yield levels. The scarcity of water to the animals in the country is also a very big challenge and this greatly affects animal production high spread of diseases due to communal watering place, stress due to long distances in search of water especially during the dry season [53].
Another major problem is poor quality breeds [54]. Rwanda is dominated by indigenous Ankole cattle breed that is known to have poor genetic potential [5]. They are characterized by long calving interval hence low total lactation yield and length, low milk yield, late maturity, and poor (less 60%) carcass dressing percentage [34]. However dairy breeds in Rwanda have better lactation yields [8]. Furthermore, in Rwanda farmers are not organised into a strong marketing organization such as cooperative unions, however the government is trying to organise farmers especially those in dairying production into cooperatives but there have not yet developed into a strong organisation [6].
Even though the government has put more emphasis on livestock infrastructure Support Program (LISP) for 2011-2015 for improving water supply, Project pour le Development du Mutara (P.D.M,), Project d’Appui au Development de l’elevege Bovinz laitier au Rwanda, (PADEBEL), Gilinka (Munyarwanda), Send a cow, different NGOs and massive importation of dairy cow from Uganda achieved different levels of success [55]. But still aaccessibility of credit to small-scale farmers is very limited to the rural areas where majority of farmers operate. This hinders the adoption of improved farming technologies by the farmers as they have no money to invest in inputs and this result in poor animal production. Inadequate linkage between research and extension to farmers, until now, research has been conducted mostly in research stations without much impact on farming communities.
Conclusion on literature reviewed
Livestock industry/production in Rwanda is developing and contributes significantly to the (GDP) of (about 16%) and livelihood of nearly every rural household. The indigenous (traditional) practices predominate hence poor production indices and many parasitic and infectious diseases are endemic.
Materials and Methods
Study area
Rwanda is a landlocked country located between latitudes 1°04’ and 2°51’ South and longitudes 28°45’ and 31°15’ east. It has five administrative provinces namely: (Eastern, Western, Southern, Northern and Kigali city), [5]. Nyagatare district in eastern province is commonly known as “Milk shed and is food basket” and is one area of Rwanda that can support the extensive and semi extensive livestock production [6]. The inhabitants of the district are engaged mainly in integrated crop-livestock farming as the main economic activity. The majority of the farmers keep cattle mainly for milk production, living in scattered homesteads where they keep limited number of local Ankole cattle, exotic and their crosses with exotic breeds under zerograzing, tethering, fenced farms or free-range depending on land size (Appendices 1-6) [56].
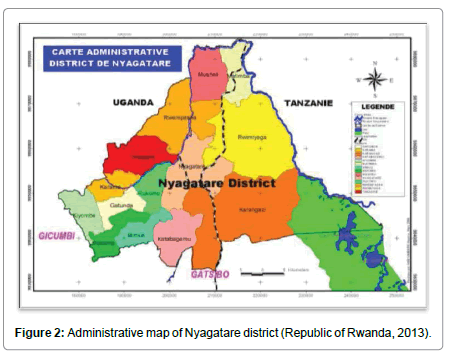
Nyagatare is divided into 14 administrative sectors made of 106 cells and 630 villages and covers an area of 1741 Km2, located in the granite low valley whose overage altitude is 1513, 5m above sea level (Figure 2), characterized two main seasons: long dry season that varies between 3 and 5 months, an annual average temperature between 25.3°C-27.7°C, Annual rain fall weak (827 mm/an) and very unpredictable to satisfy the needs in agriculture and livestock [50].
Study design
A cross-sectional study was conducted using questionnaire interview, participatory group discussion and personal observation to collect data on characterization of cattle production system in Nyagatare District at five dairy cattle production sectors, namely; Nyagatare, Rukomo, Matimba, Rwemiyaga and Karangazi cattle production sites.
Description of study subjects
All households in Nyagatare District keeping one or more cattle were included in the study population.
Sampling
Sample size determination: Based on the 2013 census of Nyagatare district the total number of households keeping cattle in the five survey sectors was 2490 and using a simplified process of determining the sample size for a finite population, Krejcie and Morgan 1970 table (Table 1), the ultimate sample size was determined to be 360 farms. Based on this method, sample size for each sector was determined as follows:
| Sector | No. of households | Proportion of each sector | Number of selected farmers |
|---|---|---|---|
| Nyagatare | 310 | 12.45% | 45 |
| Karangazi | 907 | 23 36.42% | 130 |
| Rwemiyaga | 650 | 26.1% | 95 |
| Matimba | 331 | 13.3% | 48 |
| Rukomo | 292 | 11.73% | 42 |
| Total | 2490 | 100% | 360 |
Selected households from each sector.
Table 1: Determination of sample size in selected sectors.

Where N: sample size
i: number of sectors
ni: number of selected farmers in each sector
Sampling technique: A study on characterization of cattle production systems was conducted in Nyagatare district based on data collected between June and July, 2016. A total of 360 households were randomly selected using systematic random sampling method. A multistage sampling procedure was employed to select representative households in five sectors of Nyagatare District, bearing in mind the differences in production systems within sectors and cells of a district. Five (5) sectors were purposively selected basing on location, cattle population density, total cattle population predominant rearing system, and level of urbanization. Based on these criteria 5 sectors namely Nyagatare, Karangazi, Rwemiyaga Matimba and Rukomo were purposively surveyed (Table 2). In each selected sector, fifty percent of administrative cells were randomly selected and respondents were then randomly selected from each cell in accordance with sample size.
| SN | Sector | Characteristics |
|---|---|---|
| 1 | Nyagatare | High levels of urbanization, river line mainly, cross breed cattle on fenced farms |
| 2 | Karangazi | Large farms and adjacent to Akagera national park |
| 3 | Rwemiyaga | Large farms and adjacent to Akagera national park |
| 4 | Rukomo | Small farms mainly rural improved cattle breeds, poor accessibility. |
| 5 | Matimba | Medium size fenced farm river line and shares international borders with Tanzania and Uganda |
Table 2: Criteria for sampling sectors from Nyagatare district.
Data collection
The field survey was conducted through three approaches namely, the preliminary survey involving participatory rural appraisal (PRA) with district and sector veterinarians, farmer group representatives and other stakeholders investigated to gain an overview of the cattle production systems in the area. The information generated was used for the preparation and development of the questionnaire for the second phase of the formal survey (Appendix 7). The questionnaire was pre-tested before the actual data collection on selected respondents in the different cells of the study area in order to streamline the questionnaire. The formal survey was conducted by investigator in local Kinyarwanda language under close supervision and participation of the academic supervisors. Review of secondary data was sourced from periodic reports of district and sector veterinary officers. Primary data were collected through administered pre-tested semi-structured questionnaires; interviews were supported by observation, group discussion, images, recall interview, and farm records where available.
Determination of production systems: Primarily, overview of the area was perceived through focus group discussion held with veterinary and agriculture extension officers, experts and development agents. Group discussion with key informants was also employed to know the overview of cattle production system in the area. A questionnairebased survey was used to collect primary data needed for assessment of production and production challenges in the area. Questionnaire (Appendix 7) based data collected for assessment of cattle production systems included the following variables, namely; socio-demographic characteristics (age, sex, marital status, family size, educational background, primary occupation, income sources, landholdings), cattle herd structure, cattle breeds, experience and purpose of cattle rearing, productive and reproductive performance of cows, type of breeds system and breeding practices used, feeds and feeding system, water sources, housing, record keeping, the type and amounts of milk, cattle health and disease problems and distance to developed centers.
Determination of evolution of livestock system: A quantitative procedure (Appendix 1) was used to convert the qualitative assessment of cattle management practices using scores so as to quantify the different production systems. The data collected was used to score the level of development of the severed farms. Ten key management indicators were scored on a range of 0-10 and then the individual scores added for each severed farm to get a total score of each farm. The indicators were agreed up on by peer review composed of a selected team of animal production experts from the school of animal sciences and veterinary medicine in corroboration with key informants from cattle farming community in area. The proposed indicators were validated by peer review and key informants before the survey. The proposed indicators included, 1: type of animal identification, 2: method of feeding, 3: water source, 4: cattle housing, 5: tick control, 6: worm control, 7: calf management, 8: breeding practices, 9: record keeping and 10: objective of animal off take. The level of evolution of production systems were determined by the total scoring of each farm against the ten (10) parameters on scale of 0-100 scores. The frequencies of total scores were determined and ranked on scale 0-100 based on these scores from each farm. The total scores for each farm were indicative of level evolution (intensification) of that farm at a scale of 0-100 (Appendix 1).
Determination of lactation level: For each breed of cattle on a given farm the total milk yield per day on the previous day to interview was captured. This was then added to obtain the total milk yield and average milk yield per cow for each household, sector and district.
i. Total dairy milk yield for the sample population=Sum of total dairy milk yield per sector
ii. Average daily milk yield for the sample population=No. of milking animals/Sectors sampled
Determination of calving rates for each breed: The calving rate was determined by expressing the mature cow that calved in one year as proportion of mature cows in the same year.
Annual calving rate=365/Mean calving interval in days
Statistical analysis
The data obtained was entered into Excel and later transferred to Statistical Package for Social Science, (SPSS version 21). Descriptive data analysis was carried out to determine frequencies and proportions which were presented in tables, pie-charts and graphs. Where comparisons were carried out, for categorical data, Fischer’s exact or Pierson chi-square was used and t-test was used for continuous variables. P values less than 0.05 were taken as statistically significant at 95% confidence interval. The level of evolution of production systems was examined assessiment of cattle management practices using scores so as to quantify the different production systems as per Appendix 1.
Results
Demographic characteristics of the respondents
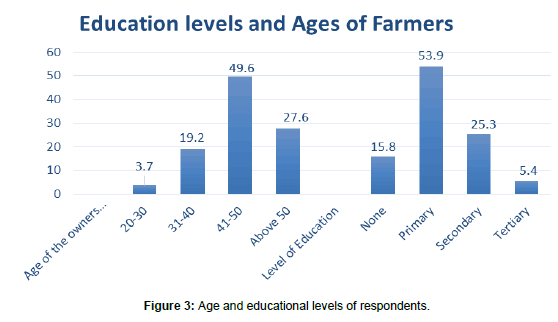
Most respondents 189 (52.6%) were in the modal range of 41-50 years of age, followed by that of (24.6%) above 51 years and the aged between 20-30 were only (3.7%). With regard to educational level most of the farmers 194 (53.9%) had only primary and only (3.4%) had attained tertiary education (Figure 3). There were differences in the size of landholding between the sectors of Nyagatare district. The mean total farm size in the study area was 6.5 ± 0.8 ha. This was more than the average national household land size of 3.0 ha. The distribution of farm and herd size in all sectors significantly (X2, p<0.05) differed with large sized farms mostly in Rwemiyaga and Karangazi. Average herd size was highest in Karangazi sectors (more than 70 head of cattle) followed by Rwemiyaga (68 head of cattle), Nyagatare and Matimba had less than 40 head of cattle per household (Table 3).
| Item | Frequency | Percentage |
|---|---|---|
| Ownership of the farms | ||
| Private | 354 | 98.3 |
| Institutional | 6 | 1.7 |
| Farm distance to permanent road (Km) | ||
| Across | 52 | 14.4 |
| Less than 1 | 128 | 35.6 |
| 2-3 | 106 | 29.4 |
| 3-4 | 28 | 7.8 |
| Above 4 | 46 | 12.8 |
Table 3: Farm ownership and distance to developed centers.
Ownership and distance of farms from developed centers: Majority of farms 354 (98.3%) were privately owned and in most cases (64.9%) were less than 3 km from a developed center and permanent roads. Very few farms 7.8% were more than 4 km away from developed centers and most of the surveyed farmers (56.8%) had large families of 5-8 members.
Current cattle husbandry and management practices in Nyagatare district
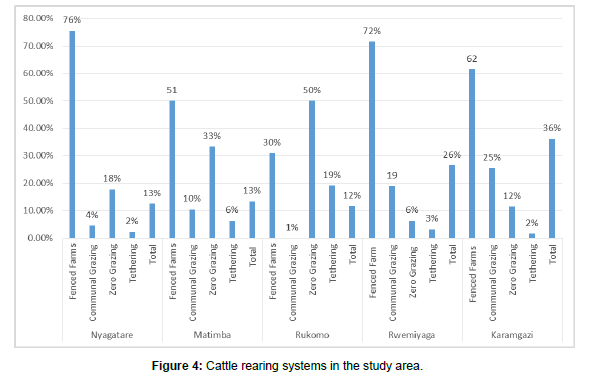
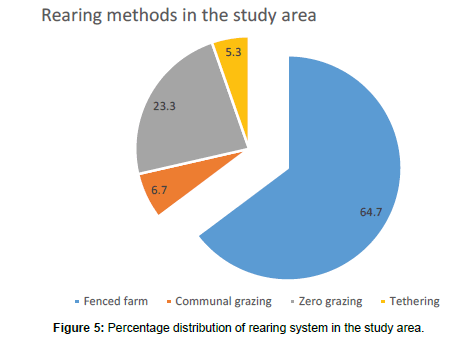
Rearing systems and feeding practices: It was observed that grazing in fenced farms was the main rearing system in all sectors except Rukomo sector where (50%) of the respondents practiced zero grazing. Grazing in fenced farms was mostly reported in Nyagatare (76%), Rwemiyaga (72%) and Karangazi (62%). Tethering and communal grazing of cattle were still practiced albeit at low levels, except Rukomo sector where they were non-existent. Natural pastures (savanna grassland) was still the main feed resource as observed on 233 (64.7%) of the farms. Out grazing on fenced farms predominated (64.7%), followed by zero grazing system 84 (23.3%), communal grazing/tethering (12%). There was statistical significant difference (X2 (0.05,1) p<0.05) in farming systems among different sectors (Figures 4 and 5).
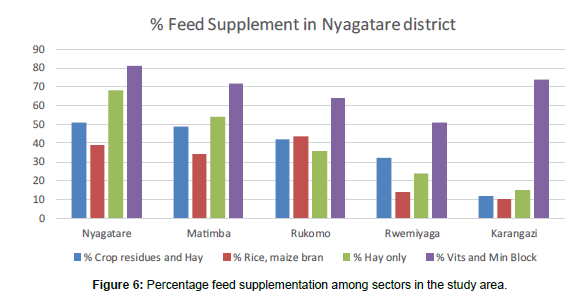
Levels of supplementation in the study area: Most farmers 196 (54.5%) fed their animals solely on pastures without any supplementation. Planted pastures were being adopted as 151 (41.9%) reported used of both natural and planted pastures. Only (3.6%) of farmers practiced supplement feeding. Napier grass (Pennisetum purpureum) was the main planted forage reported 151 (93.2%), followed by Chloris gayana (3.1%) and Brachiara. Leguminous forages such as Calliandra, Lucaena leucocephala, Desmodium species, Lablab and Mucuna were also reported by very few farmers. Maize and rice brans were reported to be the main feedstuffs used in supplementary feeding especially for lactating cows. However, crop residues of maize, beans and rice and purchased hay were reported to be used in dry season supplementary feeding (46.1%) (Table 4). There was statistically significant difference (X2 p<0.05) among the sectors. Nyagatare sector was more advanced in supplementary feeding 51.5% than rest of the surveyed sectors (Figure 6).
| Item | Frequency | Percentage |
|---|---|---|
| Feed stuffs and feeds used ** | ||
| Sorely on pastures | 196 | 54.5 |
| Supplements | 13 | 3.6 |
| Both (natural pasture and supplement) | 151 | 41.9 |
| Main food crops | ||
| Maize | 136 | 92.5 |
| Beans, banana or soya beans residues | 11 | 7.5 |
Table 4: Percentage feeding levels of supplements in the study area.
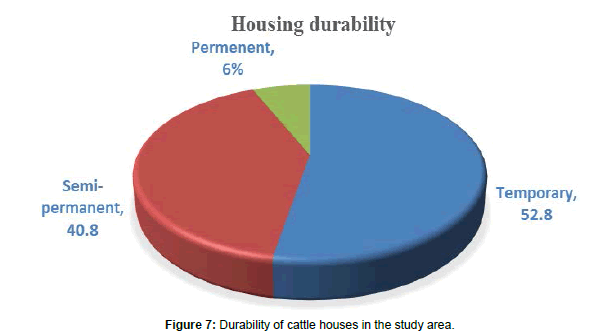
Animal housing and durability of houses: As shown in Figure 7, the majority of respondents 218 (60.6%) had animal houses such as calf pen, milking sheds and farm store and there was no statistical difference (p=0.05) among the different sectors. Most of the houses where temporary in construction (52.8%), semi-permanent (40.8%) and permanent (6.4%) and there was a statistically significant difference (X2 p<0.05) among the sectors. Rukomo sector had the highest percentage (69.6%) of semi-permanent cattle houses followed by Nyagatare sector. Temporal shelters prevailed in all the other sectors.
Calf pens were the most 144 (66.1%) common animal houses on the farms. However, there were no single pens for calves only in all cases. These results indicated that cattle housing practices are still rudimentary lacking enough biosecurity measures against common cattle diseases and predators.
Farm labor: Family labor prevailed 262 (72.8%), hired labor was lower (23.8%) reported. Very few farmers (9.1%) hired more than three casual laborers on their farms and majority (76.1%), of the farms were managed by owners. With such low labour levels management of the large herds of cattle on large acreages of land may not be successful. This may therefore account for low levels technology adoption observed on most farms (Table 5).
| Item | Frequency | Percentage |
|---|---|---|
| Status of manager | ||
| Owner | 274 | 76.1 |
| Worker (Hired) | 24 | 23.9 |
| Number of causal workers | ||
| 0 | 287 | 79.7 |
| 1-2 | 36 | 10 |
| 3-4 | 33 | 9.1 |
| Above 4 | 4 | 1.1 |
| Type of labor | ||
| Family labor | 262 | 72.8 |
| Hired labor | 98 | 27.2 |
Table 5: Farm labor in the study area.
Animal identification and record keeping: Traditional methods of animal identification dominated as most farmers 347 (96.4%) reported identifying their cows based body color, shape of horns, sex, age and origin of animal. Accordingly, cows had different names and attributes. Use of modern methods of identification such as ear tags were very lower 13 (3.6%) reported. There was no significant difference among the sectors (p>0.014) with regard to animal identification.
An overwhelming majority of farmers 327 (90.8%) never kept any records and of the few 30 (8.3%) that did, kept records informally (loose papers or exercise books). Only three farmers kept modern records 3 (0.8%) using computers. The records that were mainly kept included production, breeding, purchases, sales, mortality, calving, culling, diseases and feeding records (Table 6).
| Item | Frequency | Percentage |
|---|---|---|
| Identification of animals | ||
| Phenotypically (names, color patterns and horn shape) | 347 | 96.4 |
| Ear tag | 13 | 3.6 |
| Keep records | ||
| Yes | 33 | 9.2 |
| No | 327 | 90.8 |
Table 6: Animal identification and record keeping in Nyagatare district.
Availability of water and water sources in the study area: With regard to water sources the majority of surveyed farms 323 (89.7%) had no water near or within their farm. Accordingly, most farmers trekked their cows to the nearest valley dam 213 (59.2%), rivers (21.1%) (Muvuba and Akagera) and only 6% of respondents had access to piped water. 2.6% households had water reservoirs in form of water tanks and bags. It is noteworthy that the public water sources were often far from the farms as 151 (41.9%), of respondents reported a distance of 3-5 km. (Table 7).
| Item | Frequency | Percentage |
|---|---|---|
| Distance to water source (Km) | ||
| Near the farm | 70 | 19.4 |
| Less than 1 | 133 | 36.9 |
| 3-5 | 151 | 41.9 |
| 5-8 | 4 | 1.1 |
| Above 8 | 2 | 0.6 |
Table 7: Water sources and availability in the Nyagatare district.
Animal breeds and breeding practices: Majority of farmers (67.03%) kept the indigenous Ankole cattle followed by (28.37%) those that kept cross breeds and only (4.6%) farmers kept exotic breeds (Table 8). The major breeding practice used was upgrading of indigenous cow with pure bred exotic bulls mainly of Friesian breed.
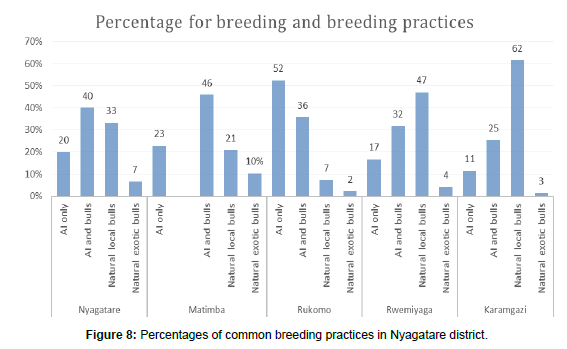
The use of artificial insemination for genetic upgrading was still in its infancy as only 3.75% of farmers solely used AI and 21.35% farmers used both artificial inseminations (A.I) and natural mating. Breeding practices were significantly different in different sectors (X2 p<0.05). Natural breeding with bulls still remains the dominant mode of breeding mostly in sectors of Karangazi, Rwemiyaga with the average of more than 70%, whereas Rukomo had the highest percentage A.I (52%) practice followed by Nyagatare sector (Figure 8).
Cattle disease prevalence and management: Different diseases were reported to have been encountered in the last six months at the time of the study. Trypanosomiasis was most reported 243 (73.4%) as a serious cattle disease especially in sectors bordering the Akagera National Park (Karangazi 85%, Rwemiyaga 82.8%). Helminthiasis was also reported to be a major disease burden especially in riverine sectors of Matimba (67%) and Nyagatare (64%). Tick borne diseases were relatively less reported as compared to trypanosomiasis and worms infectious viral and mycoplasma disease were not reported at all. There was statistical significant difference (p<0.05) in reporting cattle diseases in various sectors (Table 9).
| Sector Names | Exotics | Percentage of breed/sector | Cross breeds | Percentage of breed/sector | Indigenous breeds | Percentage of breed/sector | Total |
|---|---|---|---|---|---|---|---|
| Nyagatare | 96 | 6.02% | 398 | 24.97% | 1100 | 69.01% | 1594 |
| Matimba | 101 | 10.9% | 326 | 33.1% | 545 | 56.0% | 972 |
| Rukomo | 27 | 6.26% | 204 | 46.87% | 204 | 46.87% | 435 |
| Rwemiyaga | 58 | 3.36% | 435 | 25.24% | 1231 | 71.40% | 1724 |
| Karangazi | 43 | 1.86% | 632 | 27.32% | 1638 | 70.82% | 2313 |
| Average % Breeds | 5.68 | 31.5 | 62.82 | 100 | |||
| Sub-total | 325 | 1995 | 4718 | 7038 | |||
| Percentage | 4.6% | 28.37% | 67.03 | ||||
Table 8 : Percentages of cattle breed composition in per sector in the study area.
| Diseases | Sectors | Total % | X2, P | ||||
|---|---|---|---|---|---|---|---|
| Nyagatare | Matimba | Rwemiyaga | Karangazi | Rukomo | |||
| Trypanosomiasis* | 34 (56.2) | 41 (63.9) | 83 (82.8) | 62 (85) | 24 (47.8)) | 243 (67.5) | <0.009 |
| Tick borne diseases* | 15 (37.5) | 12 (16.4) | 25 (20.7) | 33 (34) | 4 (13.8) | 89 (24.7) | <0.009 |
| Worms* | 27 (67.5) | 53 (72.6) | 57 (47.5) | 52 (53.6) | 18 (62.1) | 207 (57.5) | <0.005 |
| Skin diseases* | 5 (12.5) | 32 (43.80 | 31 (25.6) | 13 (13.4) | 2 (6.9) | 83 (23.1) | <0.001 |
| Mastitis | 12 (30) | 17 (23.3) | 29 (24) | 16 (16.5) | 5 (17.2) | 79 (21.9) | >0.42 |
| FMD | 0 | 0 | 0 | 0 | 0 | 0 | 0 |
| CBPP | 0 | 0 | 0 | 0 | 0 | 0 | 0 |
| Others | 2 (5) | 8 (10.9) | 14 (11.5) | 10 (10.2) | 1 (3.4) | 35 (8.2) | >0.43 |
* Except Mastitis and others disorders all diseases were statistically significant (X2, p<0.5).
Table 9: Percentages of common diseases reported on farm from different sectors.
Control of tick borne diseases was mainly by spraying with acaracides using bucket spraying pump 341 (94.7%). The other rarely used methods were hand dressing, pour-ons and hand picking. Dip tanks and spray races were not reported at all. Mastitis was also reported by relatively few farmers (23.1%) no statistically significant (p>0.05) and was mainly reported to be prevented by udder hygiene 283 (78.6%) such as udder washing, teat dipping in disinfectants. Other methods used in control of diseases on the farms included restraining movement of animals using perimeter fencing (27.4%) however with doubtable efficiency due to communal water sources.
Cattle herd structures and composition
Cattle herd compassion: Based on tropical livestock unit (TLU) cattle were most numeruos (90.6%) followed by goats 7.9% and sheep 1.5%. The herd age sex composition revealed that mature cows averaged 65.9% which is much higher than expectation in steady state cattle population this may be due to continous importation of breeding cows or exceesive motarity (Table 10).
| Species and breeds age sex categories | Average weight of categories in Kg | Tropical LU conversion factor | Herd population of age sex compassion | Total livestock unit | Percentages of each breed type | |
|---|---|---|---|---|---|---|
| Local Cows | 300 | 1.2 | 3624 | 4348.8 | 90.3 | Local |
| Local Bulls | 350 | 1.4 | 109 | 152.6 | 3.17 | 60.6 |
| Local Heifers | 200 | 0.8 | 349 | 279.2 | 5.8 | |
| Local Calves | 25 | 0.1 | 346 | 34.6 | 0.72 | |
| Sub- Total | 4815.2 | Cross breed | ||||
| Cross Cows | 350 | 1.4 | 1130 | 1582 | 80.1 | 24.8 |
| Cross Bulls | 400 | 1.6 | 26 | 41.6 | 2.1 | |
| Cross Heifers | 250 | 1 | 305 | 305 | 15.4 | |
| Cross Calves | 30 | 0.12 | 378 | 46.4 | 2.4 | |
| Sub-Total | 1975 | Exotic breed | ||||
| Exotic Cows | 400 | 1.6 | 209 | 334.4 | 80.9 | 5.2 |
| Exotic Bulls | 450 | 1.8 | 8 | 14.4 | 3.5 | |
| Exotic Heifers | 300 | 1.2 | 49 | 58.8 | 14.2 | |
| Exotic Calves | 35 | 0.14 | 43 | 6 | 1.5 | |
| Sub-Total | 413.6 | Goats | ||||
| G-Total | 7204 | |||||
| Goats | 22 | 0.88 | 427 | 375.7 | 59.8 | 7.9 |
| Growers | 10 | 0.4 | 211 | 84.3 | 13.4 | |
| Kids | 5 | 0.2 | 846 | 169.0 | 26.9 | |
| Sub-Total | 629 | sheep | ||||
| Sheep | 25 | 1 | 68 | 68 | 54.1 | 1.5 |
| Growers | 12 | 0.48 | 35 | 16.8 | 14.1 | |
| Kinds | 6 | 0.24 | 140 | 33.8 | 28.4 | |
| Sub-Total | 119 |
|
||||
| GRAND TOTAL | 7952 | |||||
Table 10: Percentage cattle age, sex structure and species composition in Nyagatare district.
Livestock and cattle herd composition: Cattle comprised more than 90.6% based on stranded livestock unit (SLU) followed by goats (7.9%) and sheep (1.5%) of all livestock TLU kept by Nyagatare district farmers. There was no difference in average sheep flocks size similar as it was 1.17 ± 3.0 however the average goat flock size was significantly different (t=1.4, P<0.05) among the sectors (Table 11).
| Livestock species | |||
|---|---|---|---|
| Sectors | Cattle | Goats* | Sheep* |
| Mean (SE) | |||
| Nyagatara | 13.82 ± 3.54 | 1.13 ± 1.71 | 0.17 ±3.0 |
| Matimba | 12.64 ±.84 | 2.01 ±0.12 | 1.1 ±.50 |
| Rukomo | 9.52 ± 1.37 | 0.44 ± 0.1 | 0.2. ±.12 |
| Rwemiyaga | 6.04 ±1.23 | 2.2 ± .34 | 1.4 ±.36 |
| Karangazi | 3.81 ±2.57 | 2.23 ± 91 | 1.0 ± .18 |
Table 11: Average livestock and cattle herd composition among the sectors.
Cattle production traits
The overall reported mean age at first calving (AFC) for different breeds of cattle was 40.2 ± 0.33, 31.3 ± 0.40, 29.1 ± 0.50 months for Ankole (local), cross breed, exotics respectively. Calving interval was low in local breeds than in exotics, crosses being intermediate, but crosses and exotic breeds were significantly (t=3.2, p<0.05) younger at first calving than the locals (Table 12). The indigenous cows in the Nyagatare district had the least mean yield of 2.4 ± 0.08, cross breed 7.2 ± 0.34 and exotics 10.42 ± 0.36. There was statistical significant difference (t=10.42, P<0.05) in amount of milk produced among different breeds. Although local cows were kept by most farmers, the exotic breed and crosses performed better than local breeds and there was a statistical significant difference (t=10.42, P<0.05) among the breeds.
| Animals a | Locals | Crosses | Exotics |
|---|---|---|---|
| Calving-rate (%) | 42.3 ± 0.45 | 47.9 ± 1.7 | 65.7 ± 3.0 |
| Age at first calving (months) | 40.2 ± 0.33 | 31.3 ± 0.40 | 29.1 ± 0.50 |
| Lactation length (month) | 6.7 ± 0.13 | 8.5 ± 0.14 | 9.4 ± 0.12 |
| Uncorrected average daily MY (1)* | 2.4 ± 0.08 | 7.2 ± 0.34 | 10.4 ± 0.36 |
| Lactation yield (L) | 494.0 ± 21 | 1868.0 ± 91 | 2995.0 ± 108 |
**Statistical significant difference (t=1.4, P< 0.05) in milk produced among different breeds.
Table 12 : Average production parameters of different breed types of cattle in study area.
Cattle mortality rate: The results indicated that regardless of breeds nor were sectors calves reported to have higher mortality rate above average of 24% than all other sex-maturity groups. But the overall mortality of all breeds was significantly higher (t=14.16) in the exotics breeds than in the local (9.7 ± 0.05), of the breeds on studied farms, (t=3.3, p>0.05) the exotics had no significant difference in calf mortality than the local breeds and the calf mortality of crosses was intermediate, Table 13 shows the details.
| Animals a | Locals | Crosses | Exotics |
|---|---|---|---|
| Calves | 23.5+0.56 | 25.0+0.43 | 28.0+0.40 |
| Heifers | 3.4+0.07 | 3.4+0.07 | 7.0 ± 0.05 |
| Cows | 4.4+0.07 | 6.2 ± 0.09 | 10.2+0.10 |
| Bulls | 3.4+0.15 | 4.8 ± 0.03 | 8.9 ± 0.08 |
| Steers | 6.8+0.44 | 2.9+0.04 | 8.3 ± 0.03 |
| Overall | 8.6+0.12 | 10.6+0.11 | 14.0+0.11 |
Table 13: Various grades of indigenous-exotic and crosses.
Weighted mean mortality rates ( ± s,e.)
Evolution levels of cattle production system in Nyagatare district
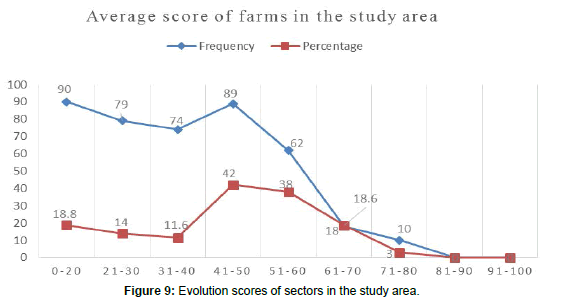
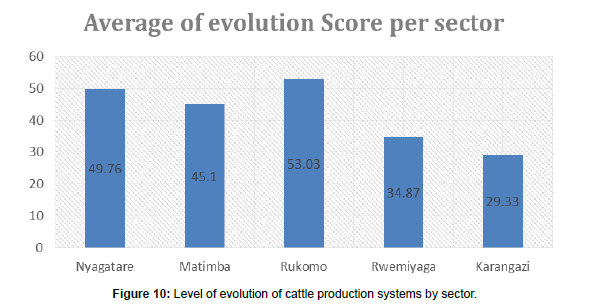
The results of scores on ten management variables were determined in the current study on scale of 0-100 and (Appendix 5 and Figure 9). The results revealed that the combined management practices of cattle farms in the study area were still at a medium level according to the score ranges where the scoring showed three main blocks, most farmers were in block area of scores of a range of 41-70 (54.9%) followed by a block range of farmers scoring a range 0-40 (42.0%) leaving only 3.1% above 70 scores. More evolutional signs were much seen in sectors of Rukomo with 53.03% scores followed by Nyagatare 49.76% scores with Karangazi scoring the lowest 29.33% (Figure 10).
Farmers’ challenges and constraints to cattle production system
Farmers expressed different challenges in cattle production which were ranked from the highest to the lowest. Cattle disease were reported 337 (93.6%) to be the main challenge faced mostly in sectors of Karangazi 96.9% and Rwemiyaga 93.4% followed by lack of water 323 (89.7%), and it was statistically significant difference (p<0.05) among various sectors. Shortage of feeds especially during dry season was also a big constraint 283 (78.6%) together with lack of breeding facilities 260 (72.2%). lack of information 207 (57.5%), and extension workers and lack of land were also statistically significant (X2 p<0.05).The other constraints included: lack of capital, poor or no housing, price fluctuation and theft (Table 14).
| Farmer challenges | Percentage (%) of farmers per sector | Total % | X2, P | ||||
|---|---|---|---|---|---|---|---|
| Nyagatare | Matimba | Rwemiyaga | Karangazi | Rukomo | |||
| Disease | 92.5 | 91.8 | 93.4 | 96.9 | 89.7 | 93.6 | 0.55 |
| Lack of water | 97.5 | 95.9 | 90.1 | 90.7 | 58.6* | 89.7 | 0.001 |
| Feed shortage in dry season | 87.5 | 84.9 | 71.9 | 78.4 | 79.3 | 78.6 | 0.14 |
| Lack of breeding facilities | 80 | 67.1 | 66.9 | 74.2 | 89.7 | 72.2 | 0.08 |
| Lack of information and extension services | 80 | 63 | 67.8 | 79.4 | 79.3 | 72.2 | 0.07 |
| Lack of land | 75 | 67.1 | 44.6* | 57.7* | 62.1 | 57.5 | 0.003 |
| Lack of capital | 60 | 56.2 | 43 | 46.4 | 55.2 | 49.4 | 0.21 |
| Lack of housing | 35 | 45.2 | 38.1 | 48.3 | 38.1 | 39.2 | 0.54 |
| Price fluctuation | 30 | 39 | 35.5 | 41.2 | 51.7 | 38.6 | 0.39 |
| Theft | 30 | 38.4 | 32.2 | 30.9 | 48.3 | 34.2 | 0.39 |
**Water and Land shortage were (X2 p<0.05) statistically significantly.
Table 14: Farmers’ challenges and constraints to cattle production.
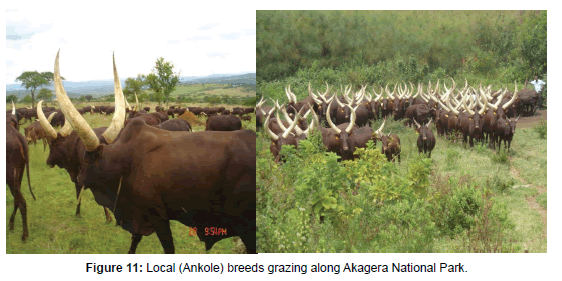
Rwandan local breeds (Inyabo) has an advantage of being highly adapted to adverse environmental conditions, withstand periodic feed shortage, tolerance to heat stress and tropical diseases, walks very long distances in search of pasture, water and it is also believed to produce high quality beef (Figure 11).
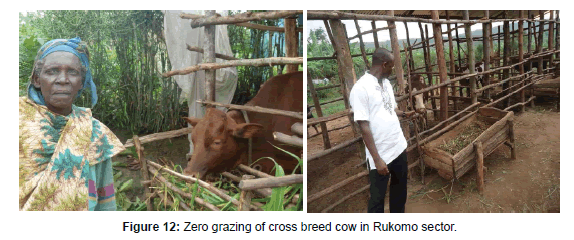
Zero grazing one of the upcoming rearing systems in areas of Rukomo and Matimba sectors on which animals are feed in-doors with limited movement in search for food and water. Most crosses and exotics are kept in with high milk yield (Figure 12).
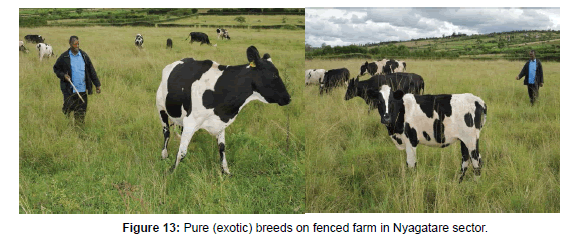
Most imported pure breeds grazing on fenced farms of Mr. Karegire who explained that the biggest challenge was from tsetse fly, feed concentrates and water otherwise they are highly productive in terms of production and reproduction traits (Figure 13).
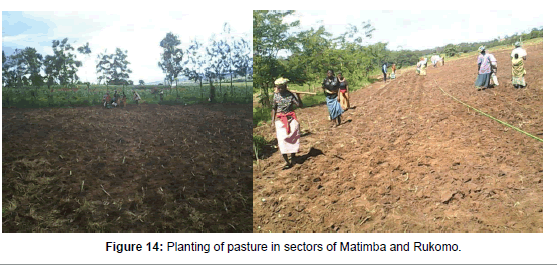
One of the main preconditions for a person to be given cow by the government or any NGO project is land. A selected poor person should have a small land to plant pasture and seeds are also provided for free (Figure 14).
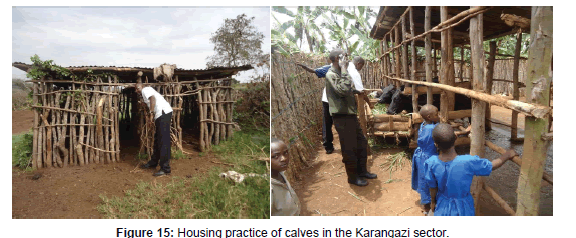
One of the commonest challenges in calf management in all sectors of the study area was housing both for calves and mature cows even in zero grazing rearing system (Figure 15).
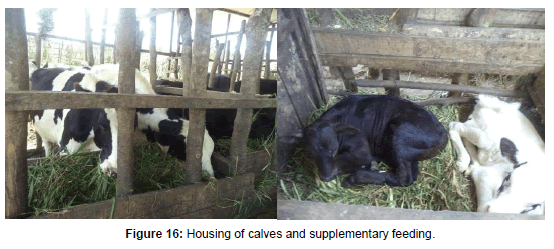
Most of farms that had cow and calf pens were semi-permanent (Figure 16).
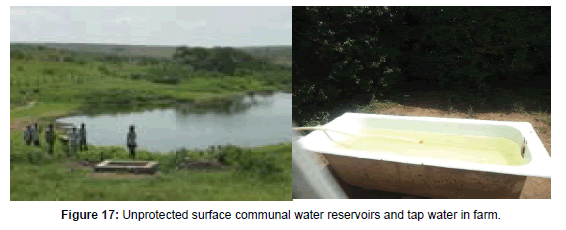
The only available water sources dry fast as the rain season ends and tap water from water supply company (WSAC) is not reliable because of being on and off (Figure 17).
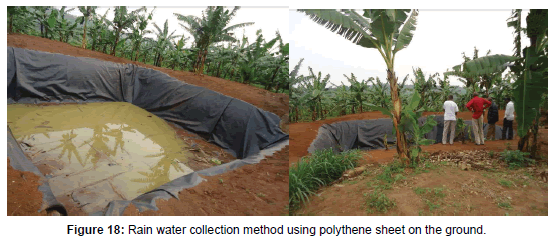
Collection of running rain water was the only solution but because of long dry period water dry off before the next rain season. Here farmers use underground polythene sheets and water tanks to keep water for their animals at least for few days (Figure 18).
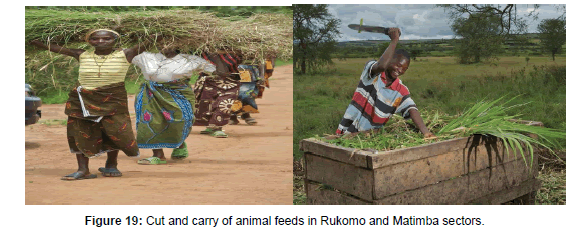
Feeds and feed concentrates were the most challenging factors for all farmers on which some non cattle keepers sales the grass on kg to livestock keepers (Figure 19).
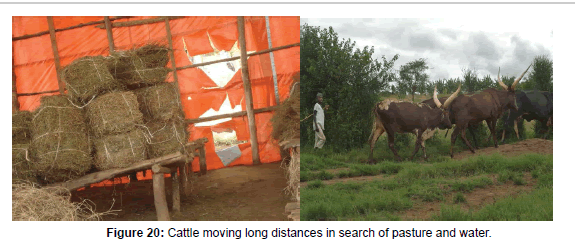
Lack of pasture and water was the most problem reported by all farmers in the study area and the only solution is to harvest and preserves pasture during rain period (Figure 20).
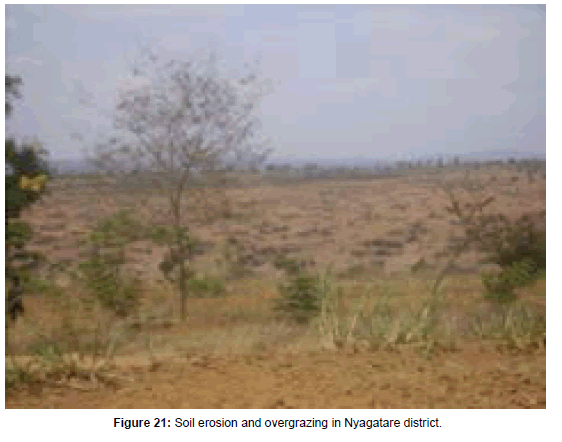
It was observed that during dry season all sectors become dry windy where soil erosion is much common during rainy season (Figure 21).
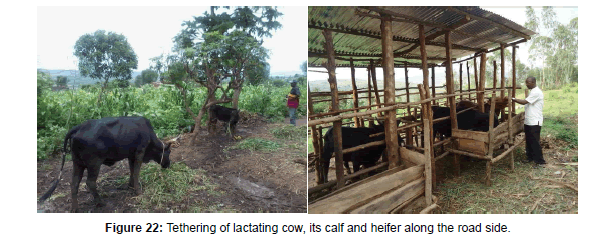
This was mostly seen in Rukomo sector where land is not enough for both animals and crop production. It was a great challenge leading to low numbers of cattle head per household (Figure 22).
Discussion
Livestock production in Nyagatare District has undergone many changes since 1994 genocide. In 1994, there were large scale losses of livestock as a result of war and later there were high influx of livestock from neighboring countries and many farms were established. This study generally aimed at characterizing the cattle production systems in Nyagatare District, Eastern Province of Rwanda with the following specific objectives: To assess the current husbandry and management practices in the province, determine the prevailing herd structure, composition and production traits of cattle; find out the levels of evolution of cattle production systems and establish the major farmers’ challenges and constraints faced in cattle production in Nyagatare District.
Most respondents were in the modal range of 41-50 years of age; this shows that the youth in the study area were less involved in cattle keeping. With regard to educational level most of the farmers had primary education and only (3.4%) had attained tertiary education with such low education level adoption of new technologies is likely to be very low. It was established that there was a variation in distribution and size of farms in Nyagatare District. We observed that sectors along Akagera national park had larger farms than elsewhere. This could be attributed to low human population in the vicinity of the National Park which was more rural. So, there is less human and animal competition for land for survival as most humans tend to settle more in urban centers [19].
Also, this is so because for resettling, more land was curved from the park to support livestock production and livelihood. This is also the reason why there were more of the privately-owned farms and this was supported by Government intervention to promote livestock production [7]. This could also be the reason why families had large family sizes of 6.74 ± 0.32, members kept together. This was higher than sub-Saharan average of 5.6 [57] but below Rwandan national average of 7.4 [8] which is a result of polygamous practices and belief that many children are for safety and wealth. This also been reported by Agajie et al. [58] that having many wives is one of the wealth indicators and commonly practiced types of marriage in the Central Rift Valley.
In all sectors in the study area, farmers stressed the lack of livestock feed to be the most important limiting factor for productivity of their cattle, and indicated the importance of improving their feeding regime as an essential step towards any improvement program. Free grazing of rangelands was the most common feeding system. During the shortwet season grasses grow rapidly producing abundant biomass. The production level of the grazing animal is at its best during this period, but with the onset of the dry season both quantity and quality of the pasture herbage decline and fail to support any performance demand. Majority of farmers (96%) relied on natural pasture for their livestock. Out-grazing on pastures was the commonest 233 (64.7%) practiced rearing system followed by zero grazing at 84 (23.3%). This was statistical signifince (X (0.001), P<0.05) differed among different sectors. This agrees with the report by EADD [55] that farms in Rukomo sector mostly practiced zero grazing. This was because of the small land tenure system in place.
It was also observed that these people are more in urban centers with government production programs. In the same place, we further observed that they had more of exotic and crosses that required more attention. The study also noted that communal grazing still occurred in sectors close to Akagera national park (Rwemiyaga and Karangazi) though it is against national policy of total fencing and limited movement of cattle in Rwanda [7]. This could be attributed to availability of sufficient land near Akagera national park buffer zones. Also, the large cattle herd size kept by farmers near Akagera national park forced them to practice communal grazing given high stocking rate.
In addition to keeping animals, it was observed that most farmers practiced mixed farming (92%) of livestock and crops with maize and beans being the main crops. This is typical of cattle production in developing countries as stated by Dixon et al. [13] and Brunori et al. [43]. This was carried out to always provide supplements especially during the dry seasons as well as support the family in terms of food.
Though supplementation was also done using food crop residues, most of farmers depended solely on natural pasture grassland to feed their animals [59]. This could be the reason for low levels of production growth as previously reported by TechnoServe [10] and Okello et al. [60].
Lack of supplementation of animal feeding leads to reduced yield in cattle production. Nyagatare, Matimba and Rukomo sectors had the largest proportion of cross breeds and pure breed dairy cows and therefore a higher tendency towards intensification.
This could also be explained by low levels of education observed among the farmers studied in Nyagatare. Supplementation was carried out by less than 30% of farmers who used crop residues that are deficient in protein and minerals which is a requirement for good feed rations [61]. Rice bran was still minimally used despite being abundant in the area [62,63]. There is no use of industrial dairy meals, seedcakes and pellets. A discussion with farmers of Karangazi Sector during this study revealed strange arguments that giving crop residues or crop supplement was considered as a way of training cows to raid crops and the fine are heavy for owners. Problems of seasonal availability of roughage feeds can be minimized through conventional feed conservation practices like hay making, silage making and straw treatment so that sustainable supply of roughage feeds can be ensured throughout the year as it was observed that in Nyagatare district a lot of animal feeds are abundant in wet season.
Inadequate access to water for both human and livestock use during the dry season was also identified as a major problem in the area. Valley dams and rivers were the major sources of water reported at 59.2% and 21.1% respectively. Even the available water sources were also reported to be far away over 3 km from the farms and animals had to trek on average 3 km in search of drinking water. And this was later listed among the challenges in cattle production at 89.7% of farmers having no water near or within their farms. This general trend of water sourcing is in agreement with [64,65] who reported similar results in Debre-Birhan area in Ethiopia. This could be due to the fact that Nyagatare District experiences long dry seasons and given the water source (valley and rivers), drying out of valley dams and rivers is a common phenomenon. Poor quality of water could be the reason why cases of helminths infestation among the animals were equally highly reported to exist on the farms [66] in the Blue Nile basin observed similar outcomes with high occurrences of diseases with poor water sources.
Given that the farmers did not have water sources on the farms and the main grazing system was out- grazing, most of the animal houses were temporary with limited few (6.4%) having permanent houses. Their existence varied significantly (p<0.05) among the Sectors. Rukomo Sector had the highest percentage at 69.6% of farms with animal houses, followed by Nyagatare Sector. Temporary shelters prevailed in all the other Sectors. Calf pens were the most 144 (66.1%) common animal houses on the farms. This could be as a result of the delicate nature of the calves as well as the only way to keep the calves away from their mothers when being milked. Poor record keeping was observed in the study area with over 90% of farmers reporting to have never keeping any records. This has a negative effect on giving reliable information about the performance of their cows, this study showed terrifying absence of record keeping. Very few of the interviewed farmers reported to have been recording the performances of their herds. This is equally observed with no better way of identification and this could be the reason for poor planning, feeding and production as well as following up reproduction performance of their animals. Turkson and Naandam [67] reported similar findings in ruminant production in East Mamprusi Districts of Ghana. Those that kept records used them in production, breeding, purchases, sales, mortality, calving, culling, diseases and feeding their animals.
In this study, record keeping was only carried out among farms that kept exotic breeds and majority kept indigenous breeds of animals. This could also explain why natural breeding with bulls remained the dominant mode of breeding with minimal use of AI. Rukomo had the highest percentage (52%) use of AI. This is attributed to the fact that the farms in Rukomo had low numbers of herd sizes, rarely crosses and exotics and had limited space for grazing and therefore preferred use AI as they could not afford to keep the bull on farm. It was also further noted that in the sector Rukomo together with Nyagatare Sector had Girinka projects that promoted use of AI with semen offered at subsidized price though the challenge of difficulty of getting inseminator and veterinary services remained a factor hindering cattle production but in the sectors of Karangazi, Rwemiyaga and parts of Matimba, majority of the respondents (63.1%) preferred natural bull service (natural mating) to artificial insemination for their own reasons that artificial insemination has high chance of resulting in the birth of male calves and the belief that natural (bull) service has high degree of conception.
Livestock diseases were also factors that were reported as a challenge. As reported by Zewdie [64] on economic losses due to disease and parasites as well as feed shortage, poor management practices and environmental factors are prevalent challenges of livestock production. Trypanosomiasis was most reported (73.4%) cattle disease especially in sectors (Karangazi 85%, Rwemiyaga 82.8%) bordering the Akagera national park. This clearly explains that the wildlife is a major reservoir of the disease and the Tse-Tse fly vector is very common in the area. This agrees with report by Devendra and Chantalakhana [68] a field survey on trypanosomiasis as a major challenging disease in Ethiopia. Helminthiasis was also reported to be a major disease burden especially in riverine sectors of Matimba (67%) and Nyagatare (64%). This could be due to poor water sources that predispose animals to acquisition of internal parasites. Tick borne diseases were relatively less reported as compared to trypanosomiasis and worms.
Majority of respondents in this study knew control strategies, but seemed not to practice them or they were overwhelmed by the occurrence of the challenges in addition to limited or no availability of veterinary officers for veterinary services to treat their sick animals and offer herd health advice. The many challenges indicated the scope for unimproved veterinary services in the study area and a need to establishing and extending veterinary service in the future to increase production of cattle in the area through reducing disease incidence and severity.
Farmers kept on rearing animals for the purpose of milk and it seemed to be the main target. As it was also observed that there was higher average number of cows compared to calves or bulls. The proportion is far higher compared to 30.45% on Boran breed in Kenya by Rewe et al. [69] given the breed was for beef. With regard to herd species composition cattle were most reared (90.6%) with goats 7.9% and sheep 1.5%, this supports the preference of cattle milk need as it is a culture in Rwanda than goats milk.
The cows kept had local breeds having high age at first calving 40.2 ± 0.33 months compared to their counterparts, i.e., 33.3 ± 0.40 and 29.1 ± 0.50 months for cross breed and exotics, respectively. Calving interval was low in local breeds and was lower than the findings of Taye [70] in Ethiopia who reported 54.1 months for Sheko breed whereas, Fakoya and Oloruntoba [71] in southern western part of Ethiopia reported 53.1 months for Raya-Sanga cattle. The difference could be as a result of genetic makeup that may influence maturity or even body size as most cases issues regarding to animal production is depended on animal size. The management factor especially nutrition determines pre-pubertal growth rates and reproductive development [72]. The differences in the reproductive performance of indigenous cows reported by the different researchers might be attributed to the existing differences in nutritional and reproductive managements among the smallholder cattle keepers in different parts of the country.
Similar reasons explain differences in calving interval (CI) and lactation yields. Low yields can also be attributed to poor nutrition (low availability of quality feeds) and low or no supplementation with commercial feeds as also stated by [29,33,53] The overall mean milk yields per cow per day of local, crossbred and exotic cows were 2.4 ± 0.08, 7.2 ± 0.34, 10.4 ± 0.36 L, respectively. This result for local cows is higher than the average milk yield per cow per day (1.84 L) of local cows with an overall average of 5.2 L for crossbred cows in Meiso district of Oromia Regional State [73]. In general, the higher average daily milk yield per cow reported in this study might be attributed to the difference in agro-ecology zone, nature of research (on-farm and on-station) and breed of animals characterized.
Many more factors including the above could be the reason of the results of scores on the ten management variables. Results revealed that the combined management practices of cattle farms in the study area were still at a medium level according score ranges. Most (54.9%) farmers were in block area of scores of a range of 41-70 and few (3.1%) with scores above 70. More evolutional signs were much seen in Sectors of Rukomo since they had embraced zero-grazing also under certain conditions. Through Girinka project, One Cow per family that donates either crosses or exotics under government poverty reduction some training of farmers as well as modern forms of production that is being offered exotic or cross breed animals and use of AI in the program [7] could have contributed to bigger score. There is therefore need for examining the drivers of evolution so as to expedite the process or overcome stagnation. In addition to examining the drivers of evolution, it was also great to look into the farmers’ challenges in cattle production.
Diseases, lack of water, feed shortage during the dry season, lack of breeding facilities, lack of information and extension services, limited land among others should be solved as were common problems experienced by most livestock farmers in the District. Studies since 1960’s indicate that cattle trypanosomiasis being endemic inside and outside the tsetse fly belt [74]. The challenges are mainly due to lack of able veterinary and production services to the farmers since most of the challenges can be handled by farmers but need professional advice. As a result, to lack of veterinarians, veterinary services are of high cost and drugs accessibility is even poorer. Lack of water and feeds especially in dry season could also be solved through preservation of rain water and available forage (Hay) in wet season which was not a common practice among all farms studied.
Conclusion and Recommendation
Conclusion
It was concluded that the main husbandry and management practice of animals was out-grazing of animals with temporary housing and animal identification based on color patterns, names and shape of the horns. Animals were mainly reared on small pieces of land less than 10 acres (overstocked) animals were left to feed on natural pastures with supplementation being carried out using food crops grown on the farm and industrial bi-products especially during the dry seasons.
Family size in the region is still very high at more than five members which demands high income per family. The cattle population in the study area affects a balance between the indigenous Ankole cattle and the various grades of cross breeding between Ankole and exotic diary breeds (mainly Friesian). The herd structure shows great potential for herd growth given the high proportion of mature cows.
Bulls are still the main mode of breeding as only (25%) the farmers were using artificial insemination. However artificial insemination was on the increase in all the sectors. Zero grazing was predominant in Rukomo sector (60%) whereas fenced farms predominated in Nyagatare sector (65%). It is notable that communal grazing has greatly declined with exception of Karangazi and Rwemiyaga at (10%). Crop residues and salt were the predominant modes of supplementary feeding (42%). Especially in Nyagatare sector where (21%) of the farmers supplemented dairy cows followed by Rukomo (18%) and Matimba only (5%). Rice bran was still very minimally used despite being abundant in the area. There was no use of industrial dairy meals, seedcakes and pellets.
Regarding the levels of evolution especially of cattle, a combined management practice of cattle farms in the study area were still at a medium level according score ranges. More evolutional signs were much seen in Sectors of Rukomo that demonstrated highest scores this was followed by Nyagatare, Matimba and Karangazi scoring the lowest at 29.33%. Generally, the evolution process of the cattle production system was still infant or it could have been stagnated in a mediocre level.
Most farmers reported diseases as a major constraint in cattle production in all sectors of the study area, Trypanosomiasis was particularly reported in Karangazi and Rwemiyaga followed helminthiasis in sectors of Rukomo and Nyagatare. This was followed by lack of water, feed shortage during dry season, lack of breeding facilities including veterinary services, lack of information and extension workers, lack of land, lack of capital, lack of housing, price fluctuation and lastly theft.
Recommendations
Farmers should adopt artificial insemination, improved pastures and introduce legumes in dairy nutrition, purchase diary meals and vita-mineral blocks for effective supplementation. Agro-processing and crop residues (bran) seed cakes should be widely used to reduce cost of supplementation. Farmers should regularly dip their cattle to control vector borne diseases. Farmers should form and strengthen diary cooperatives to facilitate the acquisition of farming inputs and milk marketing.
The Government of Rwanda should increase more water sources in all the districts of the region, train farmers in water resource management and should also further support research and extension activities in the livestock production sector. Need to develop short courses for training farmers and farm managers in areas of cattle feeds and feeding, AI, diseases management and control to reduce disease incidences and consequences and farm managing. Adaptive research is required in areas of cost effective feeding technologies.
The government through the National Agriculture Research System (NARS) should intensify research and extension on cattle production and management through the existing cooperatives so as to give skill to cattle farmers. Demonstration farms should be set up to facilitate research and extension and also to generate knowledge and the much needed improved breeding materials. There is therefore need for examining the drivers of evolution to synergize the process of evolution in production system in the district.
Acknowledgement
This study would not have been successful without the genuine and valuable support, guidance, and encouragement of my supervisors, friends, families, organizations and institutions. The first heartfelt thanks goes to my major supervisor Dr. James Okwee Acai, PhD of the Department of Veterinary Pharmacy, Clinical and Comparative Medicine, Makerere University, for supervising this work with great interest and dedication. My great thanks also goes to Dr, M.B. Mbuza Francis for your unreserved guidance, sound advice, and encouragement from Conception of research to the end of the study. Your criticisms, assistance, suggestions and encouragement were very constructive in the conception, development and understanding of this project.
I am equally indebted to the Borlaug Higher Education for Agriculture Research and Development (BHEARD) for supporting this research work thru the United States Agency for International development, as a part of the Feed the Future initiative, under the CGIAR Fund, Award number BFS-G-11-00002 and predecessor fund the food security and crisis Mitigation 11 grant, Award number EEM-G-00-04-00013 for financial support extended to me towards my masters of science degree. My sincere and special gratitude further goes to Mr. Gatari N Eugene, Mrs. Ndusha Lorraine and Felly Mbabazi who shared all the challenges with me during field data collection and encouraged, supported me in all stages of my study, thank you very much. I further extend my earnest appreciation to Mrs. Anne Schneller, Mr. Otieno Barack, Dr. Ann Nanteza and Professor. Michael Tukei, Dr. Samuel Okello for the moral, material and technical support accorded to me during the time of this work, may the Lord Almighty God bless you all.
I also deeply thank the administration of the University of Rwanda for granting me a long study leave that allowed me to persue my M.Sc. studies at Makerere University. I also extend special thanks to development agents of Nyagatare District staff who provided me valuable information towards this work. Life is always at its peak in the company of dearest friends like Dr. Tumwine Gabriel, Dr. Bernard Agwai, Mr. Udahemuka Jean Claude, Dr. Ndazigaruye Gervaise and Ms. Kagaga Shallon. Thank you very much for always being there for me.
Finally, my deepest and heartfelt gratitude also goes to my beloved Aunt Mrs. Mukasine Josephine who took the entire childhood burden of bringing me up, taking care of me and encouraging me during my study.
References
- Okech SG (2000) Structural characteristics of the hooves of cattle in free-range management system. Msc. Thesis Makerere University. Kampala.
- Isaac M (2005) Contribution du projet HPI à l'élevage bovin laitier au Rwanda : cas de la province de Byumba.Memoire, UNR Butare.
- Delgado C (2005) Rising demand for Meat and Milk in Developing Countries: Implications for Grasslands-based Livestock Production, in Grassland: a Global Resource. The Netherlands: Wageningen Academic Publishers, pp. 29-39.
- Rosegrant MW, Fernandez M, Sinha A, Alder J, Helal A, et al. (2009) Looking into the future for agriculture and AKST, in Agriculture at a Crossroads eds McIntyre BD, Herren, pp. 307-376.
-  Ministry of Agriculture and Animal Resources (2009) psta ii: strategic plan for the transformation of agriculture in rwanda – phase ii (2009). kigali: rwanda ministry of agriculture. National institute of statistics of rwanda 2012 population and housing census.
- Rutamu I (2008) Investment opportunities in the dairy sub-sector of Rwanda. SNV (Netherlands development organisation) & IFAD (International fund for agricultural development) report Kigali.
- MINALOC (2003) National Strategy Framework paper on strengthening Good Governance for Poverty reduction in Rwanda, Ministry of Local Government and Social Affairs, Government of Rwanda, Kigali.
- Kugonza DR, Bareeba FB, Petersen PH (2001) Response to phenotypic screening of mubende meat goats. Muarik Bull 4: 18-24.
- TechnoServe (2008) Dairy value chain in Rwanda: A report for the east africa dairy development program. Washington, DC.
- Steinfeld (1996) World livestock production systems: current status, issues and trends. Animal Production and Health Paper FAO. No127.
- Dixon J, Gulliver A, Gibbon D (2001) Farming systems and poverty: improving farmers’ livelihoods in a changing world. Rome and Washington, DC, FAO and World Bank.
- Roothart RL, Franzel S (2001) Farmers' preferences and uses of local fodder trees and shrubs in Kenya. agroforestry systems 52: 239-252.
- Ashley S, Nanyeenya W (2002) More than income: Pro-poor livestock development policy in Uganda. LADDER working paper. London, Department for International Development.
- Payne WJA (1990) An introduction to animal husbandry in the tropics. Long- man Scientific and Technical, New York.
- Nakimbugwe HN and Muchunguzi C (2003) Bahima pastoralist keepers of the longhorned Ankole cattle in Uganda. International Meeting of Indigenous Livestock Breeding Communities, Nairobi, Kenya, pp. 27-30.
- RBOS (2008) The genetic factor and environmental factor of milk composition.
- MINAGRI and NEPAD (2007) Long-term Framework for the implementation of the Comprehensive Africa Agriculture Development Program (CAADP): Guiding the economic development and poverty reduction strategy and supporting the strategic plan for agricultural transformation, Kigali.
- Dijkman J (2009) Innovation capacity and the elusive livestock revolution. LINK News Bulletin.
- Bebe BO, Udo HMJ, Rowlands GJ and Thorpe W (2003) Smallholder dairy systems in the Kenya highlands breed preferences and breeding practices. Livestock Production Science 82: 117-127.
- Butler WR (2000) Nutritional interactions with reproductive performance in dairy cattle. Anim Reprod Sci 60-61: 449-457.
- Wiggins S (2009) Can the smallholder model deliver poverty reduction and food security for a rapidly growing population in africa? background paper for the expert meeting on how to feed the world in 2050. Food and Agriculture Organization of the United Nations.
- Adekunle J (2007) Culture and custom of Rwanda. Greenwood Publishing Group.
- Perry BD, Randolph TF, McDermott JJ, Sones KR, Thornton PK (2002) Investing in animal health research to alleviate poverty. Nairobi: International Livestock Research Institute (ILRI), pp. 148.
- King JM, Parsons DJ, Turnpenny JR, Nyangaga J, Bakara P, et al. (2006) Modelling Energy Metabolism of Friesians in Kenya smallholdings shows how heat stress and energy deficit constrain milk yield and cow replacement rate. Anim Sci 82: 705-716.
- FAO (2009) Domestic Animal Diversity Information System. Food and Agriculture Organisation of the United Nations, Rome, Italy.
- FAO (2009) Domestic Animal Diversity Information System. Food and Agriculture Organisation of the United Nations, Rome, Italy.
- Shiferaw Y, Tenhagen BA, Bekana M, Kassa T (2003) Reproductive Performance of Crossbred Dairy Cows in Different Production Systems in the Central Highlands of Ethiopia. Trop Anim Health Prod 35: 551-561.
- Bruinsma J (2003) World Agriculture: towards 2015/2030, an FAO perspective. Rome, Italy.
- Mutimura M, Everson T (2011) Assessment of livestock feed resource-use patterns in low rainfall and aluminium toxicity prone areas of Rwanda. African Journal of Agricultural Research 6: 3461-3469.
- Thornton PK, Herrero M (2010) The inter-linkages between rapid growth in livestock production, climate change, and the impacts on water resources, land use, and deforestation. World Bank, Policy Research Working Paper 5187, Washington DC.
- Steglich M (2006) Participatory Assessment of Local Cattle Breeding Systems: The case study of Gambia. A PhD Thesis Presented to Humboldt University of Berlin, Germany.
- World Bank (2009) Minding the Stock: Bringing Public Policy to bear on Livestock Sector Development. Washington, DC.
- Otte J, Upton M (2005) Poverty and livestock agriculture. The Netherlands: Wageningen Academic Publishers, pp. 281-296.
- Food and agriculture organization of the United Nations FAO (2010) Statistical databases.
- Van Vuuren DP, Ochola WO, Riha S, Giampietro M, Ginzo H, et al. (2009) Outlook on agricultural change and its drivers, Washington, DC: Island Press, pp. 255-305.
- United Nations Population Division (2008) The 2006 revision and world urbanization prospects: the 2005 Revision," Population Division of the Department of Economic and Social Affairs of the United Nations Secretariat. World Population Prospects.
- Smith P, Martino Z, Cai D (2007) Agriculture, Climate change 2007: mitigation. Eldis Climate Updates.
- IFDC (2007) An action plan for developing agricultural input markets in rwanda. Kigali.
- Neumann CG, Bwibo NO, Murphy SP, Sigman M, Whaley S, et al. (2003) Animal source foods improve dietary quality, micronutrient status, growth and cognitive function in Kenyan school children: background, study design and baseline findings. J Nutr 13: 3941S-3949S.
- Brunori G, Jiggins J, Gallardo R, Schmidt O (2008) New Challenges for Agricultural Research: Climate Change, Food Security, Rural Development, Agricultural Knowledge Systems. The Second SCAR Foresight Exercise, Synthesis Report: EU Commission Standing Committee on Agricultural Research.
- Twinamasiko NI (2001) Dairy production agriculture in Uganda. Livestock and fisheries. Fountain Publishers/CTA/NARO, Kampala, Uganda 4: 18-42.
- SNV and IFAD (2008) Investment opportunities in the dairy sub-sector of Rwanda Report. SNV, Kigali.
- Herrero M, Thornton PK, Notenbaert AM, Wood S, Msangi S, et al. (2010) Smart investments in sustainable food production: revisiting mixed crop-livestock systems. Science 327: 822-825.
- Windig JJ, Calus MPL, Beerda B, Veerkamp RF (2006). Genetic correlations between milk production and health and fertility depending on herd environment. J Dairy Sci 89: 1765-1775.
- Roxström A, Strandberg E, Berglund B, Emanuelson U, Philipsson J (2001) Genetic and environmental correlations among female fertility traits and milk production in different parities of swedish red and white dairy cattle. Acta Agric Scand 5: 7-14
- ASARECA/ILRI (2012) Drylands development, pastrolism and biodiversity conservation in eastern africa.
- NISR (2014) Seasonal agricultural survey report national institute of statistics of Rwanda.
- CDI (2014) White Gold: Opportunities for Dairy Sector Development Collaboration in East Africa.
- Kamanzi M, Mapiye C (2011) Feed inventory and smallholder farmers’ perceived causes of feed shortage for dairy cattle in Gisagara District, Rwanda. Trop Anim Health Prod 44: 1459-1468.
- Adekunle OA, Oladele OI, Olukaiyeja TD (2002) Indigenous control methods for pests and diseases of cattle in Northern Nigeria. Livestock Research for Rural Development 14: 66-75.
- Nyiransengimana E, Mbarubukeye S (2005) Peri-urban livestock production in Rwanda. African Crop Science Conference Proceedings 7: 825-826.
- ILRI (2009) East African Dairy Development Project: Report of Participatory Rural Appraisal Baseline Survey of Smallholder Farmers in Nyagatare, Gatsibo and Rwamagana Districts of Rwanda. Kigali.
- Food and Agriculture Organization (2006) Livestock`s long shadow- environmental issues and options
- Agajie T, Ebrahim J, Sitotaw F, David G, Smith (2005) Technology Transfer Pathways and Livelihood Impact Indicators in Central Ethiopia. J Trop Anim Health Prod 37: 101-122.
- Mwebaze SMN (2002) Country pasture/forage resource profiles. In Grassland and pasture crops. Rome, Italy, FAO.
- Okello S, Sabiiti EN, Schwartz HJ (2005) Analysis of factors affecting milk yield of Ankole cows grazed on natural range pastures in Uganda. Afr J Range Forage Sci 3: 149-156.
- Modderman AML (2010) Dairy cooperatives in Musanze district, Rwanda. A research to explore future prospects for three dairy cooperatives in the Musanze district, Northern Province of Rwanda.
- PADEBL (2011) Dairy cattle development support project. Kigali: MINAGRI.
- Department of veterinary and Agriculture (2009). Report on livestock production and breeds, Nyagatare District local Government. Eastern Province, Rwanda.
- Zewdie W (2010) Livestock production systems in relation with feed availability in the Highlands and central rift valley of Ethiopia, MSc Thesis Haramaya University.
- Tesfaye M (2007) Characterization of cattle milk and meat production, processing and marketing system in Metema district, Ethiopia, MS thesis Hawassa Univ, Ethiopia.
- Descheemaeker K, Tilahun A, Amare H (2009) Livestock and water interactions in mixed crop-livestock farming systems of Sub-Saharan Africa: Interventions for improved productivity. Colombo, Sir Lanka: International Water Management Institute, pp. 44.
- Turkson PK, Naandam J (2006) Constraints to ruminant production in East Mamprusi Districts of Ghana. Ghana Journal of Agriculture Science 39: 155-164.
- Devendra C, Chantalakhana C (2002) Animals, poor people and food security. Opportunities for improved livelihoods through efficient natural resource management. Outlook Agric 31: 161-175
- Rewe TO, Indetie D, Ojango JMK, Kahi AK (2006) Breeding objectives for the Boran breed in Kenya: Model development and application to pasture-based production systems. Anim Sci J 77: 63-177
- Taye T (2005) On-farm phenotypic characterization of Sheko breed of cattle and their habitat in Bench Maji Zone, Ethiopia. MSc Thesis. School of Graduate Studies, Alemaya University, Ethiopia.
- Fakoya EO, Oloruntoba A (2009) Socio-economic determinants of small ruminants production among farmers in Osun state, Nigeria. Journal of Humanities, Social Sciences and Creative Arts 4: 90-100.
- Butkeviciene E (2009) Social Innovations in Rural Communities: Methodological Framework and Empirical Evidence. Social Sciences 1: 80-88.
- Desta Z, Oba G (2004) Feed scarcity and livestock mortality in inset farming systems in the Bale highlands of Southern Ethiopia. Outlook Agric 33: 277-280.
- Bourn DR, Reid D, Rogers D, Snow B, Wint W (2001) Environmental change and the autonomous control of tsetse and trypanosomosis in Sub-Saharan Africa: case histories from Ethiopia, Gambia, Kenya, Nigeria and Zimbabwe. Oxford Environmental Research Group Limited.
Citation: Eugene M (2017) Characterization of Cattle Production Systems in Nyagatare District of Eastern Province, Rwanda. Rheol: open access 1: 107.
Copyright: © 2017 Eugene M. This is an open-access article distributed under the terms of the Creative Commons Attribution License, which permits unrestricted use, distribution, and reproduction in any medium, provided the original author and source are credited.
Share This Article
Open Access Journals
Article Usage
- Total views: 85539
- [From(publication date): 0-2017 - Mar 31, 2025]
- Breakdown by view type
- HTML page views: 83724
- PDF downloads: 1815
