Research Article Open Access
Characterization of Al Matrix SiC Reinforced Sub-Micron Composites Produced by Mechanical Alloying
Dagasan E1*, Gercekcioglu E2 and Unalan S21Department of Materials Science and Engineering, Erciyes University, Turkey
2Department of Mechanical Engineering, Erciyes University, Turkey
- *Corresponding Author:
- Dagasan E
Department of Materials Science and Engineering
Erciyes University, Engineering Faculty
38039 Kayseri, Turkey
Tel: 90 352 207 66 66
E-mail: edagasan@erciyes.edu.tr
Received Date: March 17, 2017; Accepted Date: March 28, 2017; Published Date: April 05, 2017
Citation: Dagasan E, Gercekcioglu E, Unalan S (2017) Characterization of Al Matrix SiC Reinforced Sub-Micron Composites Produced by Mechanical Alloying. J Powder Metall Min 6: 164. doi:10.4172/2168-9806.1000164
Copyright: © 2017 Dagasan E, et al. This is an open-access article distributed under the terms of the Creative Commons Attribution License, which permits unrestricted use, distribution, and reproduction in any medium, provided the original author and source are credited.
Visit for more related articles at Journal of Powder Metallurgy & Mining
Abstract
In this study, properties of the aluminum matrix silicon carbide reinforced sub-micron composite powders produced by mechanical alloying were investigated. High purity Al and SiC powders were used as initial powders. To investigate the effect of SiC quantity 5, 10, 15 and 20% weight ratio of SiC particles were added to the aluminum matrix. Milling operations were conducted at 250 rpm under high purity argon atmosphere for 120 h by planetary type ball mill. Milling balls and vial were made of tungsten carbide. The milling system stopped for by various time intervals and samples were taken from the powder mixture. After milling operations taken samples were analyzed by SEM, XRD and BET surface area and porosity measurement systems.
Keywords
Mechanical milling; Aluminium matrix ceramic reinforced composites; Ball milling; Planetary ball mill
Introduction
Mechanical alloying (MA) is a solid-state powder processing technique in which powder particles are subjected to repeated cold welding, fracturing and rewelding by high energy ball mills [1,2]. MA is a dry processing technique and can be used to synthesize both equilibrium and metastable phase materials for different purposes [3]. The technique was originally developed by John Benjamin and his colleagues to produce oxide dispersion strengthened (ODS) super alloys for INCO around 1966 [1-3]. The MA process starts with loading desired powder mixture into the vial with grinding balls. By rotating the vial mechanical energy of the balls is transferred to powder particles. This transfer results in introduction of strain into the powder through generation of dislocations and other defects [2]. As these defects act as fast diffusion paths refinement of the particle and grain sizes of the powder particles occur [2]. Alloying of immiscible elements which is not possible by classical methods can be achieved by MA because it is a completely solid-state process [3].
MA operations are generally carried out under a protective gas atmosphere in order to prevent oxidation for a desired length of time until a steady state is achieved. While grinding ductile powder mixtures totally 1-2% wt. of a lubricant is added to the mixture in order to prevent cold welding of powder particles to each other and to the surfaces of grinding vial and balls. Other parameters that effect the final particle size and composition are raw material, type of grinding mill, type and size of grinding balls, charge ratio (ball-to-powder ratio), extent of filling the vial and milling temperature [1].
By the way, aluminum matrix ceramic particle reinforced composites (Al-MMC) provide an ideal combination of physical and mechanical properties like high specific strength and rigidity, wear resistance and electrical and thermal conductivity. Because of this reason a lot of studies were conducted combining advantages of Almatrix composites and MA process [4-15].
Kubota [4], used air atomized pure Al particles for mechanical grinding (MG) in order to use them as a matrix material for nanocomposites. Mechanical grinding operation was carried out under argon atmosphere by adding stearic acid (C17H35COOH) as PCA to the 100 μm particle sized Al particles. MG operations were conducted for 4-64 h by using SPEX type shaker mill. After milling powders were heat treated between temperatures 573-873 K and sintered by using SPS technique. By performing XRD analyzes and mechanical tests (micro hardness and compression tests) were performed to the final structures as a result it can be said that MG operation has an increasing effect on micro hardness and compressive proof stresses of the powders. Braphu ve Suryanarayana [5], studied on synthesis and characterization of Al- Al2O3 composites in order to observe effect of particle size and weight ratio of the reinforcing powder in Al-matrix composites. They used Al2O3 having particle sizes of 50 nm and 5 μm with changing weight ratios of 5-50%. They used SPEX type shaker mill for 20 h. From the results they have taken it is obvious that 50 nm sized particles can be homogenously dispersed into the aluminum matrix by MA/MM even at the wt. ratio of 50%. Monazzah et al. [6] also studied on the Al- Al2O3 composites produced by MM by the help of a planetary ball mill. After consolidating mechanically milled composite powders by hot extrusion they evaluated creep behavior of specimens. In addition they stated that creep behavior of the Al-Al2O3 nanocomposites is related with a parameter called threshold stress and that threshold stress decreases with increasing extruding temperature.
B4C is one of the most common reinforcing elements for Al- MMCs produced by MA/MG [7-11]. Khakbiz ve Akhlaghi [7], used Al 6061 alloy as a matrix material and 0,7 μm sized B4C particles as reinforcement in order to produce nanocomposite powders by MM. They reported that after 110 h of milling by attritor, powder particles reached a homogeneous structure. Similarly Abenojar et al. [8], studied on an Al-10% B4C system obtained by MA. MA operations were held by a planetary ball mill for 12 h. After alloying operations the powder mixtures were consolidated by sintering under pressures of 500, 600 and 700 MPa. Nie et al. [9], mechanically alloyed 27 μm sized Al and 7 μm sized reinforcement powders under Ar atmosphere by using a planetary ball mill for 5 h. They added 2% wt. stearic acid to the powder mixture as PCA. After MA process they consolidated powders by cold pressing, hot pressing and extrusion, respectively. As a result, they stated that a uniform distribution of reinforcing element into the Al matrix can be achieved by 5 h of MA. By analyzing the state of the interface they also reported that MA process supplies a good bonding between the matrix and the reinforcing element. In addition to these, Kubota [10] and Topcu et al. [11], also studied on solid state reactions and mechanical properties of Al-B4C composite materials produced by MM, respectively. Additionally other researchers used MA/MM process to produce Al-MMCs by adding different type of ceramic reinforcing elements like SiC [12,13], and AlN [14,15].
Experimental procedure
High purity (99.8%) Al (Alfa Aesar-Al 00010) and high purity (≥97.5%) SiC (Aldrich-357391) powders were used as initial materials. The average particle sizes of Al and SiC were -40+325 (44-420 μm) mesh and -400 mesh (37 μm), respectively. In order to investigate the effect of the reinforcing powder 5, 10, 15 and 20 wt.% SiC powders were added to the Al powder. Pure Al powder was also used as reference material. Powder mixtures were mixed and loaded into the vial under high purity argon atmosphere by using a MBRAUN GB-2202-PVAC glove box.
Milling operations were conducted by a FRITSCH Pulverisette 6 type planetary ball mill by using tungsten carbide (WC) vial and balls. 2 of 20 mm and 26 of 10 mm diameter WC balls were used together by keeping the ball-to-powder weight ratio (BPR) constant as 10:1 (Table 1). Rotational speed and milling time were kept constant during all milling operations as 250 rpm and 120 h, respectively. 1.5 wt.% stearic acid (CH3(CH2)16COOH) was added to the system as process control agent (PCA).
| WC Ball Diameter(mm) | Unit Weight(g) | Number of Balls | Total Weight(g) |
|---|---|---|---|
| 10 | 80,915 | 26 | 210,379 |
| 20 | 628,129 | 2 | 1,256,258 |
| Total Ball Weight (g) | 3,360,048 | ||
| Total Powder Weight (g) | 33,600 | ||
Table 1: Total Number and Weight of Used Balls.
Milling operations were stopped by time intervals of 30 h to take samples from the powder mixture. Taken samples were then used for SEM, X-RD and BET surface area analyzes. Particle size analyzes were then realized on the SEM images by the help of an image processing software named Image ProPlus.
Results and Discussion
SEM images and morphological analyses
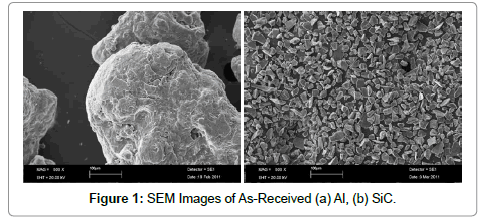
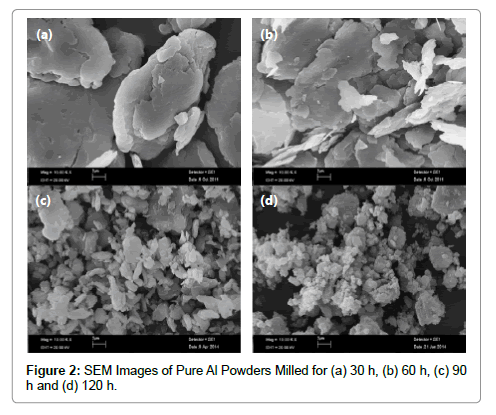
The morphology of the specimens was examined by a LEO 440 type scanning electron microscope. SEM images of the as-received Al and SiC are given in Figures 1 and 2 gives the microstructural evolution of pure Al during MM for 120 h. While as-received pure Al particle were spherical in shape they became flattened by mechanical milling process.
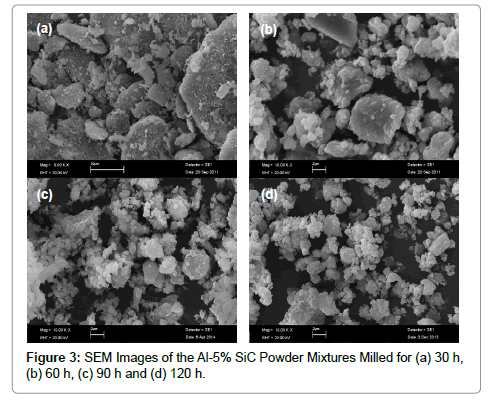
Figure 3 shows the morphological changes in Al-5% SiC powder mixture during milling. Because of the weight ratio of SiC is less in the powder mixture, the sequence of the milling steps is similar with pure Al.
It can be said that spherical matrix became flattened by deformation and reinforcing particles were broken into pieces as the milling time changed from 0 to 30 h. And the flate-like particles carried on their existence till 60 h of milling. It is also obvious that after 120 h of milling flattened particles were broken into pieces and sharp edges got round. Also by decreasing particle size agglomeration tendency of the particles increased.
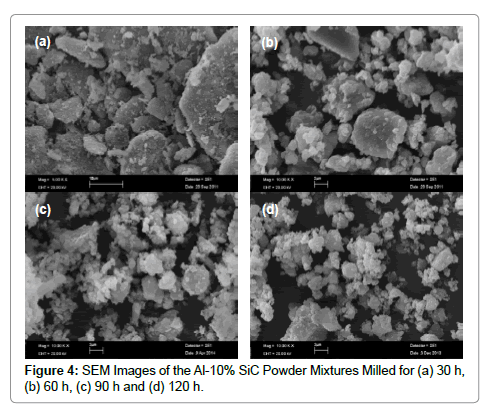
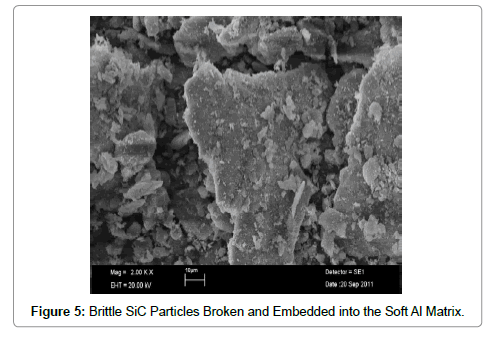
Effect of milling time on the morphology of Al-10% SiC composite powder mixture is given in Figure 4. Similar morphological steps like flattening at the initial stages of milling, cold welding of the particles and fracturing can be observed. However, number of the cracked brittle SiC particles increased because of the increasing weight fraction of the reinforcing elements. At initial stages of milling (Figure 5) small brittle SiC particles embedded on the flattened ductile Al particles can be observed.
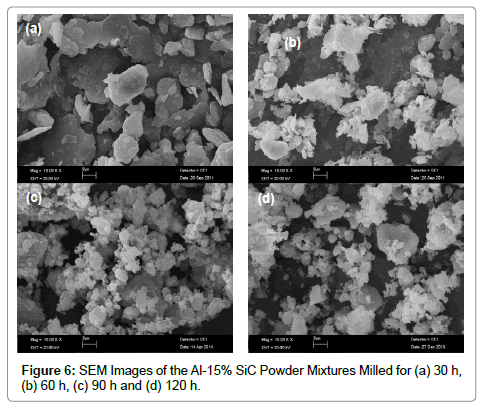
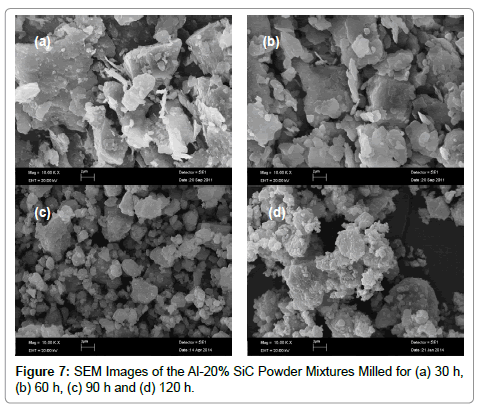
By evaluating Figures 6a and 7a it can be said that by increasing weight percent of SiC from 10% to 15% and 20% number and size of the flattened particles of the Al matrix got smaller at early stages of milling (Figures 6 and 7).
Particle size analyses
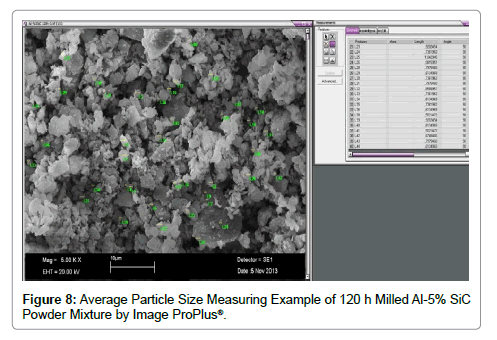
SEM images taken from 30, 60, 90 and 120 h milled powder mixtures were evaluated by means of particle size by using an image analyze program Image ProPlus®. For each specimen 12 pictures taken at six different magnitudes of 100X, 500X, 1 KX, 2 KX, 5 KX, 10 KX and 20 KX were used. An example for particle size measurement of the powder mixture Al-5% SiC is given in Figure 8.
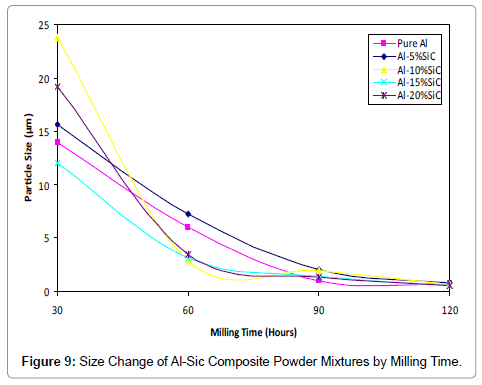
Figure 9 and Table 2 give the particle size change of Al-SiC composite powder mixtures by milling time and reinforcing element weight ratio. For all compositions it is clear that particle size decreases by increasing milling time. As seen just after early stages of milling process (30 h) average particle size of the samples changes in a wide range between 11.98-73.75 μm. Because cold welding mechanism is still active and powder particles are still soft. And when milling continued to 60 h it can be seen that particle sizes were still unsteady for different weight ratios of SiC.
| Milling Time (Hours) | Particle Size (µm) | |||
|---|---|---|---|---|
| Wt. % of SiC | ||||
| 5% | 10% | 15% | 20% | |
| 30 | 15.65 | 73.75 | 11.98 | 19.19 |
| 60 | 7.29 | 2.86 | 3.12 | 3.43 |
| 90 | 2.04 | 1.97 | 1.41 | 1.33 |
| 120 | 0.81 | 0.59 | 0.52 | 0.53 |
Table 2: Particle Size Change of Powder Mixtures by Milling Time and Weight Ratio of Sic.
However, because a steady state was reached between cold welding and fracturing mechanisms after 90 h of milling, particle sizes of the specimens became steady. When particle sizes of the 120 h milled powder mixtures with different weight fractions compared it can be said that final particle sizes were close to each other and approximately 0.5 μm except Al-5% SiC. Final particle size of this specimen was a little bigger than others (0.81 μm) because of the lower weight ratio of the reinforcing material.
XRD analyses
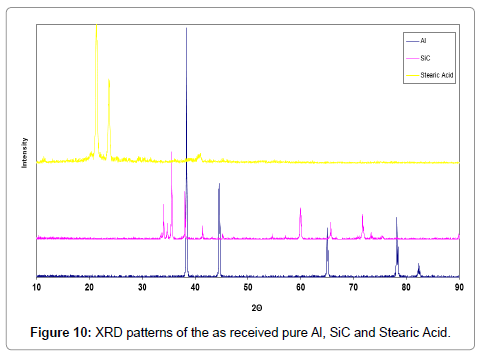
XRD analyses were carried out by a Bruker AXS D8 Advance type XRD analyzer with Cu Kα radiation (λ=0.15406 nm). XRD patterns were recorded in the 2θ range 10-90°. Figure 10 shows XRD patterns of the as received pure Al and SiC. In order to determine if any contamination because of the PCA added exists in the system XRD pattern of stearic acid is also added to the graph.
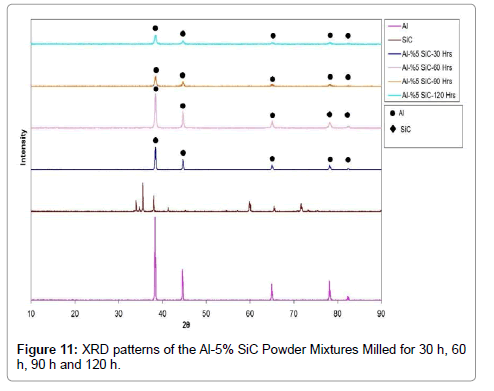
Figure 11 gives the Al-5% SiC powder mixtures’ evolution by milling time. It can be said that due to the low weight fraction of SiC all major peaks recorded in the pattern belong to Al. It is also obvious that by increasing milling time intensity of the peaks got lower and peaks broadened because of the finer particle sizes obtained by further milling.
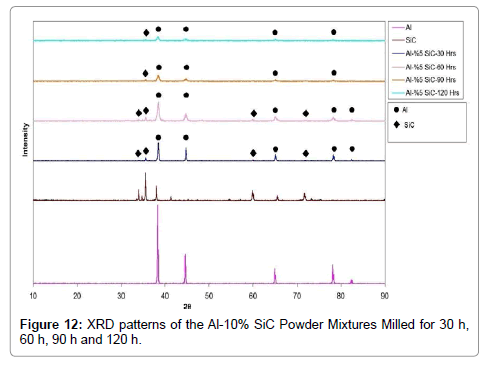
X-RD powder patterns of the Al-10% SiC powder mixture milled for different times can be seen from Figure 12. According to that SiC peaks that cannot be observed in the previous powder mixture added to the major peaks since the milling time of 30 h. For example, SiC peak at the 34, 2θ degree with an intensity of 63, appeared at 34,76 2θ degree with an intensity of 10. Similarly, 35,56 and 59,96 2θ degree SiC peaks can also be observed with intensities of 42 and 16, respectively. Additionally it can be said that by increasing milling time peaks of pure Al and SiC can still be observed with decreasing intensities. Like the previous powder mixture (Al-% 15 SiC) it can be still said that increasing milling time decreased intensity of the peaks while broadening them.
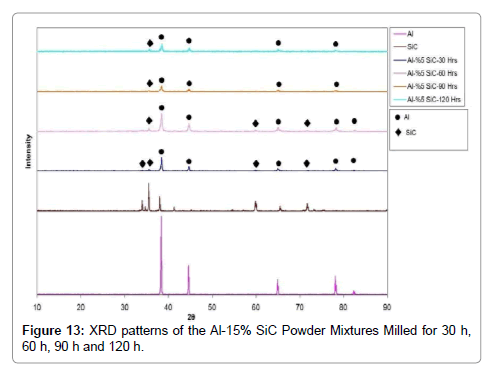
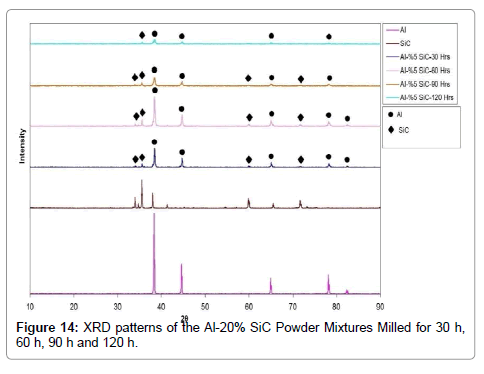
Al-15% SiC and Al-20% SiC XRD graphs can be seen in Figures 13 and 14, respectively. By increasing the %wt. fraction of SiC, number of the SiC peaks observed in the structure increases. And also, it is obvious that because of increasing weight fraction of SiC peaks of SiC started appearing in the system for longer milling times while major peaks of Al disappears at earlier milling times.
BET and porosity analyses
BET and porosity analyzes were both conducted by Micromeritics Gemini VII type analyzer by using nitrogen as adsorbent. Both singlepoint and multi-point BET surface areas were obtained by measuring the amount of nitrogen gas adsorbed by porosities of the structures. BET surface area and pore size results of the different weight fraction Al-SiC powder mixtures after 120 h of milling are given in Table 3. It can be easily seen that surface area results of all 120 h milled powder mixtures are higher than those of as-received Al and SiC because of the decreasing particle size by milling time.
| Specimen | Single Point Surface Area | BETSurface Area | Pore Size |
|---|---|---|---|
| (m2/g) | (m2/g) | (nm) | |
| As Received Al | 0,228 | 0,092 | 51,994 |
| As Received SiC | 1,603 | 0,865 | 28,570 |
| Al-%5 SiC(120 h milled) | 6,061 | 4,220 | 27,124 |
| Al-% 10 SiC (120 h milled) | 5,676 | 1,887 | 62,643 |
| Al-% 15 SiC (120 h milled) | 6,225 | 2,036 | 60,348 |
| Al-% 20 SiC (120 h milled) | 5,910 | 5,603 | 20,885 |
Table 3: Single Point Surface Area, BET Surface Area and Pore Size Results of the Different Weight Fraction Al-SiC Powder Mixtures.
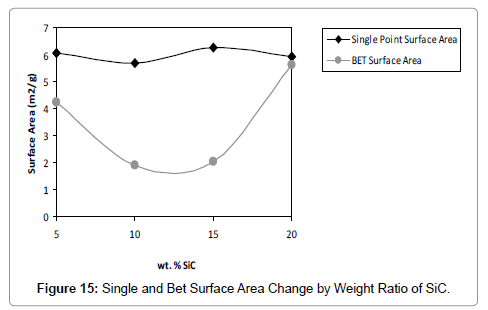
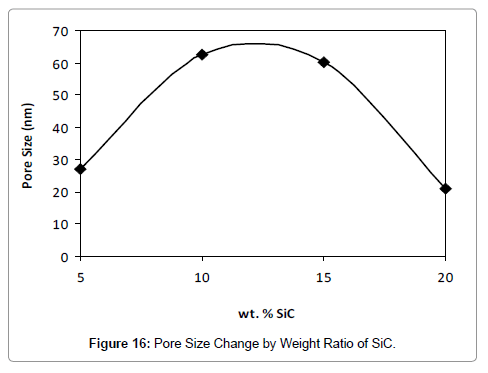
Despite single point surface area results of all specimens that change between 5.676-6.225 m2/g are close to each other, BET surface area results change significantly. The specimens with SiC content of 5% and 20% have BET results close to each other due to their lower pore sizes (Figure 15). By the way as can be seen from Figure 16 specimens with SiC content of 10% and 15% have significantly higher pore sizes when compared with others because of their relatively low BET surface area values. Between all 120 h milled powder mixtures the specimen with the composition of Al 10% wt. SiC has the lowest BET surface area and the greatest pore size value.
Conclusion
Al matrix sub-micron composite powders containing different% wt. of SiC reinforcement can be produced by mechanical alloying (MA) method. While initial particle sizes of the powders are 44-420 μm and 37 μm, after 120 h of ball milling particle size distribution varied between 0.52-0.81 μm. Microstructural evolution of the powder mixtures is also typical. During milling as-received spherical particles became flattened and then broken into pieces by means of consequent cold welding and fracturing.
Due to the XRD patterns in the 2θ range 10-90° it can be said that no contamination exists because of the vial, ball abrasion and stearic acid used as system PCA. For specimens that include small% wt. ratios of SiC, all major peaks recorded in the pattern belong to Al. By increasing milling time intensity of these peaks got lower and peaks broadened because of the finer particle sizes. While SiC wt. increases in the structure, more SiC peaks observed. These peaks also tend to broaden and get lower obtained by further milling.
Single point surface area results of all powder mixtures are close to each other. But BET surface area results change significantly. The specimens with lower pore sizes have BET results close to each other. Simply BET results change inversely with pore size.
Acknowledgements
This research was supported by Erciyes University Scientific Research Projects Unit (EU-BAP) with the project number FBA-10-2994.
References
- Suryanarayana C (2001) Mechanical alloying and milling. Progress in Materials Science 46:1-184.
- Suryanarayana C(2008)Recent developments in mechanical alloying. Reviews on Advanced Materials Science 18:203-211.
- Suryanarayana C, Ivanov E, Boldyrev VV (2001)The science and technology of mechanical alloying. Materials Science and Engineering A 304-306:151-158.
- Kubota M(2007) Properties of nano-structured pure Al produced by mechanical grinding and spark plasma sintering. Journal of Alloys and Compounds 434-435: 294-297.
- Prabhu B, Suryanarayana C, An L, Vaidyanathan R(2006) Synthesis and characterization of high volume fraction Al-Al203 nanocomosite powders by high-energy milling. Materials Science and Engineering A425:192-200.
- Monazzah AH, Simchi A, Relhani SMS (2010) Creep behavior of hot extruded Al-Al2O3 nanocomposite powder. Materials Science and Engineering A 572:2567-2571.
- Khakbiz M, Akhlaghi F (2009) Synthesis and Structural Evolution of Al-B4C nanocomposite powders by mechanical alloying. Journal of Alloys and Compounds 479: 334-341.
- Abenojar J, Velasco F, Martinez MA (2007) Optimization of processing parameters for the al-%10 B4C system obtained by mechanical alloying. Materials Processing Technology 184: 441-446.
- Nie C, Gu J, Liu J, Zhang D (2008) Investigation on microstructures and interface character of B4C particles reinforced 2024 Al matrix composites fabricated by mechanical alloying. Journal of Alloys And Compounds 454: 118-122.
- Kubota M (2010) Solid state reaction in mechanically milled and spark plasma sinteren Al- B4C composite materials. Journal of Alloys and Compounds 504: 319-322.
- Topcu I, Gulsoy HO,Kadioglu N, Gulluoglu AN (2009) Processing and mechanical properties of B4C reinforced Al matriz composites. Journal of Alloys and Compounds 482: 516-521.
- El-Eskandarany MS(1998) Mechanical solid state mixing for synthesizing of SiCp/Al nanocomposites. Journal Of Alloys and Compounds 279: 263-271.
- Wan-li G(2006) Bulk Al/SiC nanocomposite prepared by ball milling and hot pressing method. Transactionsof Nonferrous Metals Society of China 16:398-401.
- Abdoli H, Asgarzadeh H, Salahi E(2009) Sintering behavior of Al–AlN-nanostructured composite powder synthesized by high-energy ball milling. Journal Of Alloys and Compounds 473: 116-122.
- Abdoli H, Farnoush H, Salahi E, Pourazrang K(2008) Study of the densification of a nanostructured composite powder Part 1: Effect of compaction pressure and reinforcement addition. Materials Science and Engineering A 486: 580-584.
Relevant Topics
- Additive Manufacturing
- Coal Mining
- Colloid Chemistry
- Composite Materials Fabrication
- Compressive Strength
- Extractive Metallurgy
- Fracture Toughness
- Geological Materials
- Hydrometallurgy
- Industrial Engineering
- Materials Chemistry
- Materials Processing and Manufacturing
- Metal Casting Technology
- Metallic Materials
- Metallurgical Engineering
- Metallurgy
- Mineral Processing
- Nanomaterial
- Resource Extraction
- Rock Mechanics
- Surface Mining
Recommended Journals
Article Tools
Article Usage
- Total views: 4377
- [From(publication date):
April-2017 - Apr 21, 2025] - Breakdown by view type
- HTML page views : 3420
- PDF downloads : 957
